Nomenclature
-
 ${C_T}$
-
thrust coefficient
-
${A_b}$
-
rotor blade planform area
-
${a_\infty }$
-
freestream speed of sound
- b
-
SFS2 deck length
- d
-
total distance between two points
- n
-
number of blades or iteration number
- P
-
pressure
-
${P_\infty }$
-
freestream pressure
-
$\vec Q$
-
vector of flowfield properties
- R
-
rotor radius
-
$\vec S$
-
vorticity generated from bodies in a flow
- t
-
time
-
${t_{urans}}$
-
time of the uRANS near-body solver
-
${t_{wake}}$
-
time of the wake solver
-
$\vec V$
-
local velocity vector, (
$U,V,W$
) -
${\vec V_\infty }$
-
free stream velocity vector
- y
-
distance


Greek symbols
-
$\gamma $
-
ratio of specific heats
-
$\Delta $
-
number of time steps
-
$\phi $
-
velocity potential
-
$\rho $
-
local density
-
${\rho _\infty }$
-
free stream density
-
$\sigma $
-
rotor solidity,
$n{A_b}/\pi {R^2}$
-
$\vec \omega $
-
vorticity


1.0 Introduction
Vertical lift is experiencing a renaissance as the US military invests in two new helicopter replacements; unmanned air vehicles are integrated into multiple civilian and military use cases; the possibilities of Urban Air Mobility (UAM) and Advanced Air Mobility (AAM) have ignited imaginations across the globe; and new frontiers in the exploration of space by rotorcraft are opened. These designs expand on traditional helicopter configurations and can overtax existing software capabilities and user facilities, even while the community moves to embrace design via computation. These new design efforts are no longer limited to the major helicopter Original Equipment Manufacturers (OEMs), as a large number of small businesses and start-up companies are designing and building potential vehicles, further exacerbating these situations. These small businesses typically have fewer engineers, and they may not be experts in computational methods, so that learning curves may be steep. Further, while cloud computing is expanding, there may be limitations on the use of some solvers in the cloud. Finally, the overall costs in computing time may limit the application of high-fidelity computational methods. Concurrent with these efforts, the demand for more environmentally friendly and sustainable designs is leading to the development of distributed electric propulsion systems, with potentially many rotating systems on each vehicle that need to be evaluated, further straining computational resources. Beyond consideration of these new designs lies the necessary engineering and research to improve operational safety and upgrades to existing vehicles, for example, extensive development of efficient, accurate methods for shipboard air vehicle operations under the US Navy DIVE program [Reference Pritchard and Findlay1, Reference Smith2]. Existing vehicle upgrades may include more powerful engines that result in adverse aeromechanics phenomena that must be identified and corrected through operational changes or component redesign. These involve complex, nonlinear physics that, in the past, have required expensive flight and wind tunnel testing.
The computational fluid dynamics (CFD) capabilities that exist currently are now able, in the main, to capture these physics when applied with best practices and sufficient computational resources. Recent research has demonstrated the ability of specific unsteady Reynolds-Averaged Navier-Stokes-based (uRANS) methods to explain complex physics such as vortex splitting and pairing in the wakes [Reference Jain and Potsdam3, Reference Wissink, Kamkar, Pulliam, Sitaraman and Sankaran4]. However, these simulations require advanced turbulence models in the wakes, as well as computational meshes that can consist of hundreds of millions of grid points, well beyond the reach of most engineering and research organisations. These simulations provide a baseline of how accurate CFD can be given unlimited resources for physics exploration, and they act as the basis of correlation with less refined meshing. Some physics can still be explored with fewer grid points, augmented with large eddy simulation (LES) equations and sized to capture the salient length scales in the wake, when there are trusted experimental data available, and configurations are restricted to components rather than vehicles or systems [Reference Lynch and Smith5, Reference Hodara, Lind, Jones and Smith6]. Further reductions in mesh size that are conducive to routine engineering use can lead to larger errors, as observed in validation exercises, that may not be acceptable. For example, Crozon et al. [Reference Crozon, Steijl and Barakos7] applied a Navier-Stokes CFD simulation using the Helicopter Multi-Block CFD code to a Sea King helicopter landing on a Canadian Patrol Frigate, including rotating blades in the computational setup. The study was promising, but as it was limited by computational resources, the computational grid was under resolved, the dual time-advancement scheme employed a large physical time step of one degree azimuth rotation with insufficient subiterations for convergence, and aeroelastic effects were neglected.
Most engineering analysis and design requirements seek to determine aerodynamic and structural blade loads and deformations and, in some instances, interactional aerodynamics. There exists a suite of design-oriented solvers, such as RotCFD [Reference Koning, Acree and Rajagopalan8] and CGE [Reference Quackenbush, Whitehouse and Danilov9], that provide rapid initial analysis for design, but these have a number of assumptions and limitations that render them not sufficient for more detailed analysis. For more detailed analysis that includes aeroelasticity, comprehensive codes such as RCAS [Reference Bir10], CAMRAD II [Reference Johnson11], and DYMORE [Reference Bauchau12] provide high-fidelity computational structural dynamics. These comprehensive codes include potential-theory-based aerodynamics, such as lifting line theory or panel codes. Given these aerodynamic limitations, these comprehensive codes may also not capture physics of interest with sufficient accuracy, see for example the results of the HART-II workshop [Reference van der Wall, Lim, Smith, Jung, Bailly, Baeder and Boyd13, Reference Smith, Lim, van der Wall, Baeder, Biedron, Boyd, Jayaraman, Jung and Min14]. This is of particular concern during the development of novel designs without the availability of significant validation data.
Thus, there exists a gap between the design methods and expensive single-solver uRANS CFD methods. Dual-solver hybrid methods have been developed that resolve the configuration and the near field with the Reynolds-Averaged Navier-Stokes solvers, while the wake is resolved with vorticity-preserving methods that are more cost-effective. These dual-solver approaches can be integrated into an organisation’s workflow to bridge the gap between lower-fidelity methods and the expensive Reynolds-Averaged Navier-Stokes when there are complex physics present.
The concept of a dual-solver computational methodology is not new. First-generation dual-solver hybrid CFD methods were designed for main rotor analysis, where implementation decisions make them inaccurate or inflexible in analysis of complex aircraft configurations. The more well-known of these, GT-Hybrid/GENCAS [Reference Collins15] and TURNS-PWAM [Reference Thomas, Anathan and Baeder16], have been developed and maintained in academic environments. These codes predicted normal loads within 5% accuracy, but pitching moments and structural loads predictions were sometimes significantly less accurate (up to 30%–40%) than uRANS during validation with experimental data [Reference Smith, Lim, van der Wall, Baeder, Biedron, Boyd, Jayaraman, Jung and Min14, Reference Thomas, Anathan and Baeder16, Reference Makinen, Reed and Egolf17].
Dual-solver hybrid approaches have also been adopted by the US Department of Defense’s (DoD) CREATE-AV High Performance Computing (HPC) framework for vertical lift, Helios [Reference Wissink, Jude, Jayaraman, Roget, Lakshminarayan, Sitaraman, Bauer, Forsythe and Trigg18]. In this framework, the near-body solvers are uRANS solvers, such as FUN3D, OVERFLOW, and KCFD, and the wake is resolved with a Cartesian Euler and uRANS solver, SAMCART, which permits mesh adaptation [Reference Wissink, Potsdam, Sankaran, Sitaraman and Mavriplis19]. The Helios framework has been adopted by many US organisations who work with the DoD or who are developing dual-use vehicles.
Development of a new generation of dual-solver methods has been underway for over a decade to meet these new vertical lift design requirements and that can be integrated within existing organisational workflows. The remainder of the paper will discuss and recommend solver requirements, as well as the requirements of the coupling interface necessary to ensure solution accuracy and some best practices. Finally, areas of current development will be examined.
2.0 Considerations in selecting a dual-solver hybrid approach
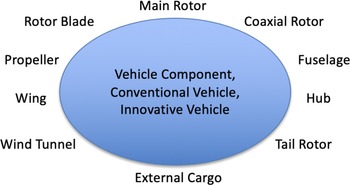
The development or selection of a dual-solver hybrid approach should include the establishment of the full range of applications and potential configurations on which the solver will be utilised. This includes not only the capability of the solvers themselves, but how well it will integrate with the current solvers used in the organisation. A sample range of components that may need to be modeled is included in Fig. 1. The capabilities may include not only the vehicle, but also external cargo, such as sling loads and the ability to model wind tunnels during validation.
An example of the different vehicle components that may arise in design and analysis of vertical lift vehicles.

2.1 An organisational workflow
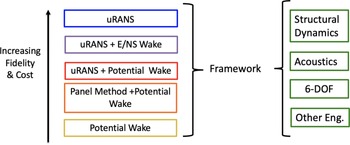
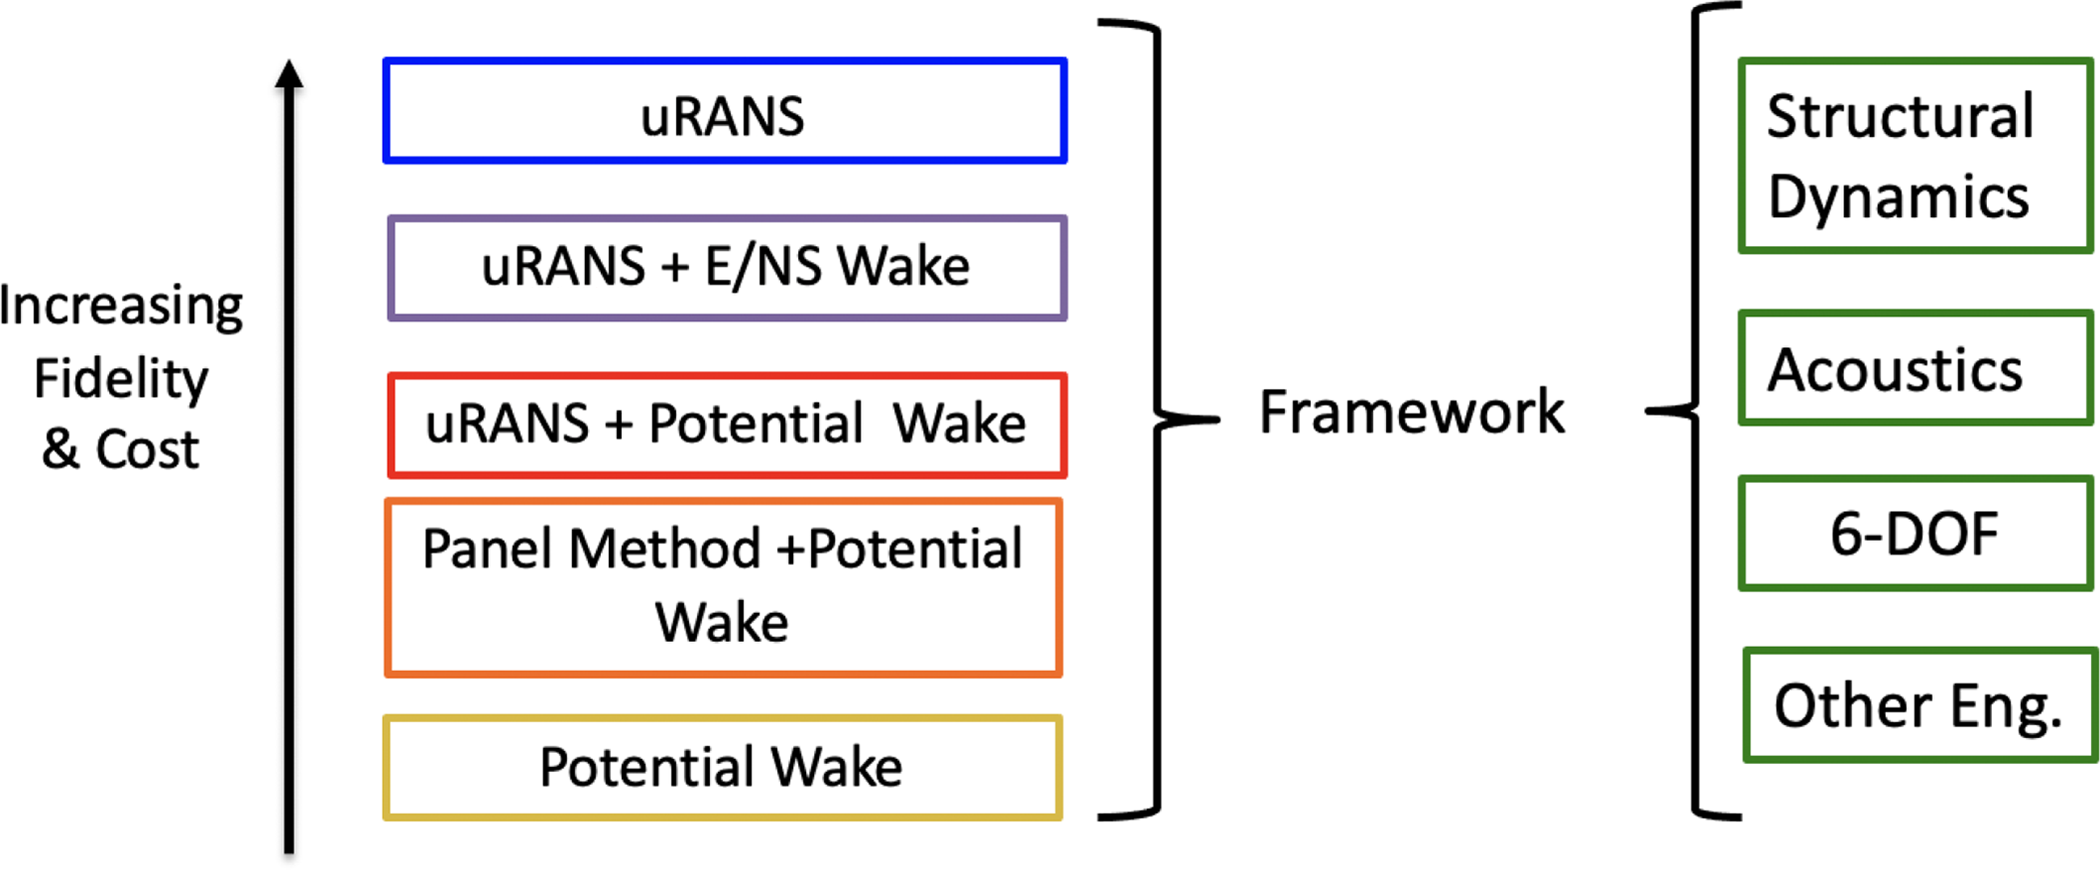
A major factor in the adoption of any dual-solver approach is the ease with which it can be integrated into an organisation’s workflow. An optimal workflow will integrate a dual-solver method that takes advantage of the computational design and analysis tools already in use to provide a full suite of capabilities from preliminary design to high-performance CFD uRANS analysis. An example of an organisational workflow is illustrated in Fig. 2. The rapid, lower-fidelity methods that tend to preserve vorticity over long distances and wake ages can provide the wake analysis for the range of near-body aerodynamics predictions from strip theory and lifting line for the most rapid, lowest fidelity approach to the CFD uRANS approach (moving from bottom to top of the options). The integration of the same solvers during multiple levels of the analysis hierarchy permits the reuse of input files and meshes, reducing not only the effort to create new meshes but also eliminating the potential of user errors when developing new input files. The use of identical codes will also minimise the uncertainties that arise between solver implementations.
Flowchart describing a vertical lift computational design and analysis workflow.
For production use, solvers that are professionally maintained are recommended, either through government organisations, such as NASA, ONERA, or the military, or they should be commercially available. This latter recommendation may require a license, but if the solver is already within the organisational workflow, there will likely not be additional charges. The technical development and support that accompanies these solvers provides a level of confidence in the workflow. Use of community open-source or academic solvers tend to require additional layers of validation when integrating new versions, as they usually do not implement the strict protocols needed for production code development, although there are some exceptions.
Another consideration is certification and qualification of the resulting designs or modifications. Development of dual-solver approaches should include, where possible, adoption of solvers that have been approved for use by the FAA or EASA for certification or are part of a required workflow for new vehicle development. In the United States, for example, the US Government contractors are applying the Helios framework in the development of Future Vertical Lift vehicles. Helios currently includes a baseline dual-solver hybrid approach with uRANS near-body options via a Cartesian offbody uRANS solver, SAMCART [Reference Wissink, Potsdam, Sankaran, Sitaraman and Mavriplis19]. Recent Helios development by independent researchers [Reference Moushegian, Smith, Whitehouse and Wachspress20] has resulted in a second dual-solver wake option that couples to a vortex filament solver, CHARM. This option is currently limited to use with the structured near-body solver, OVERFLOW. These external solvers and the coupling interface can be obtained from the developers and NASA.
2.2 Solver and method characteristics
The approach should include the capability to model advanced rotor configurations, where any number of rotors with arbitrary axes of rotation can be simulated, making full use of the native rotor tracking capabilities of the solvers through a flexible coupling procedure. If a full aeromechanics framework is desired, then the near-body uRANS solver should include the capability to independently couple with multi-body structural dynamics/comprehensive codes, aeroacoustics prediction solvers, and flight dynamics methods. This is preferable to attempting to model these capabilities within the dual-solver coupling interface to reduce its complexity. With this general guidance, a discussion on solvers that have been successfully integrated as dual-solver hybrid approaches and their limitations is warranted.
2.3 Navier-Stokes methods
uRANS solvers can provide detailed rotorcraft aeromechanics analysis through their ability to capture the unsteady, compressibility, and viscous effects which dominate the rotor wake near the blades. Multiple reference frames of motion are present when rotor blades and fuselage components are evaluated. Overset or sliding mesh techniques are required, which present both a computational cost penalty and an increase in engineering time for simulation setup [Reference Potsdam21]. Small computational time steps are also necessary because of the high rotational speed of the rotor blades, which makes simulations over even moderate time-scales extremely costly.
To address the design needs for modern vertical lift vehicles, the aerodynamics can not be evaluated in a vacuum. Modern uRANS solvers for vertical lift include the capability to assess aeroelastic effects for vibratory loading and aeroacoustics for mission survivability and community noise. These effects are usually assessed through coupling of the uRANS code with a structural dynamics/comprehensive code and an aeroacoustics code, respectively. In the selection of a uRANS solver for a dual-solver framework, the uRANS solver should include these capabilities and be well validated.
Some uRANS codes include the capability, either internal to the source code or via an external library, of reducing the wake costs through multi-block or oversetting of Cartesian meshes. For example, the NASA solver OVERFLOW includes the ability to overset a series of increasingly coarse Cartesian meshes in the far-field. Likewise, the DoD Helios framework includes a selection of structured and unstructured near-body uRANS solvers to resolve different portions of the vehicle, overset with a Cartesian mesh solver, SAMCART, in the wake. These Cartesian wake solvers may also include the abilty to do automatic mesh refinement (AMR) in the regions where wake vorticity is found. The AMR options not only help to prevent rapid dissipation of the wake vorticity through refined meshes, but as they keep most of the wake mesh coarse, they are very cost-effective. Options to solve the Euler equations in the Cartesian meshes are another approach to preserving the vorticity by removing the dissipative turbulence terms found in the Navier-Stokes equations. While these approaches may be considered as dual-solver approaches, the remainder of this work will focus on coupling of two methods where the wake is resolved by formulations other than uRANS or its simplification to the Euler equations.
2.3.1 Aeroelastic predictions
If aeroelastic predictions are required, the uRANS solver should include this capability as part of its stand-alone capabilities. Most uRANS solvers couple with a comprehensive solver, such as RCAS, CAMRAD II, DYMORE, or HOST [Reference Benoit, Dequin, Kampa, Von Grünhagen, Basset and Gimonet22], to provide the structural responses and trim based on the CFD predicted airloads. If the uRANS solver is to be utilised in a hybrid dual-solver framework, it is recommended that the mesh motion associated with rotor blade flexibility be self-contained within the single or set of near-body meshes that encapsulate the rotor. Rigid body motion, as well as the blade collective and cyclic angles and angular velocity are typically applied as rigid body motions to the blade meshes. These motions can be passed to the wake solver so that the rotor motion in the two solvers remain simultaneous. If the flexible motion of the rotor remains within the near-body meshes, it will minimise complexity and decouple the aeroelastic solution from the wake solver. This approach is utilised by most uRANS solvers in the US and Europe, including FUN3D, OVERFLOW, Helios, ElsA, Tau, and FLOWer. One exception is the solver by University of Glasgow [Reference Tan, Sun, Zhou, Barakos and Green23] where the meshes use sliding rather than overset meshes. Solvers such as these can still act as the near-body solver, though the entire rotor must be modeled via the contiguous approach (see Section 3.1).
2.3.2 Actuator disks/blades/lines
For distributed propulsion systems that include multiple rotors or propellers, it may be cost-effective to rely on actuator methods. Actuator methods computationally model momentum theory [Reference Leishman24] through the introduction of a pressure discontinuity on a mesh surface or as momentum sources in the volume. Enhancements can be made with the addition of, for example, swirl velocities and nonlinear loading. The actuator disk [Reference Chaffin and Berry25] acts as nonrotating surface, similar to a circular wing. Actuator approaches permit larger physical time steps compared to fully resolved blades. The actuator disk is unable to capture the helical structure of the rotor wake and the unsteady interactions with components within its wake.
Unsteady helical wakes can be modeled through actuator blades, also called actuator surfaces, and actuator lines, which rotate similar to rotor blades. Actuator lines are the simplest implementation, however, there exist singularities that must be addressed in the implementation along with some loss in the details of the helical wake [Reference Forsythe, Lynch, Polsky and Spalart26, Reference Oruc, Horn, Polsky, Shipman and Erwin27]. The actuator lines apply the blade loads on the quarter chord, similar to lifting line methods. Actuator blades or surfaces provide an estimate of the solidity (
 $\sigma = (n{A_b})/(\pi {R^2})$
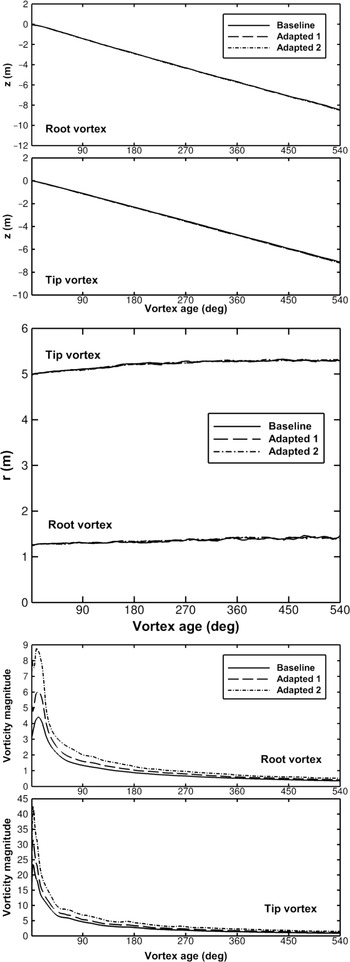
) of the rotor through a distribution of the sources over the area of the rotor blade planform to model the loading. Piecewise integration is performed along the rotor radius similar to strip theory. When coupled to a comprehensive code, these unsteady approaches can provide estimates of the rotor blade loads. For these estimates, the coupling needs to be closed loop or bidirectional so that the comprehensive code and uRANS solvers communicate through the sources. The actuator blade or surface method was introduced in 2005 by O’Brien and Smith [Reference O’Brien and Smith28, Reference O’Brien29] for rigid blades that relied upon a preprocessor to compute the interpolation with the mesh through each rotor revolution. This restriction was eliminated in 2014 by the introduction of a kd-tree search that permitted interpolation during the simulation at a cost negligible compared to the uRANS simulation. The strength and location of the vortex wake was demonstrated to be accurately computed compared with blade-resolved CFD and experiment [Reference Lynch, Prosser and Smith30], as illustrated in Fig. 3. Interest in the actuator surface approach has experienced a resurgence in recent years for application in both wind energy and distributed electric propulsion applications.
Actuator blades or surfaces for a wind turbine accurately predicts the axial vortex trajectory (left), radial vortex trajectory (middle), and vortex magnitude (right) compared with blade-resolved overset methods. From Lynch et al. [Reference Lynch, Prosser and Smith30].

2.4 Potential wake methods
Within a potential flow formulation, the lift generated by the rotor blades can be transformed into spanwise circulation distributions and vorticity is then shed into the wake in a variety of ways. Common models of potential wakes include a sheet of horseshoe vortices, a vortex lattice, or vortex filaments.
While the derivation of potential flow methods makes an inviscid assumption, viscous dissipation can be approximated post-hoc using corrections to the potential wake models. Potential wake models are most readily applied to fixed-wing and rotorcraft wake prediction due to the predictable shedding of vorticity at the wing or blade trailing edge. However, because the production of vorticity is primarily a viscous effect for these applications, circulation distributions must be prescribed or modeled using algebraic or experimental data fitting methods that can miss the higher-order aerodynamic effects present in rotor wakes, especially. When coupled to a uRANS solver, however, the circulation distribution in the potential wake solver can be derived from the sectional lift distribution computed by the highly accurate Navier-Stokes solution.
Vortex lattice and vortex filament methods have been successfully coupled to uRANS solvers in the past. When used in a dual-solver formulation, the potential wake solver should be able to accurately predict the rotor wake in the region near the uRANS boundary. This has been an issue when using a single tip vortex filament from each blade to represent the rotor wake, as in OVERTURNS-PWAM [Reference Thomas31], particularly because induced velocities are applied throughout the uRANS domain, rather than just the boundary. If the dual-solver framework is to be applied to interactional aerodynamic analysis, the potential solver should also be capable of handling wake-body interactions. As vortex lattices are highly structured, complex interactions between the rotor wake and a static body are likely to lead to a chaotic potential wake solution and inaccurate induced conditions on the uRANS boundary. Vortex filaments, on the other hand, have been used to compute interactional aerodynamics with accurate results [Reference Moushegian, Smith, Whitehouse and Wachspress20, Reference Quon, Smith, Whitehouse and Wachspress32]. The potential solver should also be capable of dealing with arbitrary motion of the rotors and blades for when manoeuvering flight and aeroelastic effects are present. Thomas et al. [Reference Thomas, Anathan and Baeder16], Makinen et al. [Reference Makinen, Reed and Egolf17], and Wilbur et al. [Reference Wilbur, Moushegian, Smith and Whitehouse33] demonstrate three different dual-solver uRANS/potential flow frameworks applied to aeromechanical analysis of the UH-60A rotor in forward flight. While all three methods were able to accurately predict sectional lift and drag within 5% of full uRANS predictions, the method of Wilbur et al. demonstrated unique capabilities in predicting blade structural loads and pitching moments.
The implementation of these methods is a Lagrangian computation, and it can lead to significant costs that diminish its benefits in a dual-solver approach. Fast multipole methods (FMM) [Reference Boschitsch, Usab and Epstein34] can be implemented to formally reduce the computational costs of evaluating the Biot-Savart relation from
 $\mathcal{O}({N^2})$
to
 $\mathcal{O}(NlogN)$
. FMMs have demonstrated the ability to easily resolve
 $\mathcal{O}{(10^{1 - 5}})$
elements or panels on desktop personal computers [Reference Boschitsch, Usab and Epstein34]. Further cost reductions are available through parallelisation.
2.5 Velocity-vorticity transport methods (VVTM)
An alternative formulation to the Navier-Stokes equations is the velocity-vorticity transport equation, which, when resolved are known as VVTM. The VVTM can be applied to both the incompressible or compressible formulations, although the incompressible formulation is more compact and can be been applied to many, but not all, rotorcraft wakes. The Navier-Stokes equations can be written in terms of the fluid vorticity,
 $\vec \omega $
, which is the curl of the fluid velocity field
 $\vec \omega = \vec \nabla \times \vec V$
, resulting in the vorticity transport equation
 \begin{align}\partial \vec \omega /\partial t + \vec V \cdot \vec \nabla \omega - \vec \omega \cdot \vec \nabla V = \nu {\vec \nabla ^2}\omega + \vec S.\end{align}
This is coupled to the Biot-Savart-induced velocity equation
 ${\vec \nabla ^2}\vec V = - \vec \nabla \times \vec \omega $
. As the name suggests, computational solutions to this set of equations more accurately conserve vorticity as it convects through the flow field compared to the uRANS formulation. Robust boundary conditions for wall-bounded flows are significantly more complex for VVTM solvers [Reference Kempka, Strickland, Glass, Peery and Ingber35]. Thus, it is more efficient if the vorticity from the configuration of interest,
 $\vec S$
is predicted with a near-body solver, such as a traditional uRANS or panel method.
The VVTM approaches are resolved on meshes that are typically Cartesian and on the order of 0.2–0.5 times the reference length, usually the rotor chord, for complex rotor-fuselage interactions. For areas where there is little vorticity, or the vorticity is of little interest, the mesh cell size can be significantly larger.
The coupling interface transforms the uRANS variables from the near-body meshes to include vorticity needed for the VVTM. Cartesian mesh generation and adaption optimises the time and memory associated with the VVTM wake. Further time savings can be achieved if the mesh extent expands at the convection speed. The most well-known VVTM solvers are VTM [Reference Brown and Line36], the seminal version of this approach, and VorTran-M/M2 [Reference Whitehouse37, Reference Whitehouse and Boschitsch38]. Like with Lagrangian formulations, FMMs can also be applied to grid-based schemes [Reference Whitehouse, Silbaugh and Boschitsch39] to reduce the computational cost. In addition to FMM, iterative Poisson solvers can also reduce computational costs; both approaches are available in a number of solvers and make these velocity-vorticity transport methods tractable for use in hybrid dual-solvers. The application of these algorithms is valid for both the grid- and particle-based velocity-vorticity transport solvers.
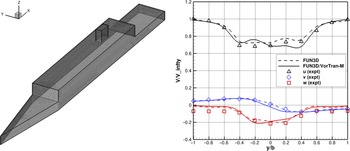
uRANS-VVTM dual-solver methods have been successfully applied ship airwakes [Reference Smith, Quon, Cross, Rosenfeld and Whitehouse40]. An example of these results are illustrated in Fig. 4. Cost savings were not realised over the full CFD solutions due to the lack of parallelisation, which has since been implemented into the VVTM solver, VorTran-M2. Current efforts include the development of a similar approach for wind farms.
Experimental correlation of wind predictions at 50% location of the aft landing deck on the Simple Frigate Ship model, SFS2. uRANS-VVTM (FUN3D with Vortran-M) solution are compared with URANS and LES predictions. From Smith et al. [Reference Smith, Quon, Cross, Rosenfeld and Whitehouse40].

2.6 Viscous vortex particle methods (VVPM)
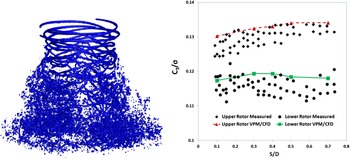
Viscous Vortex Particle Methods (VVPM) solve the vorticity transport equations by representing the vorticity field as a set of particles with discrete vorticity, location, and distribution function. A detailed discussion of how these particles are used to compute time-accurate flow fields can be found in Cottet and Koumoutsakos [Reference Cottet and Koumoutsakos41]. While the interaction of vortex particles with solid bodies can capture trends in the flow field [Reference Tan, Sun, Zhou, Barakos and Green23], the production of vorticity by solid bodies must be modeled separately, either by another fluid solver or with analytical models, such as a lifting-line model [Reference He and Zhao42]. Additionally, the cost of VVPM scales quadratically as the number of vorticity particles increases [Reference Anusonti-Inthra43], so in applications where vorticity needs to be tracked over large volumes, calculations will become prohibitively expensive without parallelisation and fast-solver approaches, such as those implemented in vortex filament and velocity-vorticity transport methods. An example of the wake captured with VVPM is shown in Fig. 5.
Visualisation of vortex particles wake (left) and thrust performance (right) for a coaxial rotor in a CFD-VVPM coupled simulation [Reference Rajmohan, Zhao and He45].

Dual-solver hybrid approaches using uRANS-VVPM have provided comparable results to uRANS methods for rigid rotors [Reference Zhao and He44, Reference Rajmohan, Zhao and He45]. One group coupled their VVPM solver with both OVERFLOW and OpenFOAM [Reference Jasak, Jemcov and Tukovic46] to study single and coaxial rotors, respectively [Reference Zhao and He44, Reference Rajmohan, Zhao and He45], successfully capturing the rotor thrust and power, as illustrated in Fig. 5. The savings for the hybrid analysis of the single rotor (attached flows) are reported to be 50% [Reference Zhao and He44] based on grid reduction, although no details on convergence behaviour are cited. The authors note that their VVPM solver is parallelised, but do not provide details of the mesh or convergence savings for the coaxial analysis over a uRANS analysis.
2.7 Lattice-Boltzmann methods
Rather than solve the continuity equations for a continuous medium on a grid like continuum-based Navier-Stokes methods, Lattice-Boltzmann methods (LBM) track particle velocities in a lattice by computing their advection and collisions through a distributed probability density function. These methods are more easily parallelisable than continuum-based methods, which in the future may allow for very fast turn-around times on Graphical Processing Unit (GPU) architectures. LBM have been used to compute coarse rotor wakes in the influence of ship superstructures [Reference Bludau, Rauleder, Friedmann and Hajek47, Reference Horvat, Hajek and Rauleder48] using actuator disk models of the rotor aerodynamics. However, viscous wall boundary conditions in LBM are non-trivial, and thus require immersed boundary treatment where adaptive grid refinement techniques tend to create very small cells in the viscous boundary layer [Reference Lintermann and Schröder49]. Thus, for cases with complex solid body geometry, the size of the computational grid becomes very large. If rotor blades are resolved, the frequency of grid adaptation will also be quite high. Additionally, accurate turbulence modeling in LBM requires similar levels of grid refinement as continuum-based uRANS methods. The presence of compressibility effects near the rotor blades requires a higher-order formulation of the LBM equations, increasing the cost compared to the more common “weakly compressible”/“essentially incompressible” LBM formulation [Reference Frapolli, Chikatamarla and Karlin50]. Finally, the primary advantage of LBM methods, namely the ease of parallelisation, cannot be utilised unless sufficient GPU resources are available and the method is written in the proper code format, neither of which are widespread at the time of writing.
Current research efforts are focusing on developing dual-solver approaches for LBM similar to those discussed earlier, in particular for very long age wakes. Currently, there have been methods demonstrated with pre-computed uRANS CFD [Reference Bludau, Hajek and Rauleder51, Reference Horvat, Hajek and Rauleder52] feeding into the LBM computed domain. These approaches are being extended to include near-body aerodynamic solvers to provide rapid ship-air wake computations for flight dynamic simulations, as illustrated with rotor blade element theory [Reference Bludau, Rauleder, Friedmann and Hajek47, Reference Bludau, Hajek and Rauleder51, Reference Horvat, Hajek and Rauleder52]. While promising for future study, the demand for cost savings on contemporary computing hardware means that alternative approaches such as GPUs are being explored.
3.0 The coupling interface
There are two primary methods for coupling two fluid-mechanics solvers into a dual-solver formulation to ensure that two-way coupling (closed feedback loop) is achieved. They are the field velocity and surface boundary methods. In the field velocity method, which is applicable to all but the uRANS wake solvers, the flowfields of the two solvers overlap. The induced velocities from the wake solver are added to each of the near-body uRANS velocities computed at every mesh point to act as perturbations to the uRANS soluiton. The induced velocities from the wake solver should not include the induced velocities from vortices inside the uRANS domain, which would double count these effects, resulting in responses that are nonphysical. This is similar to the implementation of mesh motion or flux corrections (depending on the solver type), but the near-body uRANS solver will need to be explicitly modified to include those induced velocity perturbation terms.
The surface boundary approach has the advantage that it can be applied to any of the proposed wake solvers, and the flowfield does not need to be modified. As most of the wake solvers are based on vorticity, the vorticity generated within the near-body uRANS solver acts as the inputs for the wake solvers which propagate this vorticity in the domains outside of the near-body uRANS mesh. The uRANS outer boundary flow field variables are computed from the wake solver values at the boundary locations. If the wake solver is incompressible and the uRANS solver is compressible, then care must be taken when prescribing the density and pressure or energy terms. The boundary conditions must properly represent the behaviour of the wake model, including unsteady terms, especially when the outer uRANS boundaries are very close to the lifting surfaces (see Sec. 3.2). Because the surface boundary approach only requires computations on the surface boundary nodes, which are a very small fraction of the entire mesh, this method is much more cost-effective than the field velocity method. Both approaches appear to give comparable results, when they are implemented correctly, per several dual-solver developers.
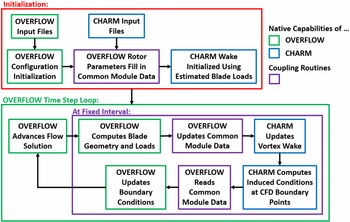
An example of an unsteady coupling framework is outlined in Fig. 6 for a uRANS-PWM approach, specifically OVERFLOW and CHARM. The uRANS and PWM solutions communicate to each other through the uRANS-computed blade loads and the PWM-computed CFD domain boundary flow conditions. This method allows the uRANS domain to be significantly reduced compared to a conventional uRANS simulation while still accounting for the effects of the full rotor wake. The coupling protocol usually exchanges data at every time step of the uRANS solver. One advantage of these wake solvers is that because of large meshes and/or simplified formulations, the time step can be much larger than the near-body uRANS solver, which not only has small steps for stability with its refined meshes, but also requires subiterations or other convergence algorithms at each time step. Thus, there is a mismatch of time steps that can result in large discontinuities or steps in the solution when the wake solver updates. Typical approaches are to apply linear interpolations. The impact of different interpolation algorithms is further discussed in Sec. 3.2.
Flow chart describing the operation of OVERFLOW-CHARM.

3.1 Near-body mesh alternatives
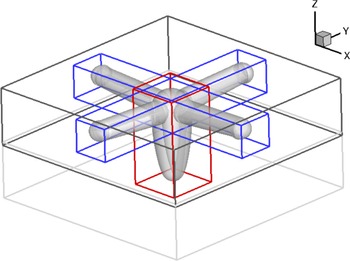
When the uRANS solver is applied to resolve the near-body configurations, there are two approaches to capture the salient physics that will be propagated downstream with the wake solver. The first is known as the contiguous approach, illustrated as the black outer box in Fig. 7. Here the outer boundaries of the uRANS solver encompass all of the different components to be resolved by the solver, wrapped in an intermediate mesh so that near-body interactional effects are captured by the uRANS solver. The contiguous approach can simplify the mesh generation by simply cropping the extents of stand-alone uRANS mesh, but at the cost of the additional memory and computational time that the uRANS solver will require to model the intermediate mesh.
Example of a four-bladed rotor with nacelle modeled using contiguous (black mesh outline) and non-contiguous (red and blue mesh outlines) approaches. Ref. [Reference Jacobson and Smith53].

Computational costs compared to the stand-alone uRANS mesh can be reduced by 10%–30% if a non-contiguous modeling approach is utilised. Here, as illustrated in Fig. 7, each rotor blade (red mesh extents) and the hub/nacelle (blue mesh extents) have individual meshes that are connected only through the dual-solver and coupling interface. While the mesh savings can be significant, the coupling interface must be designed with care. The Biot-Savart law, where the vorticity-induced velocity varies with
 $1/{d^3}$
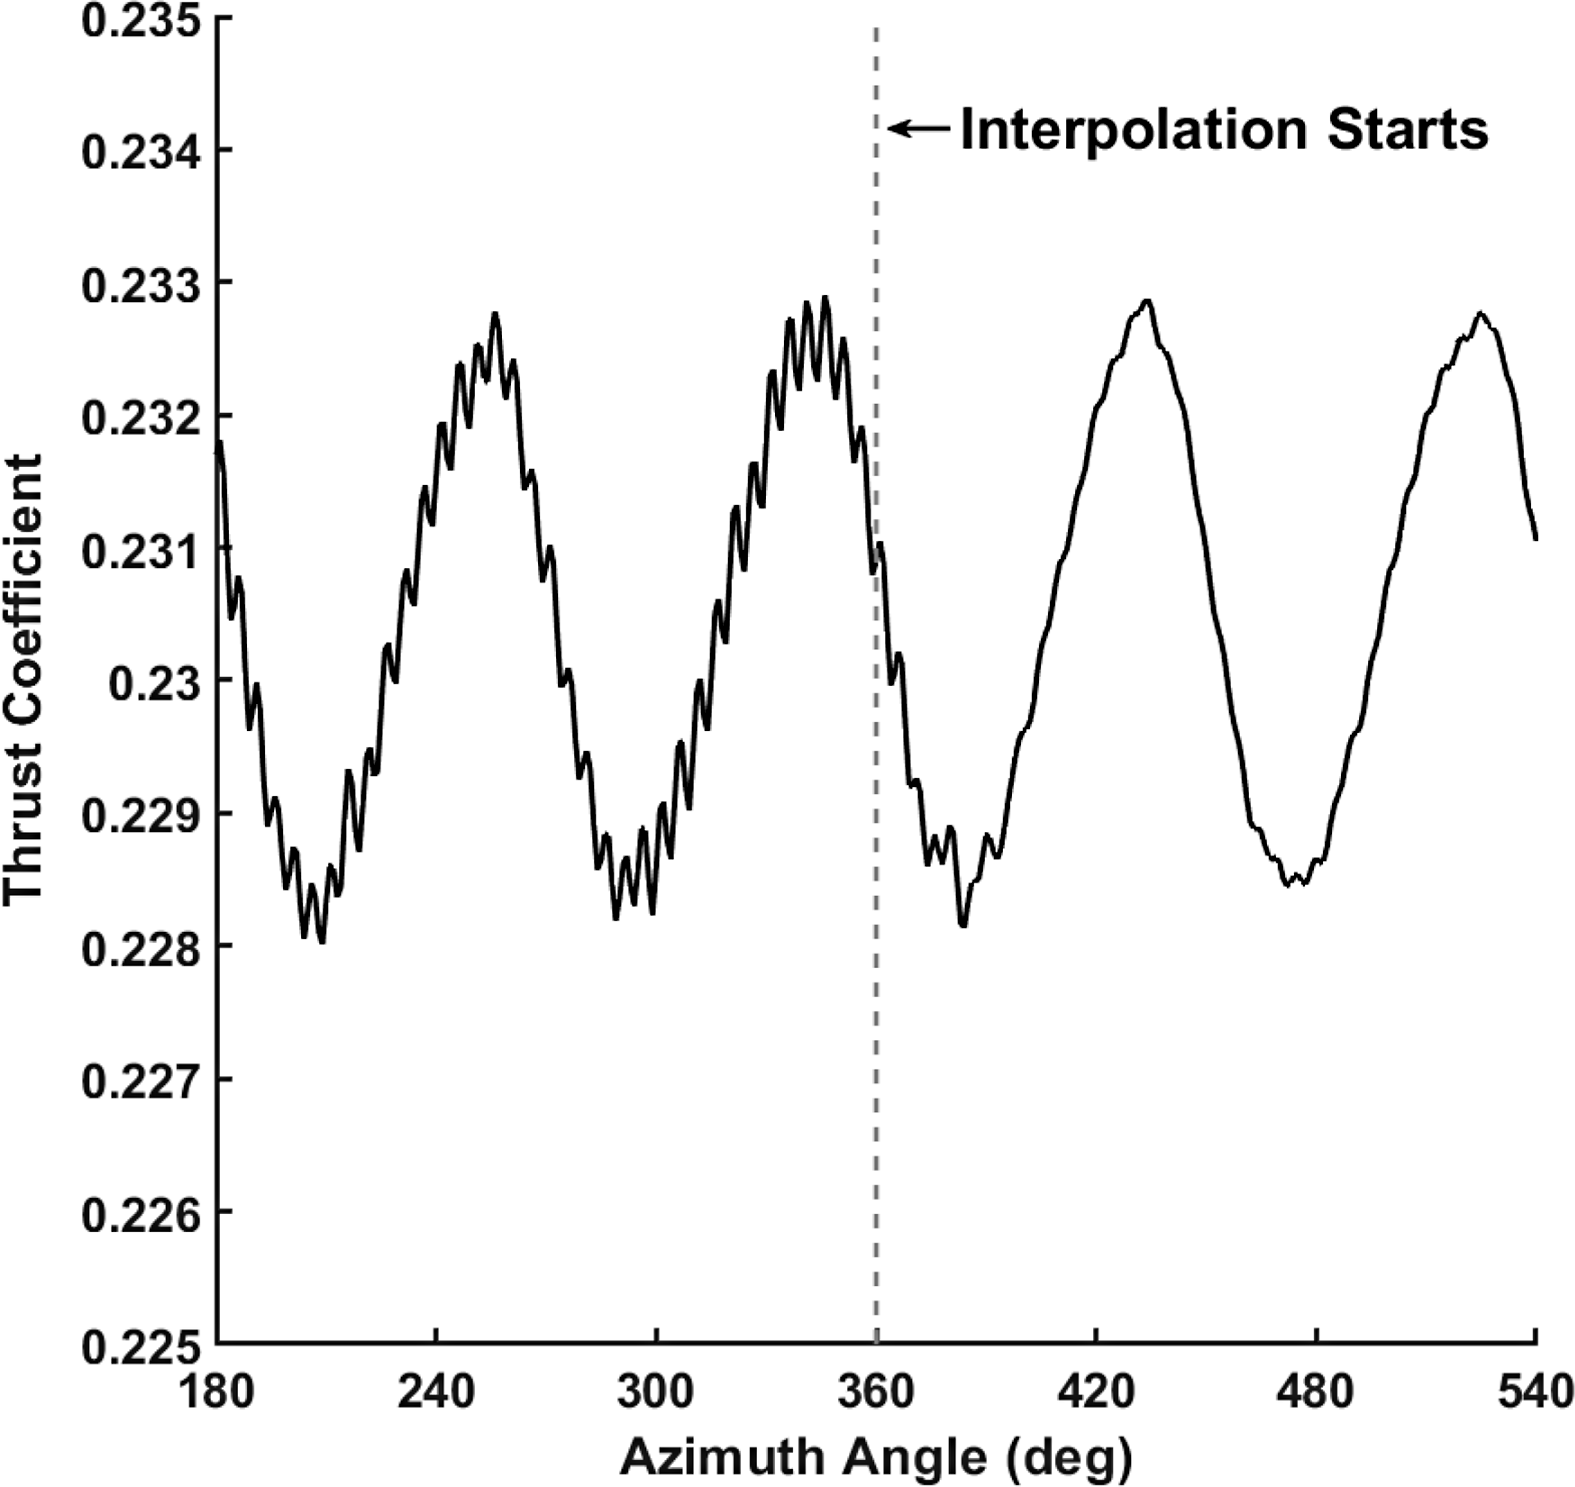
, indicates that induced velocities from the dual solver vorticity will be much stronger when applied to the closer uRANS mesh boundaries, and these may result in nonphysical oscillatory loading on the structure. Because the uRANS and dual-solver time steps may be significantly different, an interpolation scheme will be required as part of the coupling interface to reduce these oscillations, as illustrated in Fig. 8.
Comparison of dual-solver prediction of propeller thrust variation before and after boundary value interpolation is applied.

3.2 Boundary surface coupling issues
As the boundary surface approach is the most cost-effective and widely applied among dual-solver methods, some issues introduced earlier are further explored.
As discussed previously, when the surface boundary method is applied between a uRANS and wake solver, induced conditions from the wake solution are applied to the uRANS boundary. In particular, if the wake solver is incompressible and the uRANS solver is compressible, care must be taken in the computation of the pressure and density on the uRANS boundary.
Early implementations used free-stream conditions or isentropic relations to determine the pressure and density on the uRANS boundary which appear to work well, in particular for larger uRANS domains. Further exploration revealed that these implementations result in inaccuracies when the uRANS boundary is immersed in a highly unsteady region of the flow field, as in a non-contiguous hybrid simulation of a vehicle in forward flight. When the wake solver is based on potential flow, the boundary pressure can be derived directly from the rate of change of the potential flow solution of the free-wake solver,
 $\partial \phi /\partial t$
according to:
 \begin{align}P = {P_\infty } + \frac{1}{2}{\rho _\infty }\left( {U_\infty ^2 - U_{CHARM}^2 - 2\frac{{\partial \phi }}{{\partial t}}} \right)\!,\end{align}
and density can be computed using an assumption of constant speed of sound as follows:
 \begin{align}\rho = {\rho _\infty } + \frac{\gamma }{{{a_\infty }}}\left( {P - {P_\infty }} \right)\!.\end{align}
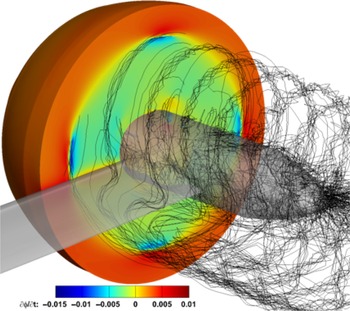
A snapshot of
 $\partial \phi /\partial t$
computed by a free-wake solver on a uRANS boundary behind a propeller is illustrated in Fig. 9. This approach measurably improves the accuracy of dual-solver predictions of rotary propulsion systems performance at negligible additional computational cost over the isentropic method [Reference Moushegian, Smith, Whitehouse and Wachspress54].
Snapshot of the time-derivative of the potential function
 $\frac{{\partial \phi }}{{\partial t}}$
on the uRANS boundary behind a propeller for the OVERFLOW-CHARM solver. From Moushegian et al. [Reference Moushegian, Smith, Whitehouse and Wachspress54].

The correct uRANS boundary condition to apply in these boundary surface coupling approaches has gone largely unanswered. Conventional characteristic boundary conditions (CBCs) based on Riemann Invariants have been applied without detailed investigation into their affect on the dual-solver solution. Common formulations of these conventional CBCs assume that the boundary is far from the region of interest, so they are not tailored to deal with adjacent regions of strong inflow and outflow and make no concerted effort to preserve the desired boundary flow on outflow boundaries. Moushegian et al. [Reference Moushegian, Smith, Whitehouse and Wachspress54] describe the undesirable effects of this approach, which can lead to large discontinuities in the velocity applied to the uRANS boundary and can impact the quality of the dual-solver solution. They propose a new dual-solver CBC that retains the benefits of a CBC without sacrificing the quality of the boundary velocity field by treating outgoing velocity characteristics identically on inflow and outflow boundaries.
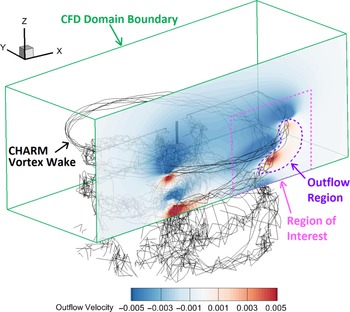
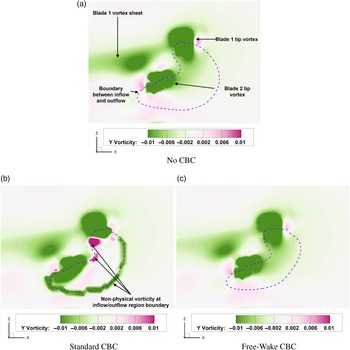
The induced flow conditions near a rotor (see Fig. 10) using various treatments of the boundary characteristics are shown in Fig. 11. The flow field induced by the free-wake solver is apparent when no CBC is applied (Fig. 11a), and applying a standard CBC results in nonphysical vorticity produced at the interface between inflow and outflow regions on the uRANS boundary (Fig. 11b). Applying the dual-solver CBC, however, retains the quality of the induced flow field while also treating outgoing pressure characteristics appropriately to prevent their reflection from the boundary (Fig. 11c).
Location of and outflow velocity contours on the boundary of interest in Fig. 11.

Comparison of boundary-normal vorticity contours on the CFD boundary in an OVERFLOW-CHARM simulation before the application of any CBC and after the application of the original and improved Riemann boundary conditions. See Fig. 10 for context.

As discussed earlier, one of the advantages of the wake solver is the larger time step it can take compared to the uRANS near-body solver. If boundary values remain constant
 $\big( {\vec Q\left( {{t_{wake}} + \Delta {t_{uRANS}}} \right) = \vec Q\left( {{t_{wake}}} \right)} \big)$
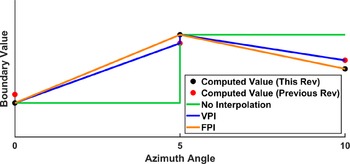
between coupling steps it can result in significant discontinuities in the solution when the boundary surface values are updated. Applying linear interpolation of induced boundary velocities between update steps can be effective, but requires a prediction of the induced velocities as yet to be computed
 $\big( {\vec Q\left( {{t_{wake}} + \Delta {t_{wake}}} \right)} \big)$
. One approach, requiring the assumption of rotor periodicity, is to assume the velocities will be equal to those computed during the last rotor revolution
 $\big( {\vec Q\left( {{t_{wake}} + \Delta {t_{wake}}} \right) = \vec Q\left( {{t_{wake}} + \Delta {t_{wake}} - {T_{rotor}}} \right)} \big)$
. This technique, called Velocity-Predictive Interpolation (VPI), is very effective when applied to flow solutions that are highly periodic [Reference Moushegian, Smith, Whitehouse and Wachspress20]. For hybrid CFD/free-wake solvers, a second approach has recently been devised for applications where the flow field may not be periodic from one revolution to the next, such as when vortex pairing occurs. This method, called Force-Predictive Interpolation (FPI), [Reference Moushegian, Smith, Whitehouse and Wachspress54] updates the free-wake solution one step ahead of the uRANS solution with blade forces computed during the most recent blade passage
 $\left( {\vec F\left( {{t_{wake}} + \Delta {t_{wake}}} \right) = \vec F\left( {{t_{wake}} + \Delta {t_{wake}} - {T_{rotor}}/{n_{blades}}} \right)} \right)$
. The induced velocities from this “future” free-wake solution can then be used for exact interpolation between free-wake update steps. A comparison of the boundary value variation between the three techniques for a notional, aperiodic flow field is depicted in Fig. 12.
Boundary value variation without interpolation, with Velocity-Predictive Interpolation (VPI), and with Force-Predictive Interpolation (FPI) via Moushegian et al. [Reference Moushegian, Smith, Whitehouse and Wachspress54].

4.0 Advanced development of dual-solver hybrid methods
4.1 Turbulence modeling
Turbulence modeling is important when applied to not only a single uRANS simulation, but in dual-solver simulations as well. It is important that the selection of the turbulence model be appropriate to the physics of the rotor simulation if separation or dynamic stall will be encountered. Best practices for these approaches indicate that a delayed detached eddy simulation (DDES) [Reference Spalart, Strelets and Allmaras55] or a large eddy simulation (LES) be applied to the wake. This has led to the development of hybrid uRANS-LES approaches where the viscous boundary layers are modeled with traditional uRANS, while separated flow and wakes are modeled with DDES or LES. These approaches have been observed to be more accurate than uRANS models [Reference Spalart, Strelets and Allmaras55]. DDES is the least expensive of the approaches and predicts the turbulence length scale based on the size of the mesh in the DDES region. DDES adds approximately 1% additional computational cost to the simulation over the cost of resolving the uRANS turbulence model for the same size mesh and time step, but it is somewhat sensitive to the size of the mesh. More advanced LES turbulence closures for hybrid uRANS-LES solve the partial differential equations for the turbulent kinetic energy,
 $k$
and the length scale,
 $\ell $
and require anywhere from 2 to 5% more computational resources than the uRANS turbulence model at the same timestep and mesh. Because the LES or DDES closures resolve the wake, it is not necessary to resolve the mesh or reduce the timestep per LES recommendations that resolve the very small turbulent eddy scales within the viscous boundary layers next to walls. The salient turbulent scales in the separated wake are larger, so that the significant physics of the flow can be captured with moderate mesh refinement applied in uRANS. [Reference Lynch and Smith5, Reference Liggett and Smith56] The introduction of these advanced wake turbulence closures, even on the same meshes and with the same time steps can greatly improve the predicted location of separation over uRANS. [Reference Lynch and Smith5, Reference Liggett and Smith56] Halving the uRANS time steps has been observed to improve rotor loads predictions for conditions at the edge of the flight envelope (high thrust) [Reference Shelton, Braman, Smith and Menon57], although time steps comparable to uRANS results with sufficient convergence via subiterations are practical for most flight conditions.
Recent research is focusing on improved predictions of the turbulence that exits the uRANS domain, enters the wake domain, re-enters the uRANS domain, and so on. This scenario can occur in compound or multi-rotor UAM designs, axial descent, or in modeling of wind farms. If both of the dual solvers are based on the Navier-Stokes equations, the turbulence characteristics must be transformed into the variables utilised in each of the dual solvers – and it must transform repeatedly over time while conserving (turbulent kinetic) energy. For simplified wake solvers, such as those based on the Potential or Euler equations, these variables need to be preserved until the flow element re-enters the uRANS solver. For long-age wakes, the vorticity may need to be modified through empirical factors or equations to mimic the natural dissipation. Several avenues to add this capability to dual-solver hybrid methods are underway, with results available in 2022–2023.
4.1.1 Propeller-wing interaction
UAM and AAM configurations have a plethora of design concepts to merge the vertical take-off and landing issue and high speed cruise that blend propulsion types that include rotors, propellers, and proprotors. [Reference Johnson and Silva58] The AIAA Workshop for Integrated Propeller Prediction (WIPP) was created based on community interest in these AAM and UAM applications. This has offered an opportunity to expand the hybrid dual-solver capabilities through validation of this data set. A propeller is mounted upstream of a wing, and propeller thrust and wing aerodynamic performance are provided at a range of freestream Mach numbers and propeller tip speeds.
The dual-solver simulation setup for the prediction of wing-propeller interactions is highly analogous to that of rotor-fuselage interactions. The only significant difference is the release of wake panels from the trailing edge of the wing, which are not necessary when modeling bluff bodies such as a fuselage. For cases with interactions between rotating and static aerodynamic systems, the communication of unsteady effects through the boundary condition is vitally important. The application of the unsteady free-wake pressure derived from the time-derivative of the potential function to the uRANS boundary significantly improves the accuracy of the computed dual-solver solution. Employing this technique provided a six-fold improvement in the agreement between predicted propeller thrust computed by the dual-solver method and a conventional uRANS simulation when compared to boundary pressure derived using isentropic relations (see Table 1). Predictions of propeller thrust are within 1.2% of experimental data and wing pressure coefficient distribution demonstrate good agreement with both experimental data and conventional CFD methods [Reference Moushegian, Smith, Whitehouse and Wachspress59].
Propeller thrust coefficient as predicted by OVERFLOW, OVERFLOW-CHARM with isentropic boundary pressure, and OVERFLOW-CHARM with unsteady free-wake boundary pressure

4.2 Ground effect and obstacles
Air vehicles that take-off and land in the lee of ship superstructures or buildings for UAM/AAM applications will encounter obstacles in multiple directions, similar to flight in ground effect. The US Navy is developing an experimental dataset to explore different obstacle scenarios for validation of computational methods, which will be available in 2022 [Reference Silva and Barber60].
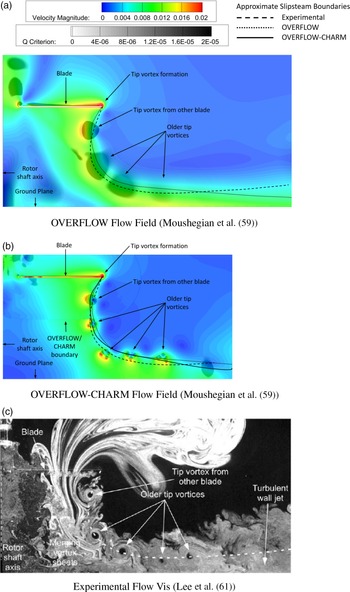
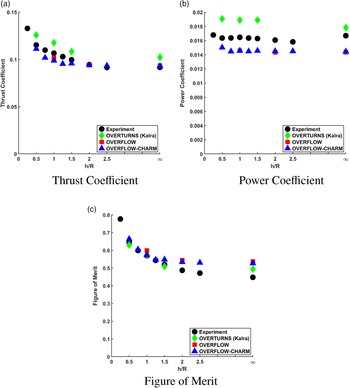
Until these data are available, the impact of obstacles can be validated using extant hover in ground effect data. The axial symmetry of the flight condition provides unique opportunities for computational savings which can further enhance the benefits of using a dual-solver method. When employing a non-contiguous dual-solver approach, each blade is resolved with its own computational grid in the uRANS model of the rotor. In axisymmetric cases of isolated rotors, the computational grids on all but one of the rotor blades can be omitted with no sacrifice in solution accuracy, providing significant additional cost savings. This single-gridded-blade (SGB) approach was applied to a rotor in hover in ground effect study and provided integrated rotor performance metrics within 3% of a conventional uRANS simulation at one-fifth the computational cost (Figs. 13 and 14). Also observed in this study was the ability of the uRANS and uRANS-FW solvers to capture the interaction between the rotor wake and the ground plane. Figure 13 compares the flow fields of a full Navier-Stokes simulation (Fig. 13a), a hybrid Navier-Stokes-free-wake simulation (Fig. 13b), and experimental PIV (Fig. 13c). Good qualitative agreement is observed in the dynamics of the tip vortices and slipstream boundary between the three approaches. The largest deviations occur near the ground plane where the fidelity of physical modeling has the greatest impact on the flow behaviour.
Comparison between computational and experimental flow fields for a micro-scale rotor in hover at h/R = 1.0. Figures are to scale.

Variation of micro-scale rotor hover performance coefficients with ground plane height as predicted by OVERFLOW-CHARM (Moushegian et al. [Reference Moushegian, Smith, Whitehouse and Wachspress59]), OVERFLOW (Moushegian et al. [Reference Moushegian, Smith, Whitehouse and Wachspress59]), OVERTURNS [Reference Kalra61], and experiment [Reference Lee and Zan62].

5.0 Conclusions
Dual-solver hybrid approaches that couple unsteady Reynolds-averaged Navier-Stokes (uRANS) solvers to resolve the near-field in vertical lift configurations, coupled with a vorticity-preserving wake solver, show promise in filling the gap between lower-fidelity computational methods and highly resolved uRANS. Accurate predictions of vehicle aerodynamic and structural loads are possible when the boundary conditions exchange the physics correctly without duplicating terms and unsteady terms in the wake solver are included. Reported cost savings of 50%–90% have been reported by multiple developers. These savings are based both on mesh reduction and faster convergence due to the rapid establishment of mature wakes. Successful applications have been reported using solvers based on vorticity-preserving schemes, such as Potential Wake, Viscous Vortex Particle Methods, and Velocity-Vorticity Transport Methods. For these methods to become part of the vertical lift community’s standard workflow, it is important to develop the hybrid methods where the uRANS and wake solvers are already in use within the organisation and/or have been accepted by the government for design and ultimately certification. There has been successful extension to include multiple rotors and multiple types of propulsion systems to model prospective Urban Air Mobility configurations.
Acknowledgements
The first author would like to acknowledge the support of a series of research and development efforts over the past decade that have contributed to the development of these methods in her group: N68335-09-C-0335 (US Navy), DE-SC0004403 (Department of Energy): U.S. Government Technology Investment Agreement WBS 2011-B-11-03.1-P3 from the National Rotorcraft Technology Center: U.S. Government under Other Transaction number W15QKN-10-9-0003 between Vertical Lift Consortium, Inc. and the Government. She would like to thank her collaborators over the years, including Richard Brown at Sophrodyne; Glen Whitehouse, Alex Boschitsch, Dan Wachspress and Todd Quackenbush of Continuum Dynamics; Marty Moulton, Mahendra Bhagwat, Rohit Jain, and Mark Potsdam of the U.S. Army CCDC AvMC; Susan Polsky and Mark Silva at NAVAIR, the UH-60A Airloads Workshop participants, and the FUN3D and OVERFLOW development teams at NASA.
Funding of the second author on this work has been partially provided by the Department of Defense (DoD) Science, Mathematics, and Research for Transformation (SMART) scholarship program.
Computational resources are allocated through the DoD High Performance Computing Modernization Program (HPCMP) through S/AAAs Meghan Goldsborough and Roger Strawn.
The views and conclusions contained in this document are those of the authors and should not be interpreted as representing the official policies, either expressed or implied, of the US government. The US government is authorised to reproduce and distribute reprints for government purposes notwithstanding any copyright notation thereon.