





1. Introduction
Vortex-induced vibrations (VIV) of flexible bodies with bluff cross-section are encountered in many natural and industrial systems, e.g. plants and trees in wind, or cables and mooring lines exposed to ocean currents. Owing to their impact on engineering structures and their fundamental interest as a paradigm of fluid–structure interaction involving synchronization, or lock-in, between body motion and flow unsteadiness, VIV have been the object of a number of studies, as reviewed for example by Williamson & Govardhan (Reference Williamson and Govardhan2004). VIV have often been investigated through the canonical problem of a rigid circular cylinder mounted on an elastic support. When the rigid cylinder is fixed, the flow becomes unsteady beyond a critical Reynolds number close to  $47$, with the formation of the alternating von Kármán vortices (Mathis, Provansal & Boyer Reference Mathis, Provansal and Boyer1984). The Reynolds number (
 $Re$) is based on the body diameter (
 $D$) and inflow velocity (
 $U$); the above critical value is denoted by
 $Re_c$ in the following. If the rigid cylinder is elastically mounted, previous works have shown that VIV may occur in the subcritical-
 $Re$ range, i.e. for
 $Re<Re_c$, possibly down to
 $Re\approx 20$, depending on the system parameters (Cossu & Morino Reference Cossu and Morino2000; Mittal & Singh Reference Mittal and Singh2005; Kou et al. Reference Kou, Zhang, Liu and Li2017; Dolci & Carmo Reference Dolci and Carmo2019). A typical case of rigid-cylinder VIV in the subcritical-
 $Re$ range (
 $Re=33$) is presented in figure 1. The maximum amplitude of cross-flow vibration, normalized by
 $D$, is plotted in figure 1(a) as a function of the reduced velocity
 $U^{\star }$, defined as the inverse of the oscillator natural frequency non-dimensionalized by
 $D$ and
 $U$. Structural responses emerge over a well-defined range of
 $U^{\star }$. The flow, which is steady in the absence of vibration, becomes unsteady and synchronizes with body motion within this range of
 $U^{\star }$ (figure 1b,c).
Vortex-induced vibrations of a rigid cylinder at  $Re=33$: (a) maximum amplitude of cross-flow displacement as a function of the reduced velocity; (b,c) instantaneous isocontours of spanwise vorticity (
 $\omega _z\in [-0.3,0.3]$), for (b)
 $U^{\star }=5$ and (c)
 $U^{\star }=7$. In (a), the present simulation results are compared to the amplitudes reported by Mittal & Singh (Reference Mittal and Singh2005) and Dolci & Carmo (Reference Dolci and Carmo2019).

The present work aims at extending the analysis of subcritical- $Re$ VIV to flexible cylinders. Flexible-cylinder VIV have been well documented for
 $Re>Re_c$ (Chaplin et al. Reference Chaplin, Bearman, Huera-Huarte and Pattenden2005; Bourguet, Karniadakis & Triantafyllou Reference Bourguet, Karniadakis and Triantafyllou2011; Wu, Ge & Hong Reference Wu, Ge and Hong2012; Huera-Huarte, Bangash & González Reference Huera-Huarte, Bangash and González2014; Gedikli, Chelidze & Dahl Reference Gedikli, Chelidze and Dahl2018; Seyed-Aghazadeh, Edraki & Modarres-Sadeghi Reference Seyed-Aghazadeh, Edraki and Modarres-Sadeghi2019). They are still driven by the lock-in mechanism but the flexibility of the body and its distributed interaction with the flow may lead to an increased complexity of the system behaviour. For example, several structural wavelengths may be excited, sometimes simultaneously (Bourguet, Karniadakis & Triantafyllou Reference Bourguet, Karniadakis and Triantafyllou2013). The vibrations often consist of a mixture of standing- and travelling-wave patterns and so does the wake (Newman & Karniadakis Reference Newman and Karniadakis1997). The phase difference between the streamwise and cross-flow vibrations may vary along the span, leading to diverse trajectory shapes, more or less favourable to body excitation/damping by the flow (Fan et al. Reference Fan, Wang, Triantafyllou and Karniadakis2019). These different aspects remain to be explored in the subcritical-
 $Re$ range. An attempt is made here on the basis of three-dimensional numerical simulations. The question of the critical value of
 $Re$ for the onset of flexible-cylinder VIV is briefly addressed, then a constant value,
 $Re=25$ (i.e. close to half
 $Re_c$), is selected and the investigation is carried out in two steps. First, focus is placed on the evolution of the system behaviour with
 $U^{\star }$ (based on the fundamental natural frequency), from the emergence of VIV to the excitation of the first structural modes; a cylinder of length-to-diameter aspect ratio equal to
 $50$ is considered and
 $U^{\star }$ is progressively varied from
 $1$ to
 $35$ (§ 3). Second, higher-mode vibrations are examined for a cylinder of aspect ratio
 $400$ and two high values of
 $U^{\star }$,
 $80$ and
 $110$ (§ 4).
2. Formulation and numerical method
A sketch of the physical system is presented in figure 2. The cylinder has a circular cross-section, is pinned at both ends and aligned with the  $z$ axis in the absence of deformation (fluid at rest). Its length and diameter are denoted by
 $L$ and
 $D$, respectively. The cylinder is placed in an incompressible uniform cross-current, parallel to the
 $x$ axis. The Reynolds number is based on the inflow velocity (
 $U$) and
 $D$,
 $Re=\rho _f U D/\mu$, where
 $\rho _f$ and
 $\mu$ denote the fluid density and viscosity, respectively. The flow dynamics is predicted by the three-dimensional Navier–Stokes equations. The cylinder can oscillate in the in-line (IL,
 $x$ axis) and cross-flow (CF,
 $y$ axis) directions. All the physical variables are non-dimensionalized by
 $D$,
 $U$ and
 $\rho _f$. The non-dimensional structural mass, tension and damping are defined as
 $m=\rho _c/(\rho _f D^2)$,
 $\tau =T/(\rho _f D^2U^2)$ and
 $\xi =d/(\rho _f DU)$, where
 $\rho _c$ denotes the cylinder dimensional mass per unit length, and
 $T$ and
 $d$ are its dimensional tension and damping. The IL and CF displacements, non-dimensionalized by
 $D$, are denoted by
 $\zeta _x$ and
 $\zeta _y$. The sectional IL and CF force coefficients are defined as
 $C_{\{x,y\}}=2 F_{\{x,y\}} /(\rho _f D U^2)$, where
 $F_{x}$ and
 $F_{y}$ are the dimensional sectional fluid forces aligned with the
 $x$ and
 $y$ axes. The body dynamics is governed by forced vibrating string equations (Newman & Karniadakis Reference Newman and Karniadakis1997; Bourguet et al. Reference Bourguet, Karniadakis and Triantafyllou2011)
 \begin{equation} m\ddot{\zeta}_{\{x,y\}} -\tau {\zeta''_{\{x,y\}}} +\xi{\dot{\zeta}_{\{x,y\}}} = \dfrac{{C_{\{x,y\}}}}{2}, \end{equation}
where  $\dot {\ }$ and
 $'$ denote the time and space (
 $z$) derivatives. The non-dimensional natural frequency associated with the
 $n$th sine Fourier mode (i.e.
 $\sin ({\rm \pi} n z D/L)$) is obtained via the dispersion relation
 $f_{nat}(n)=n\sqrt {\tau /m}/(2L/D)$, in vacuum. The reduced velocity is defined as the inverse of the fundamental natural frequency (
 $n=1$),
 $U^{\star }=1/f_{nat}(1)$. The structural damping ratio is defined as
 $\gamma =\xi (L/D) / (2{\rm \pi} \sqrt {\tau m})$. Different values of
 $Re$,
 $L/D$,
 $m$,
 $\gamma$ and
 $U^{\star }$ are examined.
Sketch of the physical system.

The numerical method is the same as in previous studies concerning comparable systems at higher  $Re$ (Bourguet et al. Reference Bourguet, Karniadakis and Triantafyllou2011, Reference Bourguet, Karniadakis and Triantafyllou2013). It is briefly summarized here and some additional validation results are presented. The coupled flow–structure equations are solved by the parallelized code Nektar, which is based on the spectral/
 $hp$ element method (Karniadakis & Sherwin Reference Karniadakis and Sherwin1999). The computational domain (
 $50D$ downstream and
 $20D$ in front, above and below the cylinder), boundary conditions (no-slip condition on the cylinder surface, flow periodicity on the side boundaries) and discretization (
 $2175$ elements in the (
 $x,y$) plane) are the same as in the above-mentioned studies. A convergence study was carried out in a typical case of subcritical-
 $Re$ VIV (
 $Re=25$,
 $L/D=50$,
 $m=6$,
 $\gamma =0$,
 $U^{\star }=32$) in order to select the non-dimensional time step (
 $0.005$), polynomial order in the (
 $x,y$) plane (
 $5$) and number of Fourier modes in the
 $z$ direction (
 $128$). In particular, the relative differences on force/vibration amplitudes and frequencies were lower than
 $0.05\,\%$ when increasing the polynomial order from
 $5$ to
 $6$. For the larger aspect-ratio configuration (
 $L/D=400$),
 $1024$ Fourier modes are employed. In figure 1(a), a comparison of the CF vibration amplitudes of a rigid cylinder subjected to VIV at
 $Re=33$ (two-degree-of-freedom oscillator), with those reported in prior works, confirms the validity of the present numerical method. Each simulation is initialized with a low-amplitude (
 $10^{-4}D$), random asymmetrical deformation of the cylinder. The analysis is based on time series of more than
 $30$ oscillation cycles, collected after convergence.
3. Emergence of VIV and first-mode responses
The emergence of VIV and their evolution with  $U^{\star }$ are examined for a cylinder of aspect ratio
 $L/D=50$. The maximum amplitude of CF vibration along the span for
 $Re\in [20,25]$,
 $m=6$ and
 $\gamma =0$ is plotted at
 $U^{\star }=8$ and
 $U^{\star }=32$ in figure 3(a). Vibrations arise between
 $Re=20$ and
 $21$ at
 $U^{\star }=8$ and between
 $Re=21$ and
 $22$ at
 $U^{\star }=32$; these values of
 $Re$ are close to those reported for rigid-cylinder VIV (Dolci & Carmo Reference Dolci and Carmo2019). Considering the possible influence of the other structural parameters, no attempt was made to determine the value of
 $Re$ for the onset of vibration for all
 $U^{\star }$. The value
 $Re=25$ is selected as a typical value to explore subcritical-
 $Re$ VIV and it is kept constant in the rest of the paper. To illustrate the existence of vibrations at this
 $Re$ for different non-dimensional structural masses and when structural damping is added, the maximum amplitudes of CF and IL responses are represented at
 $U^{\star }=16$ for
 $m\in \{3,6,12\}$ and
 $\gamma =0$, and at
 $U^{\star }=24$ for
 $m=6$ and
 $\gamma \in \{0,0.01,0.05\}$ (here
 $\tilde {\ }$ denotes the fluctuation about the time-averaged value). In the following,
 $\gamma$ is set to
 $0$ to allow maximum-amplitude vibrations and
 $m$ is set to
 $6$.
Responses of the flexible cylinder ( $L/D=50$) at
 $Re=25$, for
 $m=6$ and
 $\gamma =0$, as functions of
 $U^{\star}$: (a) maximum amplitudes of displacement fluctuations in the CF (left axis, black circles) and IL (right axis, blue triangles) directions; (b,c) r.m.s. values of the (b) CF and (c) IL displacement fluctuations along the span; and (d) CF vibration frequency (IL vibration frequency is equal to twice this frequency). In (a), the maximum amplitudes of CF displacement for
 $Re\in [20,24]$ are also represented at
 $U^{\star }=8$ and
 $U^{\star }=32$ (grey-scale circles); the maximum amplitudes of CF and IL displacement fluctuations are added for
 $Re=25$, at
 $U^{\star }=16$ for
 $m\in \{3,12\}$ and
 $\gamma =0$ (red symbols), and at
 $U^{\star }=24$ for
 $m=6$ and
 $\gamma \in \{0.01,0.05\}$ (green symbols). In (d), the natural frequencies of the first four structural modes in vacuum (
 $f_{nat}$) are indicated by plain grey lines; the corrected natural frequencies, with an added-mass coefficient of
 $1$, are denoted by grey dash-dotted lines; and the vortex shedding frequency identified by Buffoni (Reference Buffoni2003) is indicated by a red dashed line.

An overview of the structural responses occurring at  $Re=25$, for
 $m=6$ and
 $\gamma =0$, is presented in figure 3. The maximum vibration amplitude exhibits similar trends in each direction as a function of
 $U^{\star }$ but contrasting magnitudes since the peak amplitudes are close to
 $0.35$ diameters in the CF direction and lower than
 $0.01$ diameters in the IL direction (figure 3a). Comparable amplitudes were reported in the rigid-cylinder case (Mittal & Singh Reference Mittal and Singh2005). The successive bell shapes in the evolution of the vibration amplitudes are associated with successive changes in their spatial structures. They are visualized in figure 3(b,c) via the root-mean-square (r.m.s.) values of the displacement fluctuations along the span. Well-defined sine modes (first to fourth) can be identified in the CF direction. Less regular patterns develop in the IL direction, but it can be noted that the instantaneous response is always symmetrical about the midspan point, while it may be either symmetrical (odd modes) or antisymmetrical (even modes) in the CF direction. Such a phenomenon was also observed at higher
 $Re$ for symmetrical systems (Gedikli et al. Reference Gedikli, Chelidze and Dahl2018). At higher
 $Re$, both mono-frequency and multi-frequency vibrations were reported for a flexible cylinder placed in a uniform current (e.g. Seyed-Aghazadeh et al. Reference Seyed-Aghazadeh, Edraki and Modarres-Sadeghi2019). Here, a single frequency is excited in each direction, with a ratio of
 $2$ between the IL and CF responses, as usually observed for circular bodies. As shown in figure 3(d), the CF vibration frequency (
 $f_y$) remains lower than the natural frequency of the corresponding structural mode in vacuum (plain grey lines). It is relatively close to the natural frequency corrected by considering the potential added-mass coefficient
 $C_m=1$, i.e.
 $f_{nat}\sqrt {m/(m+C_m{\rm \pi} /4)}$ (grey dash-dotted lines; Williamson & Govardhan Reference Williamson and Govardhan2004). This is not always the case at higher
 $Re$ (Bourguet et al. Reference Bourguet, Karniadakis and Triantafyllou2011). The vibration frequency ranges from
 $0.1$ to
 $0.13$ approximately. This range includes the subcritical Strouhal frequency found by Buffoni (Reference Buffoni2003) by triggering the flow (
 $St=0.118$, red dashed line).
In the absence of vibration, the flow is steady and similar to that depicted in figure 1(b). When the body vibrates, the frequencies of flow unsteadiness and body CF motion coincide along the entire span, as illustrated in figure 4 by the power spectral densities (PSD) of the CF component of flow velocity sampled at  $(x,y) = (10,0)$, in four typical cases (
 $f_y$ is indicated by a vertical dash-dotted line); an example is selected for each mode excited in the CF direction (first to fourth). The lock-in condition is thus established. This justifies the term VIV employed to designate the present vibrations. The absence of response up to
 $U^{\star }=6$ and around
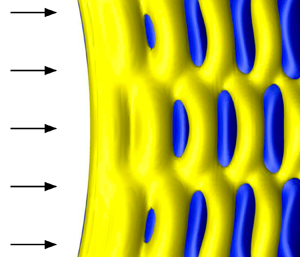
 $U^{\star }=12$ (figure 3a) suggests that the admissible range of wake frequencies (i.e. deviation from the subcritical Strouhal frequency) is not compatible with the possible vibration frequencies. In addition, the spanwise structures of the flow and body response are found to coincide, with the same wavelengths and the minima of flow velocity PSD matching CF vibration nodes (horizontal dashed lines in figure 4). This coincidence shows that the flow and the body are not only temporally locked but also spatially locked. In all cases, the wake exhibits a cellular pattern where each cell ends near the nodes of the CF vibration. Instantaneous visualizations of the flow are presented in figure 4. Within each cell, two counter-rotating vortices are formed per oscillation cycle (2S pattern; Williamson & Govardhan Reference Williamson and Govardhan2004) and the flow is comparable to that depicted in figure 1(c).
Flow patterns downstream of the flexible cylinder subjected to VIV at  $Re=25$ (
 $L/D=50$): PSD of the CF component of flow velocity along the span at
 $(x,y) = (10,0)$ and instantaneous isosurfaces of spanwise vorticity (
 $\omega _z\pm 0.07$), for (a)
 $U^{\star }=8$, (b)
 $U^{\star }=16$, (c)
 $U^{\star }=24$ and (d)
 $U^{\star }=32$. The PSD are normalized by the peak magnitude; the colour code ranges from blue (
 $0$) to yellow (
 $1$). A vertical dash-dotted line indicates the CF vibration frequency, and horizontal dashed lines denote CF vibration nodes. Arrows represent the oncoming flow. Part of the computational domain is visualized (
 $35D$ downstream of the cylinder).

To further analyse the system behaviour, the synchronization of the IL and CF responses and its possible link with flow–structure energy transfer are examined in the following. With a frequency ratio of  $2$ between the IL and CF responses, the cylinder exhibits figure-eight trajectories in the plane perpendicular to the span. The shape and orientation of these trajectories are monitored at each spanwise location, by the phase difference
 $\varPhi _{xy}=\phi _x-2\phi _y$, where
 $\phi _x$ and
 $\phi _y$ are the local phases of the IL and CF responses. A nomenclature is adopted where the cylinder moves downstream when reaching CF oscillation maxima for
 $\varPhi _{xy}\in {]}-180^{\circ },0^{\circ }{[}$ and upstream for
 $\varPhi _{xy}\in {]}0^{\circ },180^{\circ }{[}$; these two types of trajectories are referred to as clockwise and anticlockwise. The cases
 $\varPhi _{xy}=0^{\circ }$ and
 $\varPhi _{xy}={\pm }180^{\circ }$ correspond to crescent-shaped orbits, bent downstream and upstream, respectively. A systematic analysis, for each
 $U^{\star }\in [1,35]$ where vibrations occur, shows that body motion is dominated (
 $73\,\%$) by anticlockwise trajectories and that the most frequent phase difference is
 $\varPhi _{xy}\approx 20^{\circ }$, i.e. anticlockwise orbit close to a crescent bent downstream. Comparable phasing properties were reported at much higher
 $Re$ (Dahl et al. Reference Dahl, Hover, Triantafyllou and Oakley2010). The time-averaged power coefficients,
 $C_{e{\{x,y\}}}=\overline {C_{\{x,y\}}\dot {\zeta }_{\{x,y\}}}$, are used to identify, in each direction, the spanwise regions of excitation (
 $C_{e{\{x,y\}}}>0$) and damping (
 $C_{e{\{x,y\}}}<0$) of the structure by the flow (here
 $\bar {\ }$ denotes time-averaged values). Histograms of
 $\varPhi _{xy}$ and
 $C_{e{\{x,y\}}}$ gathering all the cases are plotted in figure 5. The probability (
 $P$) associated with each histogram quadrant is specified in the plots and the most frequent trajectory is represented in figure 5(a). In spite of the low amplitudes of the IL responses, some connections appear between body trajectory and energy transfer. Anticlockwise orbits are associated with excitation and damping of the structure in both directions, with a deviation towards damping in the CF direction versus excitation in the IL direction. Clockwise orbits are less frequent but involved in more contrasting energy transfer trends. At higher
 $Re$, such orbits were often connected to vibration damping (e.g. Fan et al. Reference Fan, Wang, Triantafyllou and Karniadakis2019). Here, they are associated with IL vibration damping but CF vibration excitation.
Flexible-cylinder trajectory and flow–structure energy transfer at  $Re=25$ (
 $L/D=50$): histogram of the IL/CF response phase difference and time-averaged power coefficient, in the (a) CF and (b) IL directions. Each histogram is normalized by the peak magnitude; the colour code ranges from blue (
 $0$) to yellow (
 $1$). A vertical solid line separates the regions of excitation and damping of the structure by the flow (i.e. positive/negative values of
 $C_{e\{x,y\}}$) while a horizontal dashed line denotes the limit between clockwise and anticlockwise orbits (
 $\varPhi _{xy}=0^{\circ }$); the probability (
 $P$) associated with each histogram quadrant is specified. The most frequent trajectory shape (
 $\varPhi _{xy}\approx 20^{\circ }$) is represented in (a). The results obtained for
 $L/D=400$ (§ 4) are superimposed on the histograms (grey crosses for
 $U^{\star }=80$, red triangles for
 $U^{\star }=110$).

Some statistics of fluid forces are reported in figure 6. The structural vibrations are accompanied by a slight amplification of the span- and time-averaged IL force, compared to the fixed rigid-cylinder case (grey dash-dotted line) and by the emergence of force fluctuations which are quantified by their span-averaged r.m.s. values ( $\langle {\ }\rangle$ denotes span-averaged values). As also observed for the structural responses, force fluctuations present substantially different magnitudes in each direction.
Force statistics at  $Re=25$ (
 $L/D=50$), as functions of
 $U^{\star }$: span-averaged values of the time-averaged IL force coefficient (left axis) and r.m.s. values of the force coefficient fluctuations (right axis). A grey dash-dotted line denotes the value of the IL force coefficient for a fixed rigid cylinder.

The principal features of the flexible-cylinder, subcritical- $Re$ VIV have been described from their emergence to the excitation of the first structural modes. Higher-mode vibrations are examined in the next section.
4. Higher-mode responses
In order to extend the above analysis to higher-mode vibrations, a flexible cylinder of aspect ratio  $L/D=400$ is considered in this section, for two high values of
 $U^{\star }$,
 $80$ and
 $110$. The values of
 $Re$,
 $m$ and
 $\gamma$ are kept equal to
 $25$,
 $6$ and
 $0$.
The cylinder is found to vibrate for both values of  $U^{\star }$. Figure 7(a–c) represents an instantaneous visualization of the wake, as well as selected time series of the CF and IL displacement fluctuations along the span, for
 $U^{\star }=110$. The vibration amplitudes are similar for both
 $U^{\star }$ values and are also comparable to those reported in § 3, i.e. maxima close to
 $0.35$ and
 $0.01$ diameters in the CF and IL directions. Within the range of vibration frequencies identified in figure 3(d) and based on the natural frequencies in vacuum, four and seven structural modes could be excited in the CF and IL directions for
 $U^{\star }=110$. However, it appears that, in both studied cases, a single frequency is excited in each direction, with an IL/CF response frequency ratio of
 $2$, as previously observed.
Flow–structure system behaviour for  $L/D=400$ at
 $Re=25$: (a) instantaneous isosurfaces of spanwise vorticity (
 $\omega _z\pm 0.07$) for
 $U^{\star }=110$ (arrows represent the oncoming flow; part of the computational domain is visualized, i.e.
 $35D$ downstream of the cylinder); (b,c) time series of the (b) CF and (c) IL displacement fluctuations along the span for
 $U^{\star }=110$; (d) spanwise evolution of the r.m.s. value of the CF displacement for
 $U^{\star }=80$ and
 $U^{\star }=110$ (top axis) and time-averaged IL force coefficient for
 $U^{\star }=110$ (bottom axis; grey area); and (e) spanwise evolution of the local phase of the IL response (
 $\phi _x$) for
 $U^{\star }=80$ and
 $U^{\star }=110$ (top axis) and time-averaged power coefficient (
 $C_{ex}$) for
 $U^{\star }=110$ (bottom axis; regions of excitation/damping of the structure by the flow are represented by yellow/grey areas). In (d), the red dashed line indicates a possible trend of the mean force due to the cylinder streamwise deflection.

The CF responses remain essentially composed of standing waves. Their spatial structures are close to the  $10$th and
 $13$th sine modes, as shown in figure 7(d), which represents the spanwise evolutions of the displacement r.m.s. values (top axis). In the IL direction, as illustrated in figure 7(c), the central region of the cylinder (
 $z\in [100,300]$) is characterized by dominant standing-wave patterns while travelling waves develop on each side. The excited wavelengths correspond to the
 $19$th and
 $25$th modes for
 $U^{\star }=80$ and
 $U^{\star }=110$. The instantaneous IL responses remain symmetrical about the midspan point, which is not necessarily the case for the CF responses (antisymmetrical for
 $U^{\star }=80$). Another persistent trend in the IL responses, also visible in figure 3(c), is the presence of amplitude peaks near the body ends. As also reported for lower-mode responses, the vibration frequencies (
 $f_y=0.115$ and
 $f_y=0.109$ for
 $U^{\star }=80$ and
 $U^{\star }=110$) are lower than the corresponding natural frequencies in vacuum (
 $f_{nat}(10)=0.125$ and
 $f_{nat}(13)=0.118$) and close to the corrected natural frequencies with
 $C_m=1$ (
 $0.118$ and
 $0.111$).
For both values of  $U^{\star }$, the flow and the body remain temporally and spatially locked, since the frequencies and spanwise structures of the flow and CF vibration coincide. The wakes exhibit cellular patterns comparable to those visualized in figure 4.
A complementary vision of the mixed standing/travelling waves identified in the IL vibrations is proposed in figure 7(e), which represents the response local phases ( $\phi _x$) for both
 $U^{\star }$ values. These plots confirm the transition from standing waves in the central region, with regular jumps near response nodes, to travelling waves moving towards cylinder ends on each side. This orientation of the travelling waves relates to the spanwise distribution of flow–structure energy transfer, as previously observed at higher
 $Re$ (Bourguet et al. Reference Bourguet, Karniadakis and Triantafyllou2013). The energy transfer is quantified via
 $C_{ex}$ in figure 7(e) (for
 $U^{\star }=110$). The structural waves propagate from the main region of excitation (central part) towards the regions where damping dominates (side parts). The global distribution of
 $C_{ex}$ along the span appears to be determined by the profile of the inflow velocity component locally normal to the body (
 $U_{\perp }$). This profile is sheared due to the streamwise deflection of the cylinder (visible in figure 7a), which is caused by the mean IL force. The main excitation region is found to be located in the area of maximum
 $U_{\perp }$, i.e. the central part.
The present VIV cases exhibit a wider variety of trajectory shapes than those examined in § 3. IL/CF response synchronization remains, however, dominated ( $60\,\%$) by anticlockwise figure-eight orbits. The values of
 $\varPhi _{xy}$ and
 $C_{e{\{x,y\}}}$ obtained for
 $U^{\star }=80$ and
 $U^{\star }=110$ are superimposed on the histograms in figure 5 (grey crosses/red triangles). The general trends previously identified are found to persist and are even more clearly defined for the higher-mode responses, in particular the excitation of CF vibrations through clockwise orbits while this orientation is associated with IL vibration damping.
Force statistics are comparable to those reported for lower-mode responses, e.g.  $\langle \bar {C}_x \rangle =1.90$ for
 $U^{\star }=110$. The local peaks of
 $\bar {C}_x$ along the span coincide with CF response antinodes as shown in figure 7(d) (bottom axis); such coincidence is also observed for lower-mode responses. The decreasing trend of
 $\bar {C}_x$ towards the body ends can be connected to a scaling of the force by the inflow velocity component locally normal to the deflected body, i.e.
 $\propto U^2_{\perp }$ (red dashed line in figure 7d).
5. Conclusions
The subcritical- $Re$ VIV of a flexible cylinder, pinned at both ends and immersed in a uniform current, have been investigated on the basis of numerical simulations. Vibrations were observed down to
 $Re\approx 20$, as previously reported for rigid cylinders. A constant value,
 $Re=25$, was selected and the analysis was carried out in two steps: a monitoring of the system behaviour as a function of
 $U^{\star }$, from the emergence of VIV to the excitation of the first structural modes; and then a focus on higher-mode responses. The typical features of the subcritical-
 $Re$ VIV uncovered in this work can be summarized as follows.
A single vibration frequency is excited in each direction, with a ratio of  $2$ between the IL and CF responses. The flow, which is steady in the absence of vibration, becomes unsteady and its frequency coincides with the CF vibration frequency. The peak amplitudes of the CF and IL vibrations are of the order of
 $0.35$ and
 $0.01$ body diameters, respectively. The CF vibrations are essentially composed of standing waves and their spatial structures are close to sinusoidal modes. The spanwise structure of the unsteady flow matches that of the CF vibration, i.e. the flow and the flexible body are not only temporally locked but also spatially locked. This synchronization is accompanied by the formation of cellular wake patterns. The IL responses exhibit less regular evolutions, in particular with the development of travelling waves propagating from the central part of the cylinder towards its ends; this orientation can be related to the streamwise deflection of the body through the spanwise distribution of the regions of excitation/damping. The instantaneous IL responses are, however, found to remain symmetrical about the midspan point, which is not necessarily the case in the CF direction. The cylinder describes preferentially anticlockwise figure-eight orbits, especially for the low-mode responses where these orbits are generally close to a crescent-shaped trajectory, bent downstream. In spite of the low amplitudes of the IL responses, the orbit orientation appears to be connected to flow–structure energy transfer and different trends arise in the CF and IL directions.
Acknowledgements
This work was performed using HPC resources from CALMIP (grant 2020-P1248).
Declaration of interests
The author reports no conflict of interest.



