1 Introduction and related work
The measurement of an evolving scalar tracer is sometimes considered easier than that of the underlying velocity (Schlichtholz Reference Schlichtholz1991), both in nature and in a laboratory setting. Determining the flow velocity more accurately from scalar field observations is, therefore, an exciting perspective in a plethora of applications including oceanography, meteorology, medicine and chemical engineering (Wunsch Reference Wunsch1987).
The transport equation for a passive scalar with instantaneous concentration
 $c(\boldsymbol{x},t)$
and constant diffusivity
 $\unicode[STIX]{x1D707}\geqslant 0$
under an incompressible, planar velocity field
 $\boldsymbol{u}(\boldsymbol{x},t)$
is given by
 $$\begin{eqnarray}{\displaystyle \frac{\unicode[STIX]{x2202}c}{\unicode[STIX]{x2202}t}}+\boldsymbol{u}\boldsymbol{\cdot }\unicode[STIX]{x1D735}c=\unicode[STIX]{x1D707}\unicode[STIX]{x1D6FB}^{2}c,\end{eqnarray}$$
with the spatial coordinates
 $\boldsymbol{x}=(x,y)$
varying over some domain
 $U\subset \mathbb{R}^{2}$
and
 $t$
denoting the time. Note that the velocity field
 $\boldsymbol{u}$
only influences the advection of
 $c$
via its inner product
 $\boldsymbol{u}\boldsymbol{\cdot }\unicode[STIX]{x1D735}c$
with the instantaneous concentration gradient. This leads to the classic observation that the iso-scalar component of the velocity is inconsequential for the scalar field evolution (Kelly Reference Kelly1989; Dahm, Su & Southerland Reference Dahm, Su and Southerland1992). In other words, the iso-scalar velocity component falls in the null space of the velocity-reconstruction problem, necessitating further conditions for a unique solution to this inverse problem (Kelly Reference Kelly1989).
Seminal work by Fiadeiro & Veronis (Reference Fiadeiro and Veronis1984) and Wunsch (Reference Wunsch1985) considered velocity reconstruction from discretized observations of a steady scalar distribution in a two-dimensional, steady channel flow with uniform velocity. After spatial discretization, these authors obtained an under-determined algebraic system of equations for the values of the streamfunction at the grid points. The minimum-norm solution obtained to this problem by Fiadeiro & Veronis (Reference Fiadeiro and Veronis1984) and Wunsch (Reference Wunsch1985) was found to be qualitatively inaccurate by Veronis (Reference Veronis1986) even for the simple uniform flow considered. Providing additional boundary conditions (Fiadeiro & Veronis Reference Fiadeiro and Veronis1984) or information on the flow anisotropy (Wunsch Reference Wunsch1985) leads to improved solutions. Alternatively, if the flow is dispensed with two scalars of different diffusivity, the system becomes over-determined because the same streamfunction must satisfy two linearly independent scalar equations. This reformulation, however, allows for a physically realistic solution that minimizes the least-squares of the solution error, as obtained by Fiadeiro & Veronis (Reference Fiadeiro and Veronis1984). As expected, the reconstructed velocity departs from the true velocity significantly in regions where the two scalar fields are similarly distributed.
An alternative approach to inverting the scalar transport equation (1.1) has led to the emergence of scalar imaging velocimetry (SIV) (see Wallace & Vukoslavevi (Reference Wallace and Vukoslavčević2010) for a review). When the diffusion of the scalar is slower than that of the carrier fluid (i.e. the ratio of fluid viscosity and scalar diffusivities is larger than one), the fluid velocity at nearby points varies slower than the scalar intensity (Dahm et al.
Reference Dahm, Su and Southerland1992). As a consequence, the velocity component normal to the iso-scalar varies faster than the overall velocity. For an initial estimate, the overall velocity can therefore be assumed locally spatially constant and recovered from a projection onto neighbouring normals to iso-scalar curves. As the calculation of iso-scalar-normal velocity requires division by
 $|\unicode[STIX]{x1D735}c|$
, the velocity reconstructed in this fashion is limited to regions where
 $|\unicode[STIX]{x1D735}c|$
is well separated from zero (Dahm et al.
Reference Dahm, Su and Southerland1992).
In an another approach relaxing the requirement of slow scalar diffusion, Su & Dahm (Reference Su and Dahm1996) formulated the velocity reconstruction as a minimization problem for an integral composed of the transport equation, the divergence and a regularizer term depending on the velocity gradient norm. Kelly (Reference Kelly1989) also implemented a similar formulation for ocean flows in which the functional to be minimized involves the transport equation, the horizontal divergence, the relative vorticity and the kinetic energy. These minimization techniques can return an accurate (albeit never exact) velocity field if the weight factors for each component of the functional are tuned appropriately.
Here, we point out that for two-dimensional incompressible flows, one can use the method of characteristics to analytically reformulate the partial differential equation (PDE) (1.1) into a system of ordinary differential equations (ODEs) for the spatial evolution of the velocity components along an instantaneous level curve of
 $c(\boldsymbol{x},t)$
. Integration of these ODEs enables the reconstruction of the velocity field over the domain of scalar observations. This procedure assumes that the velocity is available along a curve
 $\unicode[STIX]{x1D6E4}(t)$
transverse to the level curves of
 $c(\boldsymbol{x},t)$
. If the value of the diffusivity
 $\unicode[STIX]{x1D707}$
is known, knowledge of one velocity component along
 $\unicode[STIX]{x1D6E4}(t)$
turns out to be sufficient. We give the derivation of these results in § 2 and test the approach on two numerical examples in § 3.
Our technique can be particularly advantageous in oceanographic applications, in which often only localized velocity field measurements are available. In such situations, independent observations of larger-scale physical, chemical or biological tracer fields offer an opportunity to extend the local velocity data to larger domains, as we illustrate in § 4. We also discuss oceanography-inspired extensions of our main results to diffusivities with spatial dependence and to shallow-water equations in § 2.
2 Formulation
Taking the spatial gradient of the scalar transport equation (1.1) leads to the equations
 $$\begin{eqnarray}\displaystyle & \displaystyle {\displaystyle \frac{\unicode[STIX]{x2202}^{2}c}{\unicode[STIX]{x2202}t\unicode[STIX]{x2202}x}}+u{\displaystyle \frac{\unicode[STIX]{x2202}^{2}c}{\unicode[STIX]{x2202}x^{2}}}+{\displaystyle \frac{\unicode[STIX]{x2202}u}{\unicode[STIX]{x2202}x}}{\displaystyle \frac{\unicode[STIX]{x2202}c}{\unicode[STIX]{x2202}x}}+v{\displaystyle \frac{\unicode[STIX]{x2202}^{2}c}{\unicode[STIX]{x2202}x\unicode[STIX]{x2202}y}}+{\displaystyle \frac{\unicode[STIX]{x2202}v}{\unicode[STIX]{x2202}x}}{\displaystyle \frac{\unicode[STIX]{x2202}c}{\unicode[STIX]{x2202}y}}=\unicode[STIX]{x1D707}{\displaystyle \frac{\unicode[STIX]{x2202}\unicode[STIX]{x1D6FB}^{2}c}{\unicode[STIX]{x2202}x}}, & \displaystyle\end{eqnarray}$$
 $$\begin{eqnarray}\displaystyle & \displaystyle {\displaystyle \frac{\unicode[STIX]{x2202}^{2}c}{\unicode[STIX]{x2202}t\unicode[STIX]{x2202}y}}+u{\displaystyle \frac{\unicode[STIX]{x2202}^{2}c}{\unicode[STIX]{x2202}x\unicode[STIX]{x2202}y}}+{\displaystyle \frac{\unicode[STIX]{x2202}u}{\unicode[STIX]{x2202}y}}{\displaystyle \frac{\unicode[STIX]{x2202}c}{\unicode[STIX]{x2202}x}}+v{\displaystyle \frac{\unicode[STIX]{x2202}^{2}c}{\unicode[STIX]{x2202}y^{2}}}+{\displaystyle \frac{\unicode[STIX]{x2202}v}{\unicode[STIX]{x2202}y}}{\displaystyle \frac{\unicode[STIX]{x2202}c}{\unicode[STIX]{x2202}y}}=\unicode[STIX]{x1D707}{\displaystyle \frac{\unicode[STIX]{x2202}\unicode[STIX]{x1D6FB}^{2}c}{\unicode[STIX]{x2202}y}}. & \displaystyle\end{eqnarray}$$
 $$\begin{eqnarray}{\displaystyle \frac{\unicode[STIX]{x2202}u}{\unicode[STIX]{x2202}x}}+{\displaystyle \frac{\unicode[STIX]{x2202}v}{\unicode[STIX]{x2202}y}}=0\end{eqnarray}$$
enables us to rewrite this system as
 $$\begin{eqnarray}\displaystyle & \displaystyle {\displaystyle \frac{\unicode[STIX]{x2202}v}{\unicode[STIX]{x2202}x}}{\displaystyle \frac{\unicode[STIX]{x2202}c}{\unicode[STIX]{x2202}y}}-{\displaystyle \frac{\unicode[STIX]{x2202}v}{\unicode[STIX]{x2202}y}}{\displaystyle \frac{\unicode[STIX]{x2202}c}{\unicode[STIX]{x2202}x}}=-u{\displaystyle \frac{\unicode[STIX]{x2202}^{2}c}{\unicode[STIX]{x2202}x^{2}}}-v{\displaystyle \frac{\unicode[STIX]{x2202}^{2}c}{\unicode[STIX]{x2202}x\unicode[STIX]{x2202}y}}-{\displaystyle \frac{\unicode[STIX]{x2202}^{2}c}{\unicode[STIX]{x2202}t\unicode[STIX]{x2202}x}}+\unicode[STIX]{x1D707}{\displaystyle \frac{\unicode[STIX]{x2202}\unicode[STIX]{x1D6FB}^{2}c}{\unicode[STIX]{x2202}x}}, & \displaystyle\end{eqnarray}$$
 $$\begin{eqnarray}\displaystyle & \displaystyle {\displaystyle \frac{\unicode[STIX]{x2202}u}{\unicode[STIX]{x2202}x}}{\displaystyle \frac{\unicode[STIX]{x2202}c}{\unicode[STIX]{x2202}y}}-{\displaystyle \frac{\unicode[STIX]{x2202}u}{\unicode[STIX]{x2202}y}}{\displaystyle \frac{\unicode[STIX]{x2202}c}{\unicode[STIX]{x2202}x}}=u{\displaystyle \frac{\unicode[STIX]{x2202}^{2}c}{\unicode[STIX]{x2202}x\unicode[STIX]{x2202}y}}+v{\displaystyle \frac{\unicode[STIX]{x2202}^{2}c}{\unicode[STIX]{x2202}y^{2}}}+{\displaystyle \frac{\unicode[STIX]{x2202}^{2}c}{\unicode[STIX]{x2202}t\unicode[STIX]{x2202}y}}-\unicode[STIX]{x1D707}{\displaystyle \frac{\unicode[STIX]{x2202}\unicode[STIX]{x1D6FB}^{2}c}{\unicode[STIX]{x2202}y}}. & \displaystyle\end{eqnarray}$$
 $\boldsymbol{x}(s;t)=(x(s;t),y(s;t))$
, which satisfy the system of ODEs
 $$\begin{eqnarray}{\displaystyle \frac{\text{d}x(s;t)}{\text{d}s}}={\displaystyle \frac{\unicode[STIX]{x2202}c(\boldsymbol{x}(s;t),t)}{\unicode[STIX]{x2202}y}},\quad {\displaystyle \frac{\text{d}y(s;t)}{\text{d}s}}=-{\displaystyle \frac{\unicode[STIX]{x2202}c(\boldsymbol{x}(s;t),t)}{\unicode[STIX]{x2202}x}},\end{eqnarray}$$
with the instantaneous time
 $t$
playing the role of a parameter. These characteristics are pointwise normal to the gradient
 $\unicode[STIX]{x1D735}c$
and hence coincide with instantaneous level curves of
 $c(\boldsymbol{x},t)$
at any time
 $t$
. Along the characteristics (2.4), the PDEs in (2.3) can be rewritten as a linear, two-dimensional, non-autonomous system of ODEs for the velocity
 $\tilde{\boldsymbol{u}}(s;t):=\boldsymbol{u}(\boldsymbol{x}(s;t),t)$
. This ODE is of the form
 $$\begin{eqnarray}{\displaystyle \frac{\text{d}\tilde{\boldsymbol{u}}(s;t)}{\text{d}s}}=\unicode[STIX]{x1D63C}(s;t)\tilde{\boldsymbol{u}}(s;t)+\boldsymbol{b}(s;t),\quad \tilde{\boldsymbol{u}}(s;t)\in \mathbb{R}^{2},s\in \mathbb{R},\end{eqnarray}$$
with the form of the matrix
 $\unicode[STIX]{x1D63C}(s;t)\in \mathbb{R}^{2\times 2}$
and the vector
 $\boldsymbol{b}(s;t)\in \mathbb{R}^{2}$
depending upon whether the constant scalar diffusivity,
 $\unicode[STIX]{x1D707}$
, is known or unknown, as we discuss below separately. In either case, once the normalized fundamental matrix solution
 $\unicode[STIX]{x1D731}(s;t)$
of the homogeneous part
 $\text{d}\tilde{\boldsymbol{u}}/\text{d}s=\unicode[STIX]{x1D63C}(s;t)\tilde{\boldsymbol{u}}$
, satisfying
 $\unicode[STIX]{x1D731}(0;t)=\boldsymbol{I}$
, has been numerically determined, we can integrate (2.5) directly to obtain the velocity
 $$\begin{eqnarray}\tilde{\boldsymbol{u}}(s;t)=\unicode[STIX]{x1D731}(s;t)\tilde{\boldsymbol{u}}(0;t)+\int _{0}^{s}\unicode[STIX]{x1D731}(s-\unicode[STIX]{x1D70E};t)\boldsymbol{b}(\unicode[STIX]{x1D70E};t)\,\text{d}\unicode[STIX]{x1D70E}\end{eqnarray}$$
at any location
 $\boldsymbol{x}(s;t)$
along the level curve of
 $c(\boldsymbol{x},t)$
containing the point
 $\boldsymbol{x}(0;t)$
.
2.1 Case of known scalar diffusivity
In the case where the value of
 $\unicode[STIX]{x1D707}$
is a priori known, equations (2.3) can be recast in the form (2.5) with the help of
 $$\begin{eqnarray}\unicode[STIX]{x1D63C}(s;t)=\left[\begin{array}{@{}cc@{}}{\displaystyle \frac{\unicode[STIX]{x2202}^{2}c}{\unicode[STIX]{x2202}x\unicode[STIX]{x2202}y}} & {\displaystyle \frac{\unicode[STIX]{x2202}^{2}c}{\unicode[STIX]{x2202}y^{2}}}\\ -{\displaystyle \frac{\unicode[STIX]{x2202}^{2}c}{\unicode[STIX]{x2202}x^{2}}} & -{\displaystyle \frac{\unicode[STIX]{x2202}^{2}c}{\unicode[STIX]{x2202}x\unicode[STIX]{x2202}y}}\end{array}\right]_{\boldsymbol{x}=\boldsymbol{x}(s;t)},\quad \boldsymbol{b}(s;t)=\left[\begin{array}{@{}c@{}}{\displaystyle \frac{\unicode[STIX]{x2202}^{2}c}{\unicode[STIX]{x2202}t\unicode[STIX]{x2202}y}}-\unicode[STIX]{x1D707}{\displaystyle \frac{\unicode[STIX]{x2202}\unicode[STIX]{x1D6FB}^{2}c}{\unicode[STIX]{x2202}y}}\\ -{\displaystyle \frac{\unicode[STIX]{x2202}^{2}c}{\unicode[STIX]{x2202}t\unicode[STIX]{x2202}x}}+\unicode[STIX]{x1D707}{\displaystyle \frac{\unicode[STIX]{x2202}\unicode[STIX]{x1D6FB}^{2}c}{\unicode[STIX]{x2202}x}}\end{array}\right]_{\boldsymbol{x}=\boldsymbol{x}(s;t)}.\end{eqnarray}$$
2.2 Case of unknown scalar diffusivity
If the value of
 $\unicode[STIX]{x1D707}$
is a priori unknown, we can still express
 $\unicode[STIX]{x1D707}$
from the original transport equation (1.1) as
 $$\begin{eqnarray}\unicode[STIX]{x1D707}={\displaystyle \frac{1}{\unicode[STIX]{x1D6FB}^{2}c}}\left({\displaystyle \frac{\unicode[STIX]{x2202}c}{\unicode[STIX]{x2202}t}}+u{\displaystyle \frac{\unicode[STIX]{x2202}c}{\unicode[STIX]{x2202}x}}+v{\displaystyle \frac{\unicode[STIX]{x2202}c}{\unicode[STIX]{x2202}y}}\right).\end{eqnarray}$$
Substitution of this expression into (2.3) enables us to rewrite (2.3) in the form (2.5) with
 $$\begin{eqnarray}\displaystyle \left.\begin{array}{@{}rcl@{}}\unicode[STIX]{x1D63C}(s;t)\,\, & =\,\, & \left[\begin{array}{@{}cc@{}}{\displaystyle \frac{\unicode[STIX]{x2202}^{2}c}{\unicode[STIX]{x2202}x\unicode[STIX]{x2202}y}}-{\displaystyle \frac{1}{\unicode[STIX]{x1D6FB}^{2}c}}{\displaystyle \frac{\unicode[STIX]{x2202}c}{\unicode[STIX]{x2202}x}}{\displaystyle \frac{\unicode[STIX]{x2202}\unicode[STIX]{x1D6FB}^{2}c}{\unicode[STIX]{x2202}y}} & {\displaystyle \frac{\unicode[STIX]{x2202}^{2}c}{\unicode[STIX]{x2202}y^{2}}}-{\displaystyle \frac{1}{\unicode[STIX]{x1D6FB}^{2}c}}{\displaystyle \frac{\unicode[STIX]{x2202}c}{\unicode[STIX]{x2202}y}}{\displaystyle \frac{\unicode[STIX]{x2202}\unicode[STIX]{x1D6FB}^{2}c}{\unicode[STIX]{x2202}y}}\\ -{\displaystyle \frac{\unicode[STIX]{x2202}^{2}c}{\unicode[STIX]{x2202}x^{2}}}+{\displaystyle \frac{1}{\unicode[STIX]{x1D6FB}^{2}c}}{\displaystyle \frac{\unicode[STIX]{x2202}c}{\unicode[STIX]{x2202}x}}{\displaystyle \frac{\unicode[STIX]{x2202}\unicode[STIX]{x1D6FB}^{2}c}{\unicode[STIX]{x2202}x}} & -{\displaystyle \frac{\unicode[STIX]{x2202}^{2}c}{\unicode[STIX]{x2202}x\unicode[STIX]{x2202}y}}+{\displaystyle \frac{1}{\unicode[STIX]{x1D6FB}^{2}c}}{\displaystyle \frac{\unicode[STIX]{x2202}c}{\unicode[STIX]{x2202}y}}{\displaystyle \frac{\unicode[STIX]{x2202}\unicode[STIX]{x1D6FB}^{2}c}{\unicode[STIX]{x2202}x}}\end{array}\right]_{\boldsymbol{x}=\boldsymbol{x}(s;t)},\\ \boldsymbol{b}(s;t)\,\, & =\,\, & \left[\begin{array}{@{}c@{}}{\displaystyle \frac{\unicode[STIX]{x2202}^{2}c}{\unicode[STIX]{x2202}t\unicode[STIX]{x2202}y}}-{\displaystyle \frac{1}{\unicode[STIX]{x1D6FB}^{2}c}}{\displaystyle \frac{\unicode[STIX]{x2202}c}{\unicode[STIX]{x2202}t}}{\displaystyle \frac{\unicode[STIX]{x2202}\unicode[STIX]{x1D6FB}^{2}c}{\unicode[STIX]{x2202}y}}\\ -{\displaystyle \frac{\unicode[STIX]{x2202}^{2}c}{\unicode[STIX]{x2202}t\unicode[STIX]{x2202}x}}+{\displaystyle \frac{1}{\unicode[STIX]{x1D6FB}^{2}c}}{\displaystyle \frac{\unicode[STIX]{x2202}c}{\unicode[STIX]{x2202}t}}{\displaystyle \frac{\unicode[STIX]{x2202}\unicode[STIX]{x1D6FB}^{2}c}{\unicode[STIX]{x2202}x}}\end{array}\right]_{\boldsymbol{x}=\boldsymbol{x}(s;t)}.\end{array}\right\} & & \displaystyle\end{eqnarray}$$
The formulae in (2.9), however, are only well-defined at points where
 $\unicode[STIX]{x1D6FB}^{2}c\neq 0$
.
2.3 Spatially dependent diffusivity
Most non-eddy-resolving ocean circulation models are diffusion-based, i.e. assume that the small-scale, un- and under-resolved eddy motions lead to a diffusive tracer transfer – a process that can be fully characterized by just one parameter, the lateral eddy diffusivity
 $\unicode[STIX]{x1D707}$
. A number of diffusivity estimates are available based on data from surface drifters and tracers (Okubo Reference Okubo1971; LaCasce & Bower Reference LaCasce and Bower2000; Lumpkin, Treguier & Speer Reference Lumpkin, Treguier and Speer2002; McClean et al.
Reference McClean, Poulain, Pelton and Maltrud2002; Zhurbas & Oh Reference Zhurbas and Oh2004; LaCasce Reference LaCasce2008; Rypina et al.
Reference Rypina, Kamenkovich, Berloff and Pratt2012), satellite-observed velocity fields (Marshall et al.
Reference Marshall, Shuckburgh, Jones and Hill2006; Rypina et al.
Reference Rypina, Kamenkovich, Berloff and Pratt2012; Abernathey & Marshall Reference Abernathey and Marshall2013; Klocker & Abernathey Reference Klocker and Abernathey2014) and Argo float observations (Cole et al.
Reference Cole, Wortham, Kunze and Owens2015). All these observations suggest that the ocean eddy diffusivity is strongly spatially varying with up to two orders of magnitude difference between regions with quiescent versus energetic oceanic eddy regimes. Eddy-resolving simulations also demonstrate highly non-uniform spatial distribution of the eddy-induced transport (Gille & Davis Reference Gille and Davis1999; Nakamura & Chao Reference Nakamura and Chao2000; Roberts & Marshall Reference Roberts and Marshall2000). Thus, any method that involves a diffusivity assumption in a global setting, including the velocity reconstruction method described here, would need to take into account spatial variation in diffusivity.
In this case, the appropriate advection–diffusion equation takes the form
 $$\begin{eqnarray}{\displaystyle \frac{\unicode[STIX]{x2202}c}{\unicode[STIX]{x2202}t}}+\boldsymbol{u}\boldsymbol{\cdot }\unicode[STIX]{x1D735}c=\unicode[STIX]{x1D735}(\unicode[STIX]{x1D707}\unicode[STIX]{x1D735}c).\end{eqnarray}$$
Taking the gradient of this equation and following the same steps as in § 2, one obtains that the velocity
 $\tilde{\boldsymbol{u}}$
satisfies equation (2.5) along the iso-curves of tracer concentration
 $c$
, with
 $\unicode[STIX]{x1D63C}$
from (2.7) and
 $$\begin{eqnarray}\boldsymbol{b}(s;t)=\left[\begin{array}{@{}c@{}}{\displaystyle \frac{\unicode[STIX]{x2202}^{2}c}{\unicode[STIX]{x2202}t\unicode[STIX]{x2202}y}}-{\displaystyle \frac{\unicode[STIX]{x2202}\unicode[STIX]{x1D735}(\unicode[STIX]{x1D707}\unicode[STIX]{x1D735}c)}{\unicode[STIX]{x2202}y}}\\ -{\displaystyle \frac{\unicode[STIX]{x2202}^{2}c}{\unicode[STIX]{x2202}t\unicode[STIX]{x2202}x}}+{\displaystyle \frac{\unicode[STIX]{x2202}\unicode[STIX]{x1D735}(\unicode[STIX]{x1D707}\unicode[STIX]{x1D735}c)}{\unicode[STIX]{x2202}x}}\end{array}\right]_{\boldsymbol{x}=\boldsymbol{x}(s;t)}.\end{eqnarray}$$
2.4 Shallow-water approximation
Due to negligible vertical velocities, equation (2.2) is a reasonable approximation for oceanic surface flows on spatial scales larger than the mesoscale (Salmon Reference Salmon1998; Bennett Reference Bennett2005; Pedlosky Reference Pedlosky2013). When vertical velocities become non-negligible, one may still find another variable other than the velocity that satisfies (2.2) and re-derive the inversion for that variable. An example is the inviscid shallow-water model with a rigid lid (Batchelor Reference Batchelor1967; Pedlosky Reference Pedlosky2013), as we shall discuss next. This shallow-water approximation is often employed in physical oceanography to describe ocean flows in shallow tidally driven bays, such as, for example, the Katama Bay located on the island of Martha’s Vineyard, MA (Luettich Jr & Westerink Reference Luettich and Westerink1991; Orescanin, Elgar & Raubenheimer Reference Orescanin, Elgar and Raubenheimer2016; Slivinski et al. Reference Slivinski, Pratt, Rypina, Orescanin, Raubenheimer, MacMahan and Elgar2017).
Consider a shallow sheet of inviscid unstratified fluid overlaying spatially dependent bathymetry. Fluid parcels are allowed to have three non-zero components of velocity,
 $\{u,v,w\}\neq 0$
, but if the horizontal velocity
 $\boldsymbol{u}$
is initially independent of
 $z$
then it remains so for all times, i.e. we may write
 $$\begin{eqnarray}\boldsymbol{u}=\boldsymbol{u}(x,y,t).\end{eqnarray}$$
If the initial tracer distribution is independent of
 $z$
, i.e.
 $c_{0}=c_{0}(x,y)$
, then we will also have
 $$\begin{eqnarray}c=c(x,y,t)\end{eqnarray}$$
for all times. We then invoke a rigid-lid approximation, assuming that the free-surface elevation
 $\unicode[STIX]{x1D702}$
– the deviation of the free surface from its mean value – is much smaller than the water depth
 $h(x,y)$
, i.e.
 $\unicode[STIX]{x1D702}\ll h\ll L$
, where
 $L$
is the characteristic horizontal length scale of motion. Then the water depth is time-independent and can be considered known because the bathymetry of a shallow bay can be mapped out and the sea surface height is assumed to be constant due to the rigid-lid approximation.
In this case, mass conservation requires the transport velocity,
 $h\boldsymbol{u}$
, to be divergence free:
 $$\begin{eqnarray}\unicode[STIX]{x2202}(hu)/\unicode[STIX]{x2202}x+\unicode[STIX]{x2202}(hv)/\unicode[STIX]{x2202}y=0.\end{eqnarray}$$
To proceed, we multiply the advection–diffusion equation (2.10) by
 $h$
to obtain
 $$\begin{eqnarray}h{\displaystyle \frac{\unicode[STIX]{x2202}c}{\unicode[STIX]{x2202}t}}+h\boldsymbol{u}\boldsymbol{\cdot }\unicode[STIX]{x1D735}c=h\unicode[STIX]{x1D735}(\unicode[STIX]{x1D707}\unicode[STIX]{x1D735}c).\end{eqnarray}$$
We take the gradient of this equation, then follow the steps of § 2 to obtain an analogue of (2.5) for the transport velocity, given by
 $$\begin{eqnarray}\text{d}(h\tilde{\boldsymbol{u}})/\text{d}s=\unicode[STIX]{x1D63C}(h\tilde{\boldsymbol{u}})+\boldsymbol{b},\end{eqnarray}$$
with
 $\unicode[STIX]{x1D63C}$
from (2.7) and with
 $$\begin{eqnarray}\boldsymbol{b}(s;t)=\left[\begin{array}{@{}c@{}}{\displaystyle \frac{\unicode[STIX]{x2202}}{\unicode[STIX]{x2202}y}}\left(h{\displaystyle \frac{\unicode[STIX]{x2202}c}{\unicode[STIX]{x2202}y}}\right)-{\displaystyle \frac{\unicode[STIX]{x2202}}{\unicode[STIX]{x2202}y}}(h\unicode[STIX]{x1D735}(\unicode[STIX]{x1D707}\unicode[STIX]{x1D735}c))\\ -{\displaystyle \frac{\unicode[STIX]{x2202}}{\unicode[STIX]{x2202}x}}\left(h{\displaystyle \frac{\unicode[STIX]{x2202}c}{\unicode[STIX]{x2202}y}}\right)+{\displaystyle \frac{\unicode[STIX]{x2202}}{\unicode[STIX]{x2202}x}}(h\unicode[STIX]{x1D735}(\unicode[STIX]{x1D707}\unicode[STIX]{x1D735}c))\end{array}\right]_{\boldsymbol{x}=\boldsymbol{x}(s;t)}.\end{eqnarray}$$
As before, equation (2.16) should be solved along the iso-contours of
 $c$
, which are the characteristics of the PDE (2.15).
2.5 Velocity reconstruction
For an experimentally or numerically obtained scalar field,
 $c(\boldsymbol{x},t)$
, the characteristic
 $\boldsymbol{x}(s;t)$
emanating from any point
 $\boldsymbol{x}_{0}(t):=\boldsymbol{x}(0;t)$
can be computed numerically from (2.4). To recover the velocity
 $\tilde{\boldsymbol{u}}(s;t)$
at a point
 $\boldsymbol{x}(s;t)$
of such a characteristic via (2.6), we need to know the velocity
 $\tilde{\boldsymbol{u}}(0;t)$
at the initial location
 $\boldsymbol{x}_{0}(t)$
. The PDE (2.3) is well-posed only if such a set of initial velocity vectors is available along a non-characteristic curve
 $\unicode[STIX]{x1D6E4}(t)$
, i.e. along a curve segment that is transverse to the characteristics at each of its points. If, however, the diffusivity
 $\unicode[STIX]{x1D707}$
is a priori available, then only one component of
 $\tilde{\boldsymbol{u}}(0;t)=\boldsymbol{u}(\boldsymbol{x}_{0},t)$
needs to be known along the non-characteristic curve
 $\unicode[STIX]{x1D6E4}(t)$
, because the other component can be determined from (1.1). For example, if only the
 $u(\boldsymbol{x},t)$
velocity is known at a point of
 $\boldsymbol{x}\in \unicode[STIX]{x1D6E4}(t)$
, then
 $v(\boldsymbol{x},t)$
can be uniquely determined from (1.1) as long as the contour of
 $c(\boldsymbol{x},t)$
is not locally parallel to the
 $x$
-direction, i.e. as long as
 $\unicode[STIX]{x2202}c(\boldsymbol{x},t)/\unicode[STIX]{x2202}y\neq 0$
.
To reconstruct the velocity field
 $\boldsymbol{u}(\boldsymbol{x},t)$
over the largest possible domain, the initial velocities must therefore be known along a curve
 $\unicode[STIX]{x1D6E4}(t)$
transverse to the level curves of
 $c(\boldsymbol{x},t)$
over the largest possible domain. Most of the characteristics (level curves) in our examples will be closed, but this is not a requirement for our method to be applicable. Indeed, to obtain
 $\boldsymbol{u}(\boldsymbol{x},t)$
along a non-closed level set of
 $c(\boldsymbol{x},t)$
, one simply has to integrate equation (2.4) both in the forward and the backward
 $s$
-direction until the domain boundary is reached.
The formulae (2.7)–(2.17) contain the first-order temporal derivative of the observed scalar
 $c(\boldsymbol{x},t)$
, as well as up to second- and up to third-order spatial derivatives, respectively. This presents challenges for velocity reconstruction over domains where only scarce information on
 $c(\boldsymbol{x},t)$
is available. We envision, however, applications of this velocity reconstruction procedure in situations where high-resolution imaging of
 $c(\boldsymbol{x},t)$
is available, enabling an accurate computation of the necessary derivatives.
In geophysical flows, the ratio of advective transport rate to the diffusive rate (i.e. the dimensionless Péclet number) tends to be large. For such large Péclet numbers, in the formulae relevant for velocity reconstruction under a known diffusivity ((2.7), (2.9), (2.11) and (2.17)), errors and uncertainties arising from computing the necessary third derivatives are suppressed by the small
 $\unicode[STIX]{x1D707}$
values multiplying these terms. We illustrate this effect in § 4.2 with respect to substantial under-sampling and moderate uncertainties.
3 Numerical examples
We now carry out our proposed velocity reconstruction scheme in two examples. In both, we generate
 $c(\boldsymbol{x},t)$
numerically by evolving an initial scalar distribution
 $c_{0}(\boldsymbol{x}):=c(\boldsymbol{x},t_{0})$
under the PDE (1.1) with a known velocity field
 $\boldsymbol{u}(\boldsymbol{x},t)$
, then reconstruct
 $\boldsymbol{u}(\boldsymbol{x},t)$
solely from observations of
 $c(\boldsymbol{x},t)$
. We solve for
 $c(\boldsymbol{x},t)$
by discretizing (1.1) using the pseudospectral method. The necessary spatial derivatives of
 $c(\boldsymbol{x},t)$
in the reconstruction formulae are evaluated in the frequency domain using MATLAB’s fast Fourier transform (FFT) algorithm; the time integration is performed in real space using MATLAB’s variable-order adaptive time step solver, ODE45. The standard
 $2/3$
dealiasing is applied where the energy in the last one-third of the wavenumbers is artificially removed. In both examples, the scalar diffusivity is taken to be
 $\unicode[STIX]{x1D707}=0.01$
and a 512
 $\times$
512 grid is used. We perform the integration of the characteristic ODEs ((2.4) and (2.5)) using MATLAB’s ODE113 to achieve high accuracy.
3.1 Example 1: Steady, analytic, inviscid velocity field
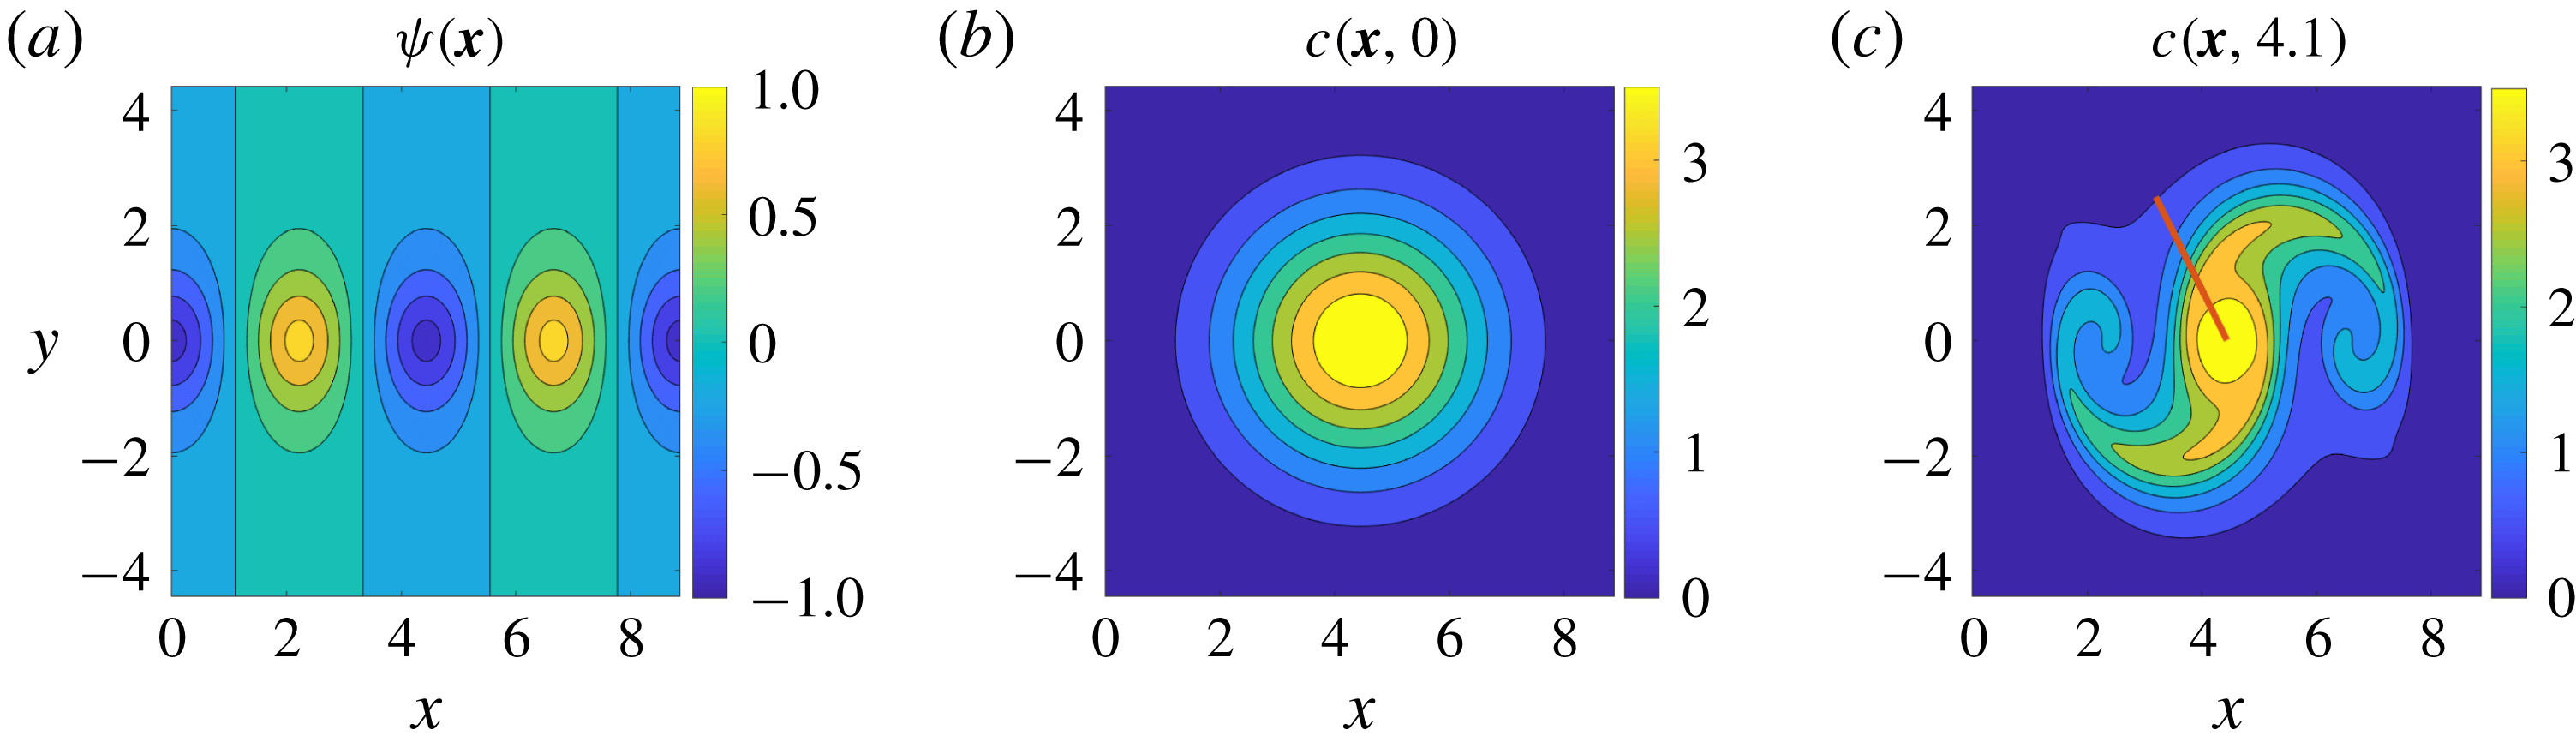
We consider the Mallier–Maslowe vortices (Mallier & Maslowe Reference Mallier and Maslowe1993; Gurarie & Chow Reference Gurarie and Chow2004) which are exact solutions of the two-dimensional Euler equations. Modelling a periodic row of vortices with alternating rotation directions, the corresponding velocity field derives from the streamfunction
 $$\begin{eqnarray}\unicode[STIX]{x1D713}(\boldsymbol{x})=\text{arctanh}\left[{\displaystyle \frac{\unicode[STIX]{x1D6FC}\cos \sqrt{1+\unicode[STIX]{x1D6FC}^{2}}x}{\sqrt{1+\unicode[STIX]{x1D6FC}^{2}}\cosh \unicode[STIX]{x1D6FC}y}}\right],\end{eqnarray}$$
which we plot for reference in figure 1(a) for
 $\unicode[STIX]{x1D6FC}=1$
.
Contour plot of the steady-state streamfunction for Mallier–Maslowe vortices with
 $\unicode[STIX]{x1D6FC}=1$
in (3.1) (a), and the evolution of the initial concentration field (b), along these vortices into the one at
 $t=4.1$
(c), for the scalar diffusivity value
 $\unicode[STIX]{x1D707}=0.01$
.

Over the square domain
 $\boldsymbol{x}\in [0,2\sqrt{2}\unicode[STIX]{x03C0}]\times [-\sqrt{2}\unicode[STIX]{x03C0},\sqrt{2}\unicode[STIX]{x03C0}]$
, we generate the diffusive scalar distribution
 $c(\boldsymbol{x},t)$
from the initial concentration field
 $c(\boldsymbol{x},0)=4\exp [-0.2((x-\sqrt{2}\unicode[STIX]{x03C0})^{2}+y^{2})]$
by solving the transport equation (1.1). No advective transport is possible among the cells defined by the streamfunction in figure 1(a), but diffusion enables the transport of the scalar
 $c$
across cell boundaries. We will reconstruct the underlying velocity field generated by (3.1) at the time
 $t=4.1$
. The initial and the evolved scalar fields are shown in figure 1(b,c). The non-characteristic initial curve
 $\unicode[STIX]{x1D6E4}(t)$
for the characteristics is formed by a set of 100 points on the solid red curve in figure 1(c), along which we consider the velocities known.
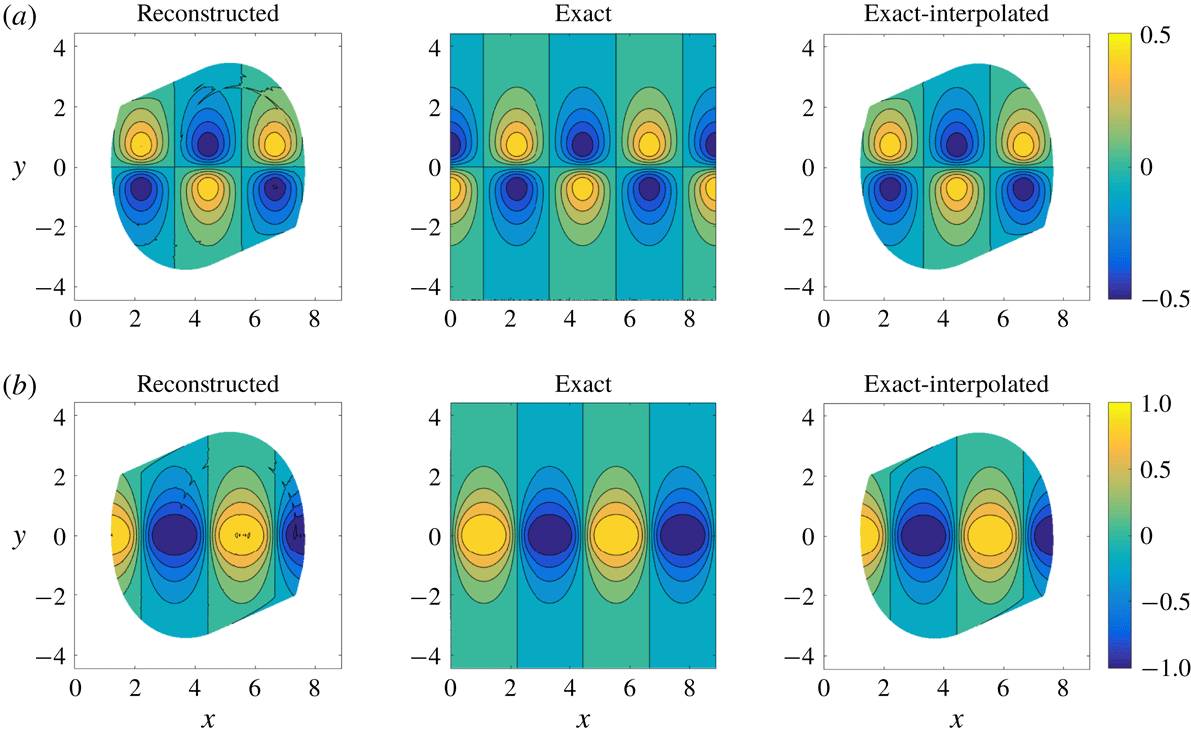
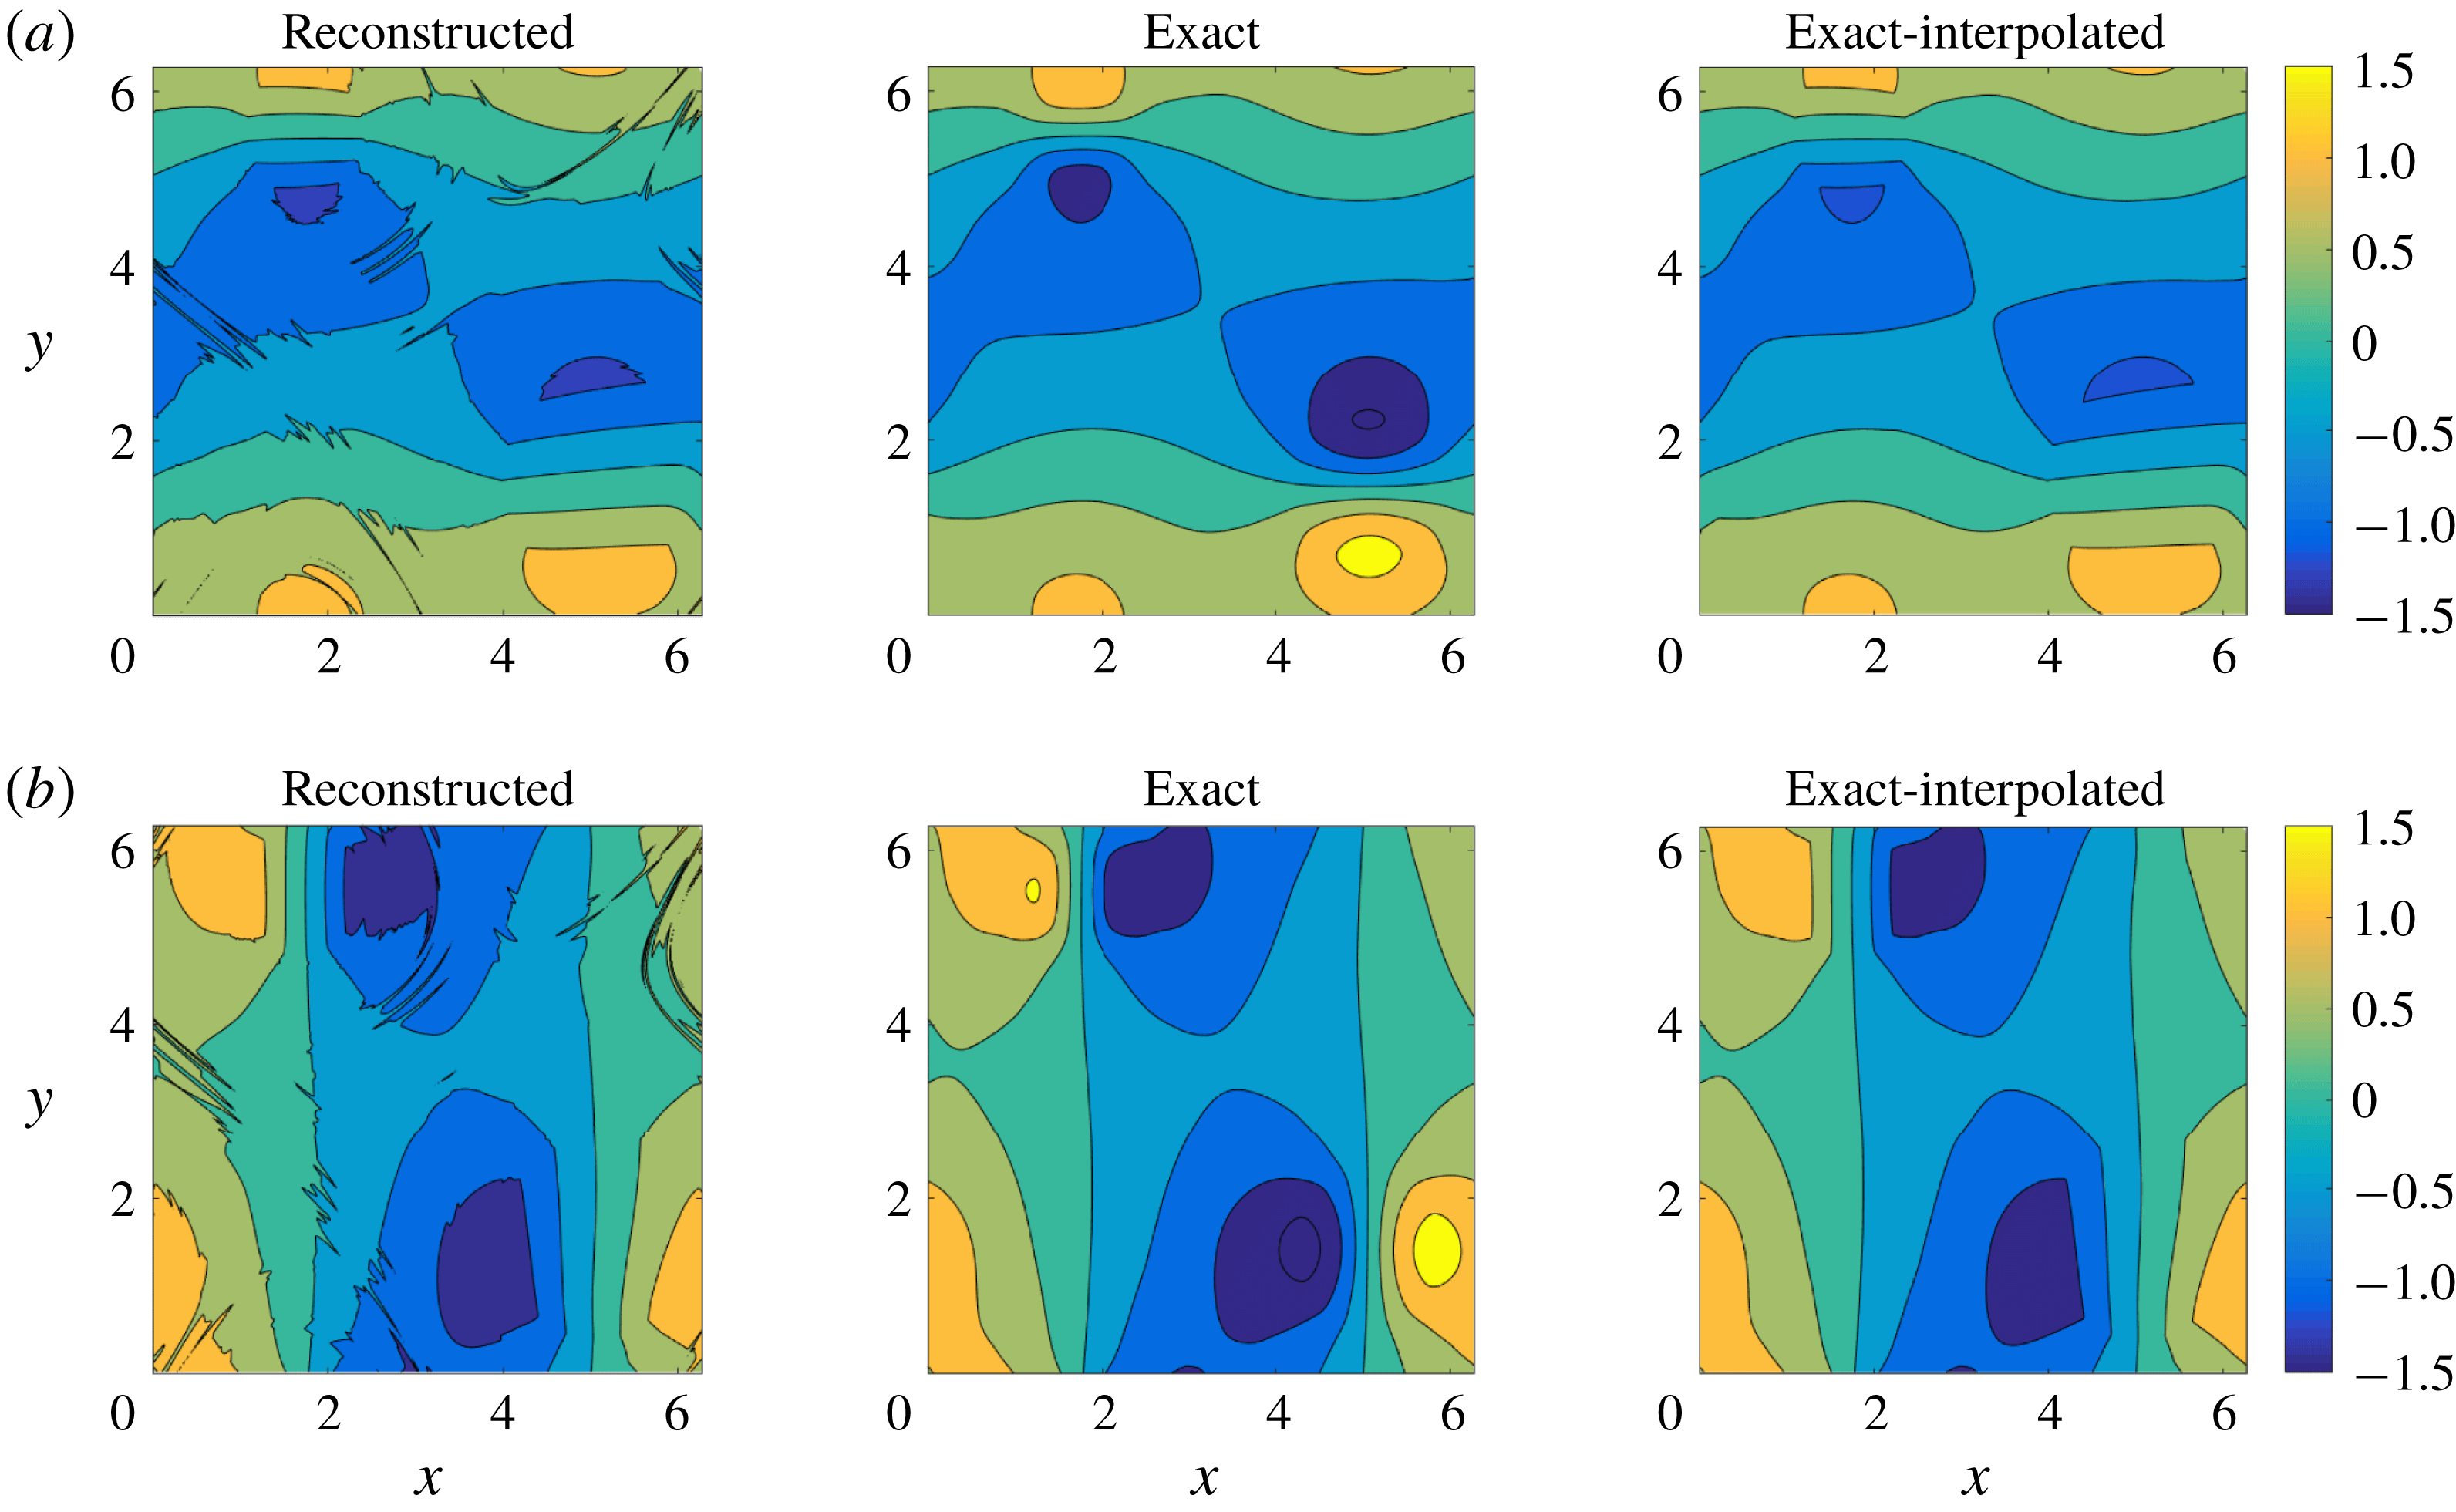
Reconstructed, exact and exact-interpolated velocities for Example 1 at
 $t=4.1$
, with the diffusivity assumed unknown: (a)
 $u(\boldsymbol{x},4.1)$
, (b)
 $v(\boldsymbol{x},4.1)$
. The reconstructed velocities have been interpolated from the characteristics (level sets in figure 1
c) to a uniform grid. The exact-interpolated velocities are obtained by evaluating equation (3.1) over the characteristics at
 $t=4.1$
, then interpolating to the same uniform grid used for the reconstructed velocities. This procedure is designed to factor out interpolation errors that would be present in a direct comparison with the exact velocity field evaluated directly over the numerical grid.

Next, we reconstruct the velocity field using both the known- and the unknown-diffusivity formulation. While integrating equation (1.1), we record velocities along each characteristic at 3000 locations, irrespective of their lengths. We define the relative normed error over the computational domain as the ratio of the
 $L_{2}$
norm of the difference between the reconstructed and the original velocity field to the
 $L_{2}$
norm of the original velocity field defined in (3.1). For the
 $u$
velocity component, this error norm,
 $E_{u}$
, can be written as
 $$\begin{eqnarray}E_{u}={\displaystyle \frac{||u_{reconst.}-u_{exact}||_{2}}{||u_{exact}||_{2}}},\end{eqnarray}$$
where
 $u_{reconst.}$
and
 $u_{exact}$
are the reconstructed and exact
 $u$
-velocities, respectively. The error,
 $E_{v}$
, for the
 $v$
velocity component is defined similarly. We have found
 $E_{u}$
and
 $E_{v}$
for the known-diffusion case (not shown) to be
 $1.6\times 10^{-3}$
and
 $1.2\times 10^{-3}$
, respectively, and for the unknown-diffusion case to be
 $1.7\times 10^{-2}$
and
 $1.1\times 10^{-2}$
, respectively. For reference, we also show exact-interpolated velocities in figure 2(a), i.e. velocities evaluated exactly along the 3000 locations along the characteristics, then interpolated onto the regular grid used for visualization.
Figure 2 shows that throughout the domain spanned by the characteristics emanating from the inital-condition curve
 $\unicode[STIX]{x1D6E4}(t)$
(solid red line in figure 1
c), there is generally close agreement between the reconstructed and the exact velocity profiles. The domain of the velocity reconstruction is limited by the weak mixing of the scalar field
 $c(\boldsymbol{x},t)$
in this steady flow. The initial condition curve in figure 1(c) only intersects the scalar contours forming the three middle cells in figure 1(a). Hence, only these cells appear in the reconstructed velocities on the left in figure 2(a,b).
3.2 Example 2: Unsteady Navier–Stokes velocity field
We now apply our velocity reconstruction procedure to an unsteady flow obtained from the direct numerical solution of the unforced, two-dimensional Navier–Stokes equations. We solve the vorticity–streamfunction formulation of the equations, as described, e.g. in Melander, McWilliams & Zabusky (Reference Melander, McWilliams and Zabusky1987), over the doubly periodic square domain
 $(x,y)\in [0,2\unicode[STIX]{x03C0}]\times [0,2\unicode[STIX]{x03C0}]$
with the non-dimensional kinematic viscosity
 $\unicode[STIX]{x1D708}=10^{-5}$
. Hence, the scalar diffusion characterized by
 $\unicode[STIX]{x1D707}=0.01$
is faster than the vorticity diffusion, in contrast to the requirements of the SIV method of Dahm et al. (Reference Dahm, Su and Southerland1992). We initialize the numerical simulation with the velocity field
 $$\begin{eqnarray}\left.\begin{array}{@{}c@{}}\displaystyle u(x,y,0)=\sin (x)\cos (y)+\sin (3x)\cos (3y),\\ \displaystyle v(x,y,0)=-\cos (x)\sin (y)-\cos (3x)\sin (3y).\end{array}\right\}\end{eqnarray}$$
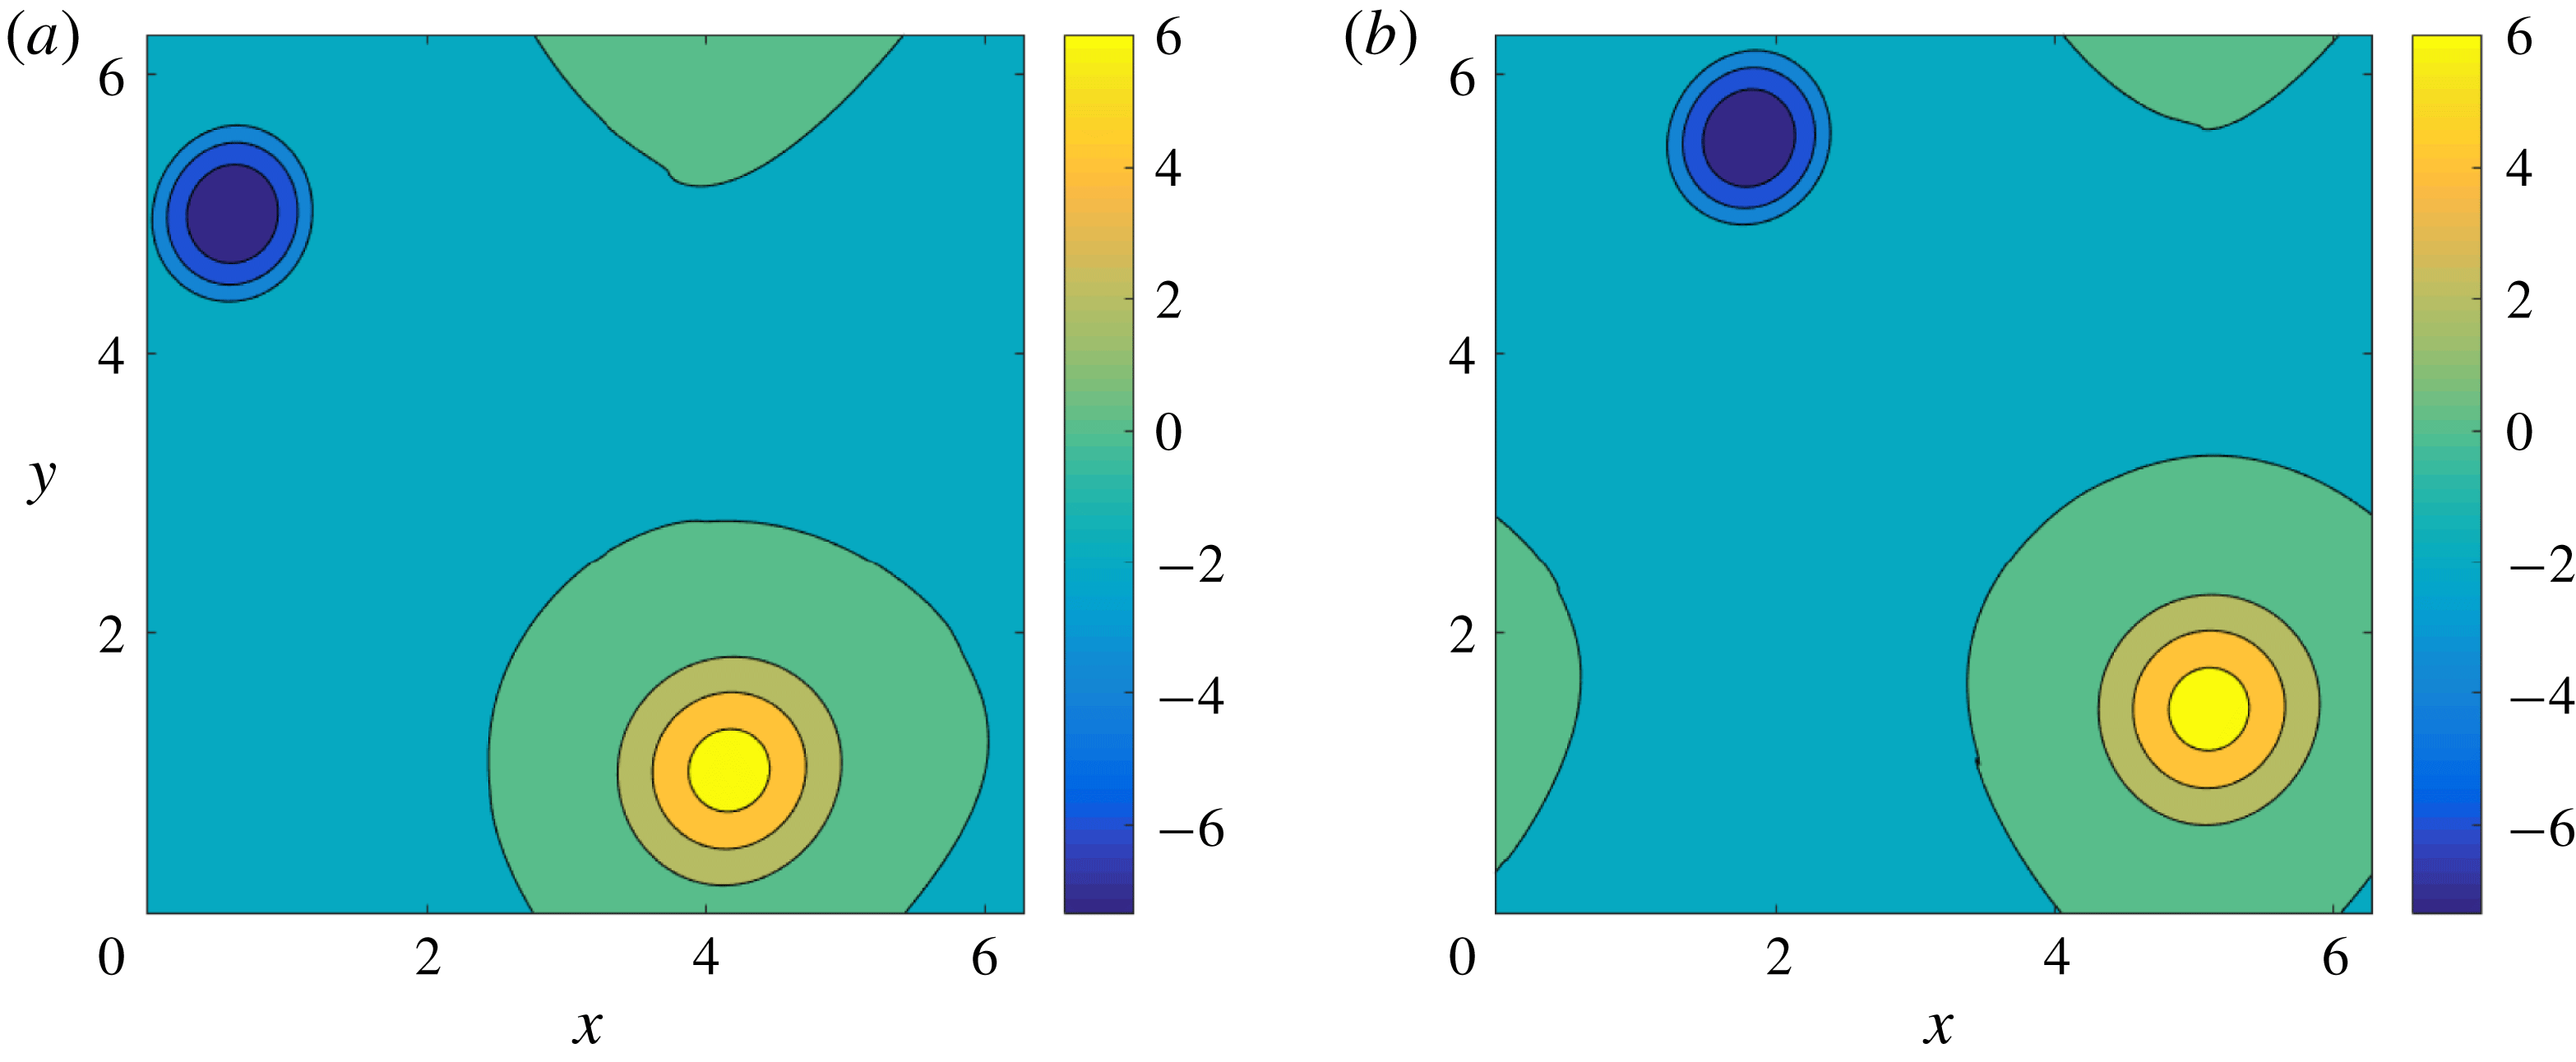
Eventually, two distinct regions of opposite vorticity with different strengths emerge, subsequently evolving periodically within the domain, as shown in figure 3. For longer simulation times (
 $t\approx 500$
here), these final structures exhibit slow decay due to dissipation and weak nonlinearity (Matthaeus et al.
Reference Matthaeus, Stribling, Martinez, Oughton and Montgomery1991).
Evolution of vorticity field for Example 2: (a)
 $\unicode[STIX]{x1D714}(\boldsymbol{x},490)$
and (b)
 $\unicode[STIX]{x1D714}(\boldsymbol{x},499.5)$
.

Using the velocity field from
 $t_{0}=490$
onwards, we advect a scalar field
 $c(\boldsymbol{x},t)$
with initial distribution
 $$\begin{eqnarray}c(\boldsymbol{x},t_{0})=4\exp [-0.5((x-\unicode[STIX]{x03C0})^{2}+(y-\unicode[STIX]{x03C0})^{2})],\end{eqnarray}$$
and with diffusivity
 $\unicode[STIX]{x1D707}=0.01$
(cf. figure 4). The unsteady velocity field visibly leads to intense mixing compared to Example 1.
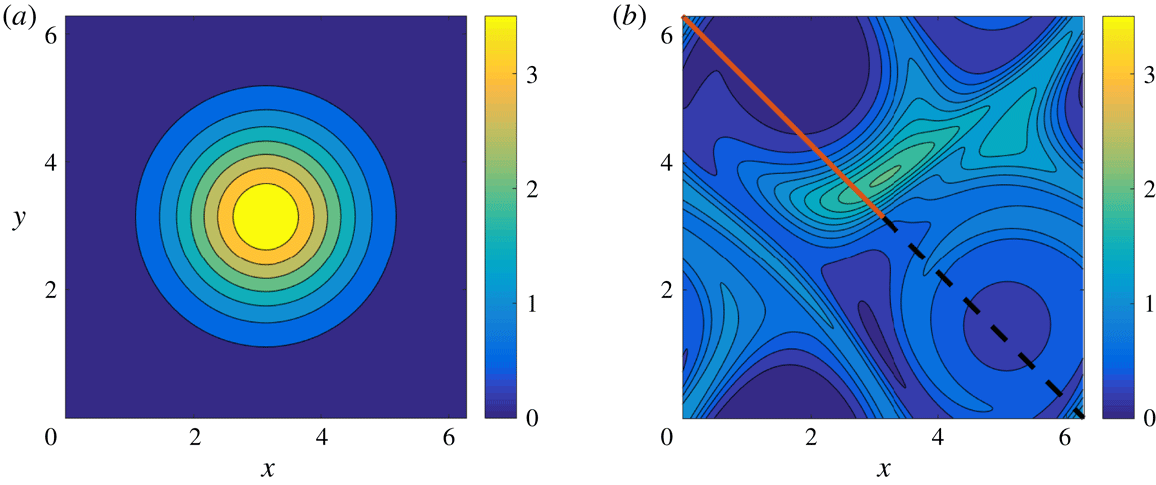
Evolution of the diffusive scalar
 $c(\boldsymbol{x},t)$
under the unforced, two-dimensional Navier–Stokes flow initialized by the velocity field (3.3) of Example 2: (a)
 $c(\boldsymbol{x},490)$
, (b)
 $c(\boldsymbol{x},499.5)$
. The solid red curve and the dashed black curve shown over the diffused concentration field are two different initial (non-characteristic) curves for the velocity reconstruction.

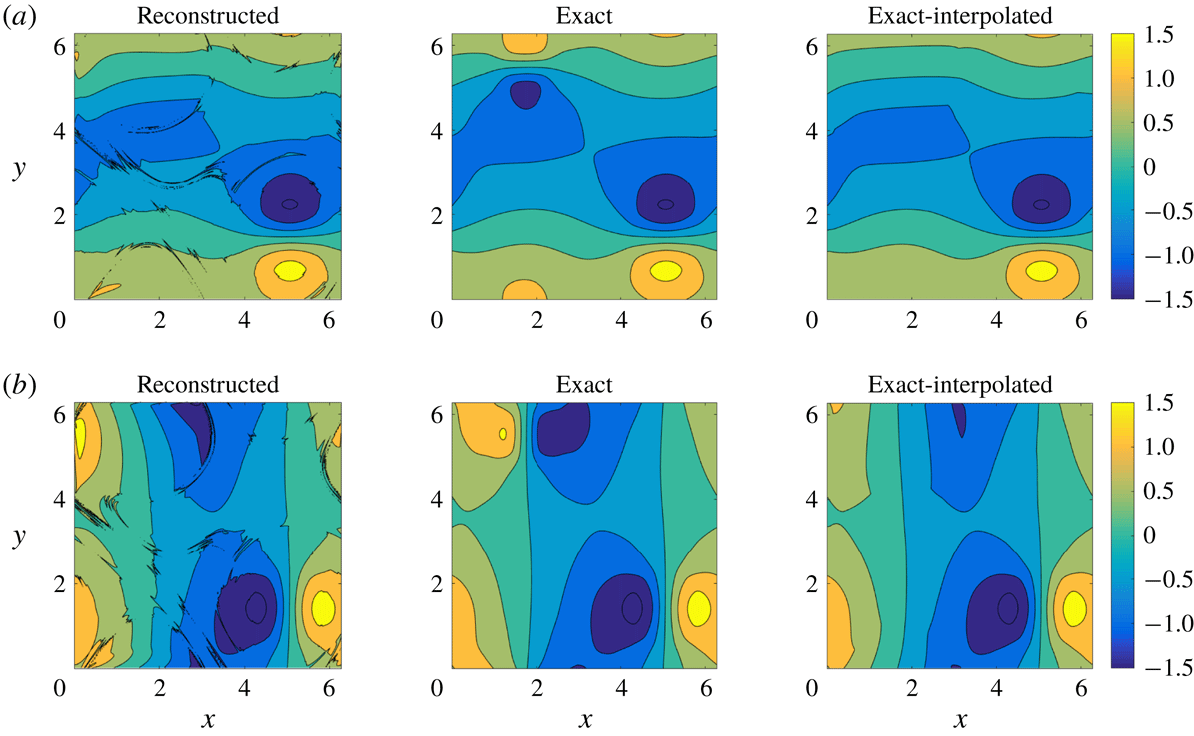
Reconstructed, exact and exact-reconstructed velocities for Example 2 (with the diffusivity,
 $\unicode[STIX]{x1D707}$
, treated as unknown) at
 $t=499.5$
, using the red solid line from figure 4(b) as the initial curve: (a)
 $u(\boldsymbol{x},499.5)$
, (b)
 $v(\boldsymbol{x},499.5)$
.

We have reconstructed the velocity field for various times between
 $t_{0}=490$
and
 $t=499.5$
with similar outcomes in all cases. Here we only show the result for
 $t=499.5$
in figures 5 and 6 for the solid red and dashed black lines of figure 4 as initial curves, respectively.
3.2.1 Solid red initial curve
If the initial curve
 $\unicode[STIX]{x1D6E4}(t)$
for the characteristic ODEs (2.4)–(2.5) is the solid red curve in figure 4, then the reconstructed velocity field captures most features of the true velocity field. For the known diffusivity formulation, the reconstruction errors
 $E_{u}$
and
 $E_{v}$
are
 $1.9\times 10^{-3}$
and
 $2.5\times 10^{-3}$
, respectively. For the unknown diffusivity formulation, we have obtained
 $E_{u}=5.2\times 10^{-2}$
and
 $E_{v}=5.9\times 10^{-2}$
. For the more erroneous latter case, the overall qualitative accuracy is still compelling, as we show in figure 5. Most of the local inaccuracies arise from interpolation errors, due to a lack of penetration of the external scalar level curves into the cores of high-vorticity regions (cf. the lower-right region of figure 4
b). This is confirmed by a comparison of the exact-interpolated and the exact plots in figure 5(a,b). While the spatial domain of the reconstructed velocity is limited by the presence of scalar transport barriers, the numerical calculation is overall accurate (cf. the reconstructed and exact-interpolated plots of figure 5).
3.2.2 Dashed – black curve
For this case (with the scalar diffusivity,
 $\unicode[STIX]{x1D707}$
, assumed unknown), the reconstructed velocity field recovers the positive high-vorticity region (bottom right of figure 3
b), fully capturing even the finer features (cf. the reconstructed versus the exact velocity field in figure 6). However, the negative vorticity region in the top left of figure 3(b) is not fully captured in the reconstructed velocity plots of figure 6. The error from this calculation is nevertheless still low:
 $E_{u}=6.92\times 10^{-2}$
and
 $E_{v}=6.23\times 10^{-2}$
.


4 Oceanographic applications
Oceanic velocities are key variables in understanding a number of environmental processes that range from climate change and global warming to transport of pollutants and various bio/geo/chemical tracers. Obtaining reliable estimates for ocean currents with high accuracy and resolution, however, remains a challenging task.
Oceanic velocities can be measured directly by current meters or acoustic doppler current profiler (ADCP) instruments attached to ships, stationary moorings, or towed or autonomous sampling platforms. Such estimates provide vertical profiles or sections of velocities at select locations or along select ship tracks but only at limited times and locations. Ship-based ADCP sections, however, can provide the required initial conditions for our proposed velocity reconstruction method along all tracer contours intersecting the ship track.
Surface drifters also provide estimates of near-surface ocean currents. These semi-Lagrangian instruments consist of a surface-drifting buoy equipped with a GPS tracker and a subsurface drogue, or sail, underneath. Finite differencing consecutive GPS fixes with respect to the time interval between neighbouring GPS transmissions provides estimates for the underlying ocean currents at the depths of the drogue, typically 20 m. The Global Surface Drifting Buoy Array maintained by NOAA is part of their Global Ocean Observing System (http://www.aoml.noaa.gov/phod/gdp/objectives.php). Currently, this drifter array has 1445 operational drifters that are distributed throughout the world oceans with at least 1 drifter per each
 $5^{\circ }\times 5^{\circ }$
bin at any given time. Although the
 $5^{\circ }$
resolution of the resulting velocity field obtained from these drifters via finite differencing appears coarse, it would yield a much higher-resolution global estimate of the near-surface oceanic velocities when used as a boundary condition for the velocity inversion proposed here along all observed tracer contours passing through drifters positions.
A third alternative for collecting ocean current data is indirect remote sensing from either land-based or satellite-based radars. For example, satellite-based estimates of sea surface height provide nearly global geostrophic velocities at the ocean surface (cf. https://www.aviso.altimetry.fr). However, these velocity estimates only provide the geostrophic component of the total velocity field and only on spatial scales larger than meso-scale. Land-based high-frequency radars, on the other hand, can measure full surface velocity at a higher spatio-temporal resolution, but only over limited spatial domains.
Satellite-based measurements of diffusive tracers – such as sea surface temperature, sea surface salinity, or ocean colour – are also available. Applying the velocity reconstruction technique described in this paper to these tracer distributions, along with the available information about the localized velocity values from current meters, ADCPs, drifters, moorings or HF radars, would potentially allow for the estimation of the oceanic velocities in a much larger (possibly global) domain.
Clearly, the opportunities we have described above for ocean current reconstruction come with their own challenges, including non-diffusive decay of tracers, sporadic availability of the tracers in space and time, presence of noise in data, lack of exact two-dimensionality and incompressibility, and spatial dependence of the diffusivity. Some of these challenges we have already addressed in §§ 2.3 and 2.4, sensitivity to noise and undersampling will be explored in § 4.2, and the rest we leave to future work. As a proof of concept, we consider below a numerical example in which we apply our proposed velocity inversion to a conservative tracer in a barotropic ocean circulation model.
4.1 Application to an ocean circulation model
We seek to reconstruct velocities from a tracer distribution generated numerically by the ocean circulation model MITgcm (Marshall et al. Reference Marshall, Adcroft, Hill, Perelman and Heisey1997). We keep the complexity of the model to the minimum and use the simplest form of the advection–diffusion equation with a constant diffusivity coefficient. In its linear limit, the model is configured to reproduce the solution described by the Munk model of the wind-driven ocean circulation (Munk Reference Munk1950), though the numerical model allows for nonlinear features to develop, such as eddies and jets.
The simulation has been configured on a beta-plane with a rigid lid, 3.5 km spatial resolution, a temporal step of 200 s and a momentum diffusion coefficient of
 $40~\text{m}^{2}~\text{s}^{-1}$
. The fluid is unstratified and initially is at rest, but is subject to a temporally constant stress at the surface boundary that drives the gyre flows that develop. Momentum input by the wind at the surface is removed by boundary friction at the lateral boundaries.
Consistent with the Munk model, we mimic the time-mean-observed winds with an idealized structure that is zonally uniform and exerts stress only in the zonal direction. The winds have a cosine structure in the meridional direction, with westerly winds at mid latitudes and easterly winds to the north and south. The net vorticity input into the domain is zero, with the negative vorticity input into the northern half of the domain balanced by the positive vorticity in the south of the domain. A 2-gyre ocean circulation develops, with intense western boundary currents mimicking the Gulf Stream and Labrador currents of the Atlantic Ocean, and the Kuroshio and Oyashio of the Pacific. The two gyres are separated by a meandering jet – an analogue of the Gulf Stream or Kuroshio Extension currents.
After an initial spin up of 300 days, a tracer with a constant meridional gradient was released into the model, and its evolution over the subsequent 180 days was simulated numerically using an advection–diffusion scheme with constant diffusivity coefficient
 $\unicode[STIX]{x1D707}=100~\text{m}^{2}~\text{s}^{-1}$
. Three consecutive tracer snapshots 200 s apart were saved on day 180 and were used to numerically estimate matrix
 $\unicode[STIX]{x1D63C}$
and vector
 $\boldsymbol{b}$
in (2.7), for use with the velocity inversion equation (2.5). All tracer derivatives were computed using finite differences, in a manner similar to what is feasible in ocean applications involving remotely sensed velocity and tracer data.
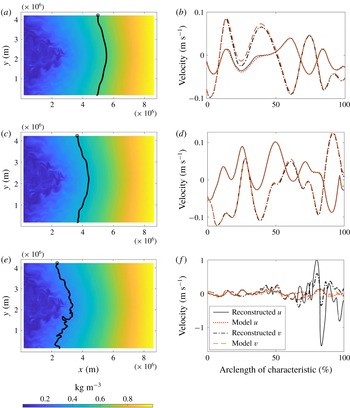
We have applied the velocity inversion method with known-scalar diffusivity (2.5)–(2.7) to reconstruct velocities along several tracer iso-contours covering different parts of the model domain. We show a comparison between the reconstructed velocity and the ground truth (actual model velocity on day 480) in figure 7 for three representative tracer contours. In this calculation, we assume that the true velocity – our initial condition for integrating (2.5) – is known at the northernmost point of the contour, then perform the integration going southward along the entire length of the contour. The reconstructed velocities provide useful information for oceanographic studies in roughly the right-hand
 $2/3$
of the model domain, far enough from the western boundary where the eddy activity is most vigorous and the tracer contours are most filamented. Close to the western boundary, in the left-hand
 $1/3$
of the domain, the reconstructed velocity diverges from the true model velocity due to numerical errors arising in the computation of
 $\unicode[STIX]{x1D63C}$
and
 $\boldsymbol{b}$
and in the integration of the matrix equation (2.5) along the tracer contours. The reconstructed velocity is still useful along the initial segment of the iso-contour before the error accumulation causes significant mismatch. The reconstruction performs better if we integrate from the equator going poleward to the north and south (thus decreasing the length of the tracer contour two times), or if the true velocity is known at more than one point along the tracer contour. In that case, we can apply the velocity inversion to the segments of the contour instead of the entire contour.
In the case when the spatio-temporal resolution of the scalar field is significantly higher than the dominant length and/or time scales of the flow, the reconstruction can be improved by smoothing the tracer field in space and/or time to suppress noise arising during the calculation of tracer derivatives. In our example, applying a spatial smoothing, specifically the two-dimensional convolution filter ‘conv2’ in MATLAB with a constant-coefficient
 $6\times 6$
square kernel (equivalent to a two-dimensional running average over
 ${\sim}21~\text{km}^{2}$
), allows for reasonably accurate velocity reconstruction further into the left-hand
 $1/3$
of the domain (figure 8).
(b,d,f) Comparison between true and reconstructed
 $u$
and
 $v$
velocity components along the three representative tracer iso-contours in an idealized model of the North Atlantic Ocean. (a,c,e) Tracer distribution with the corresponding iso-contours.

Same as in figure 7 but using a spatially averaged tracer field.

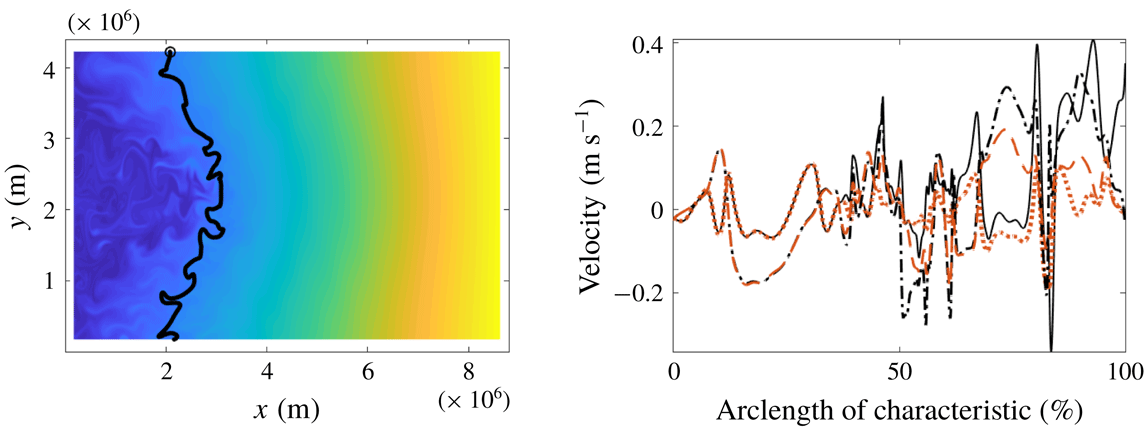
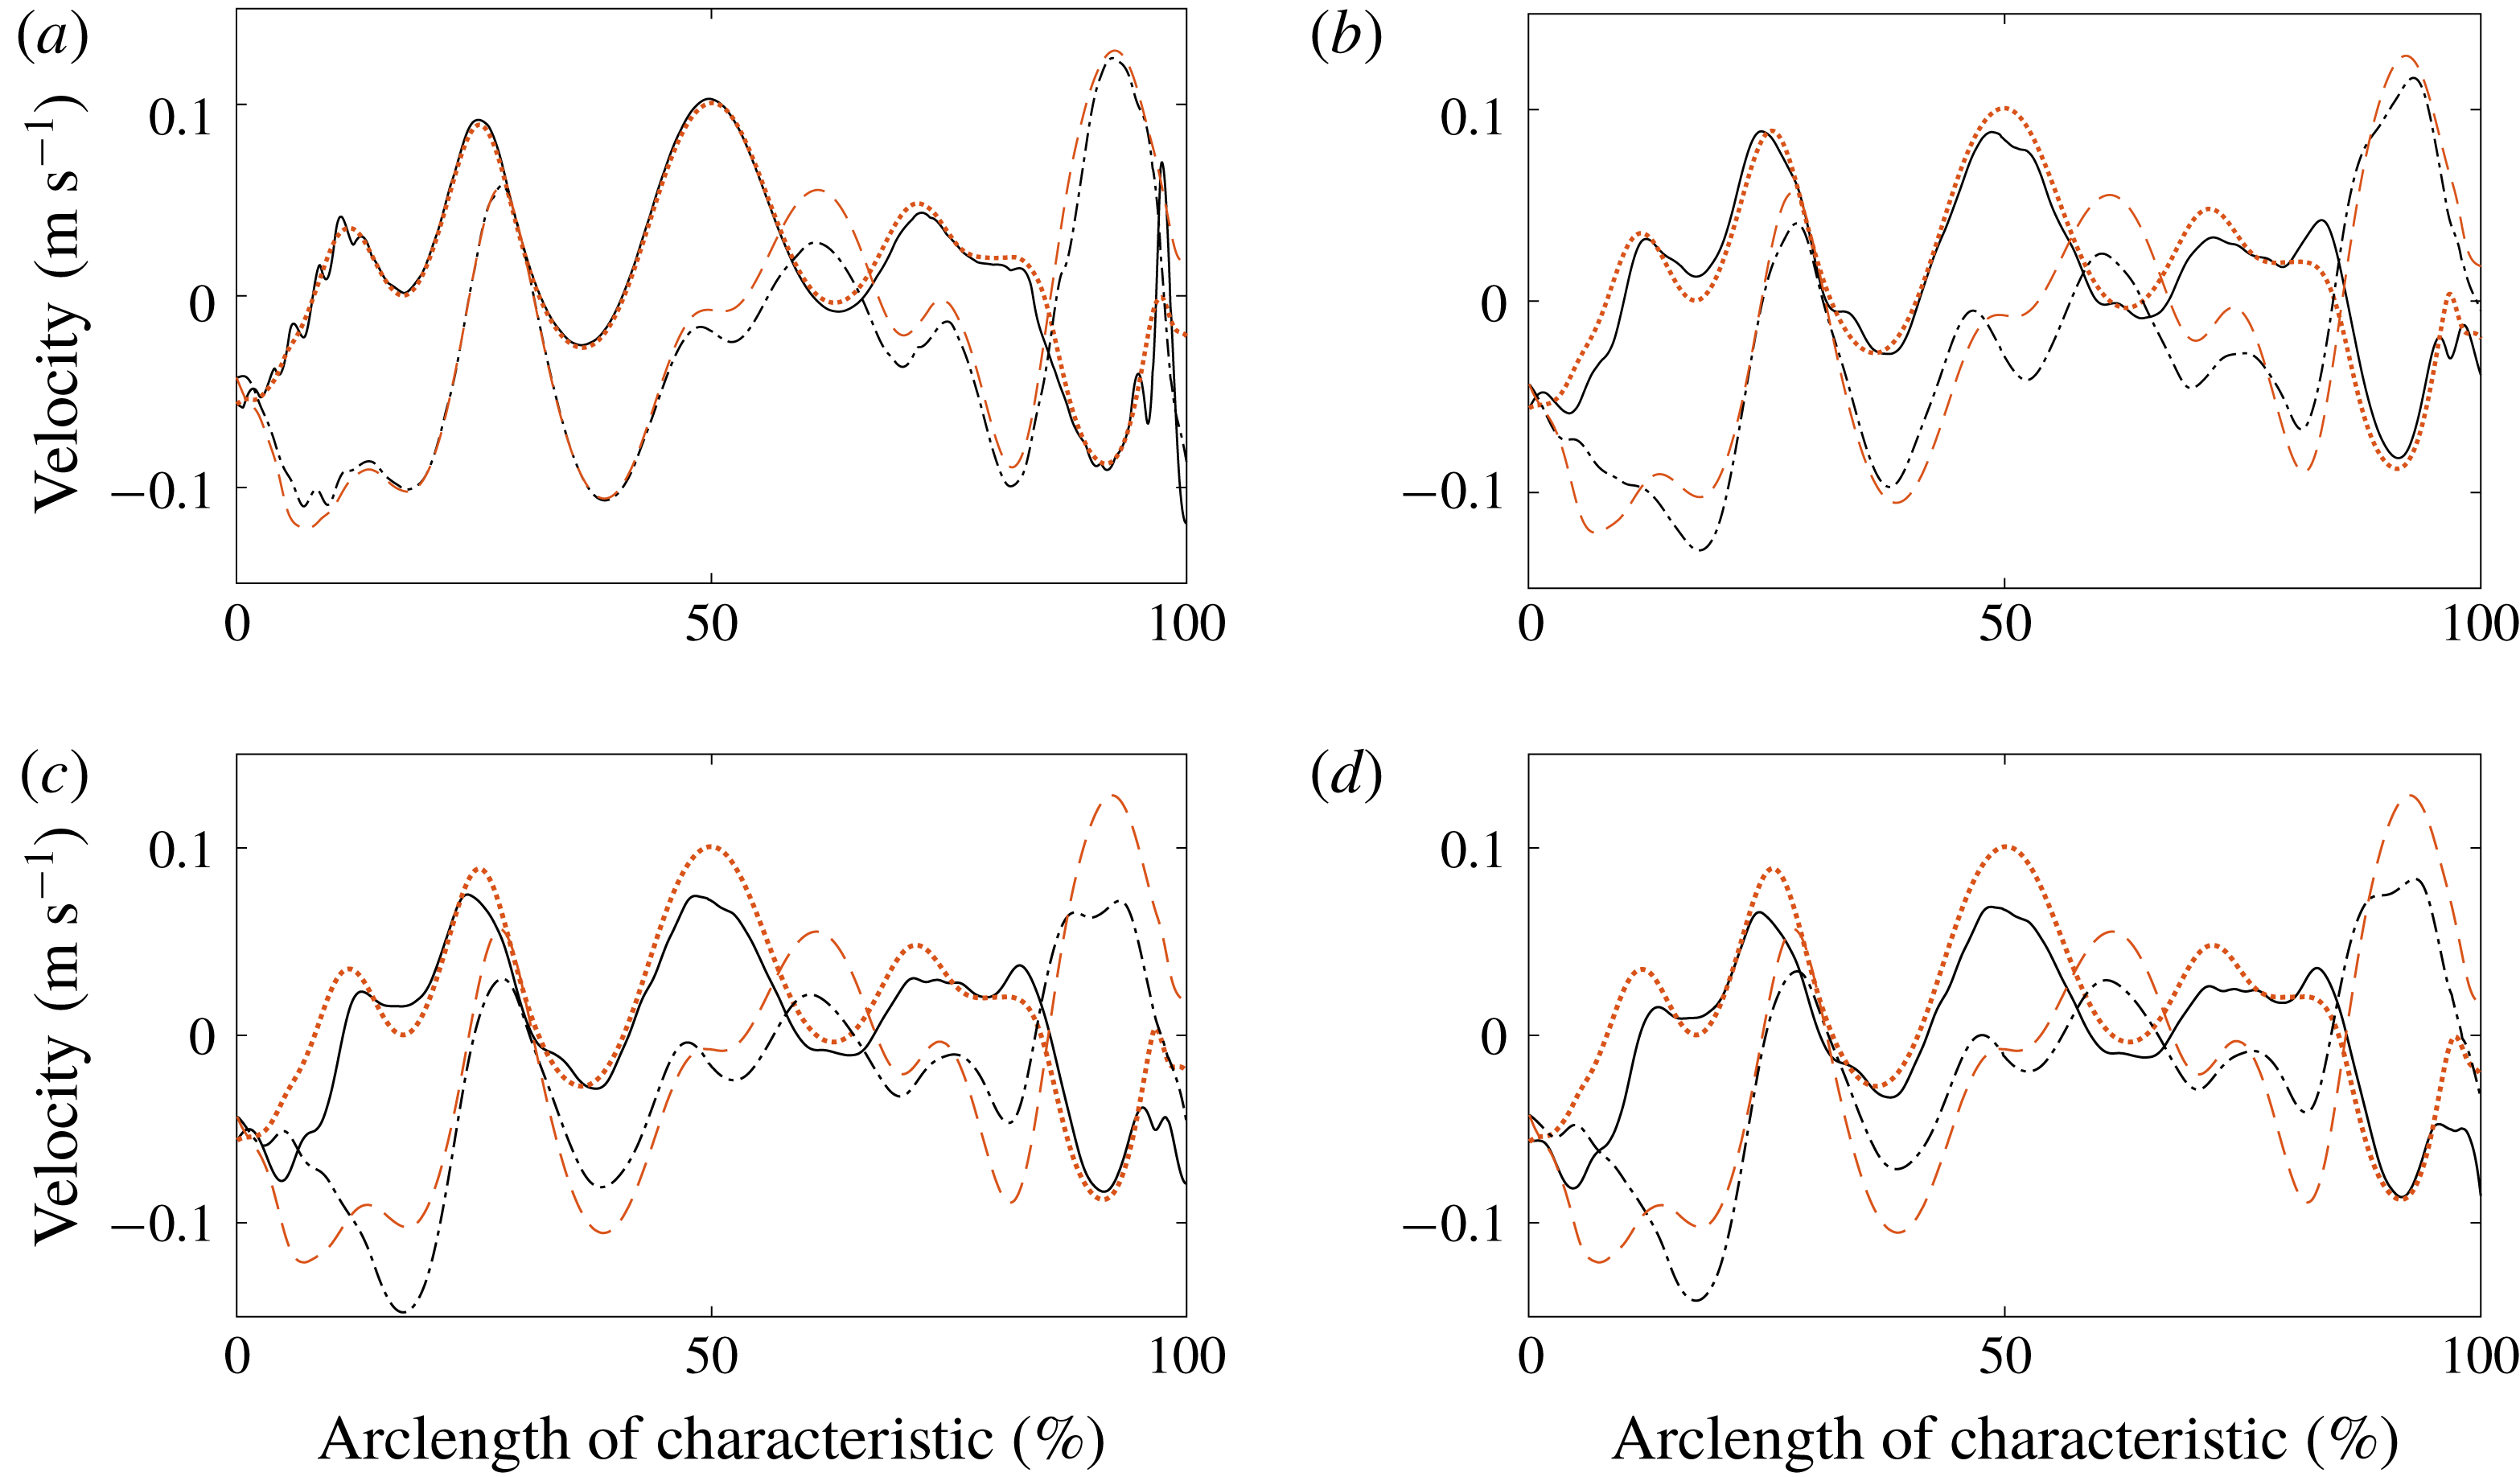
Velocity reconstruction along the contour shown in figure 7(c,d) (same legend for curves), but with sparse/noisy tracer data. (a) 20 times sparse tracer data (resolution changed from 3.5 to 70 km) in each direction; (b) zero-mean
 $\tanh \;(\text{Gaussian})$
noise with Gaussian standard deviation 0.01 and amplitude 10 % of the local temporal mean of the tracer added to the tracer data; (c) as (b) but with 20 % noise amplitude; (d) combination of (a) and (c).


4.2 The effect of resolution and uncertainty in the data
While our analytic velocity reconstruction is, in principle, exact under conditions described in § 2, its practical implementations will have to address sparsity and uncertainty in the available observational data. A general analysis of these issues with real ocean data is beyond the scope of this paper, but we provide an initial illustration of the sensitivities to noise and resolution for the oceanographic model we have studied.
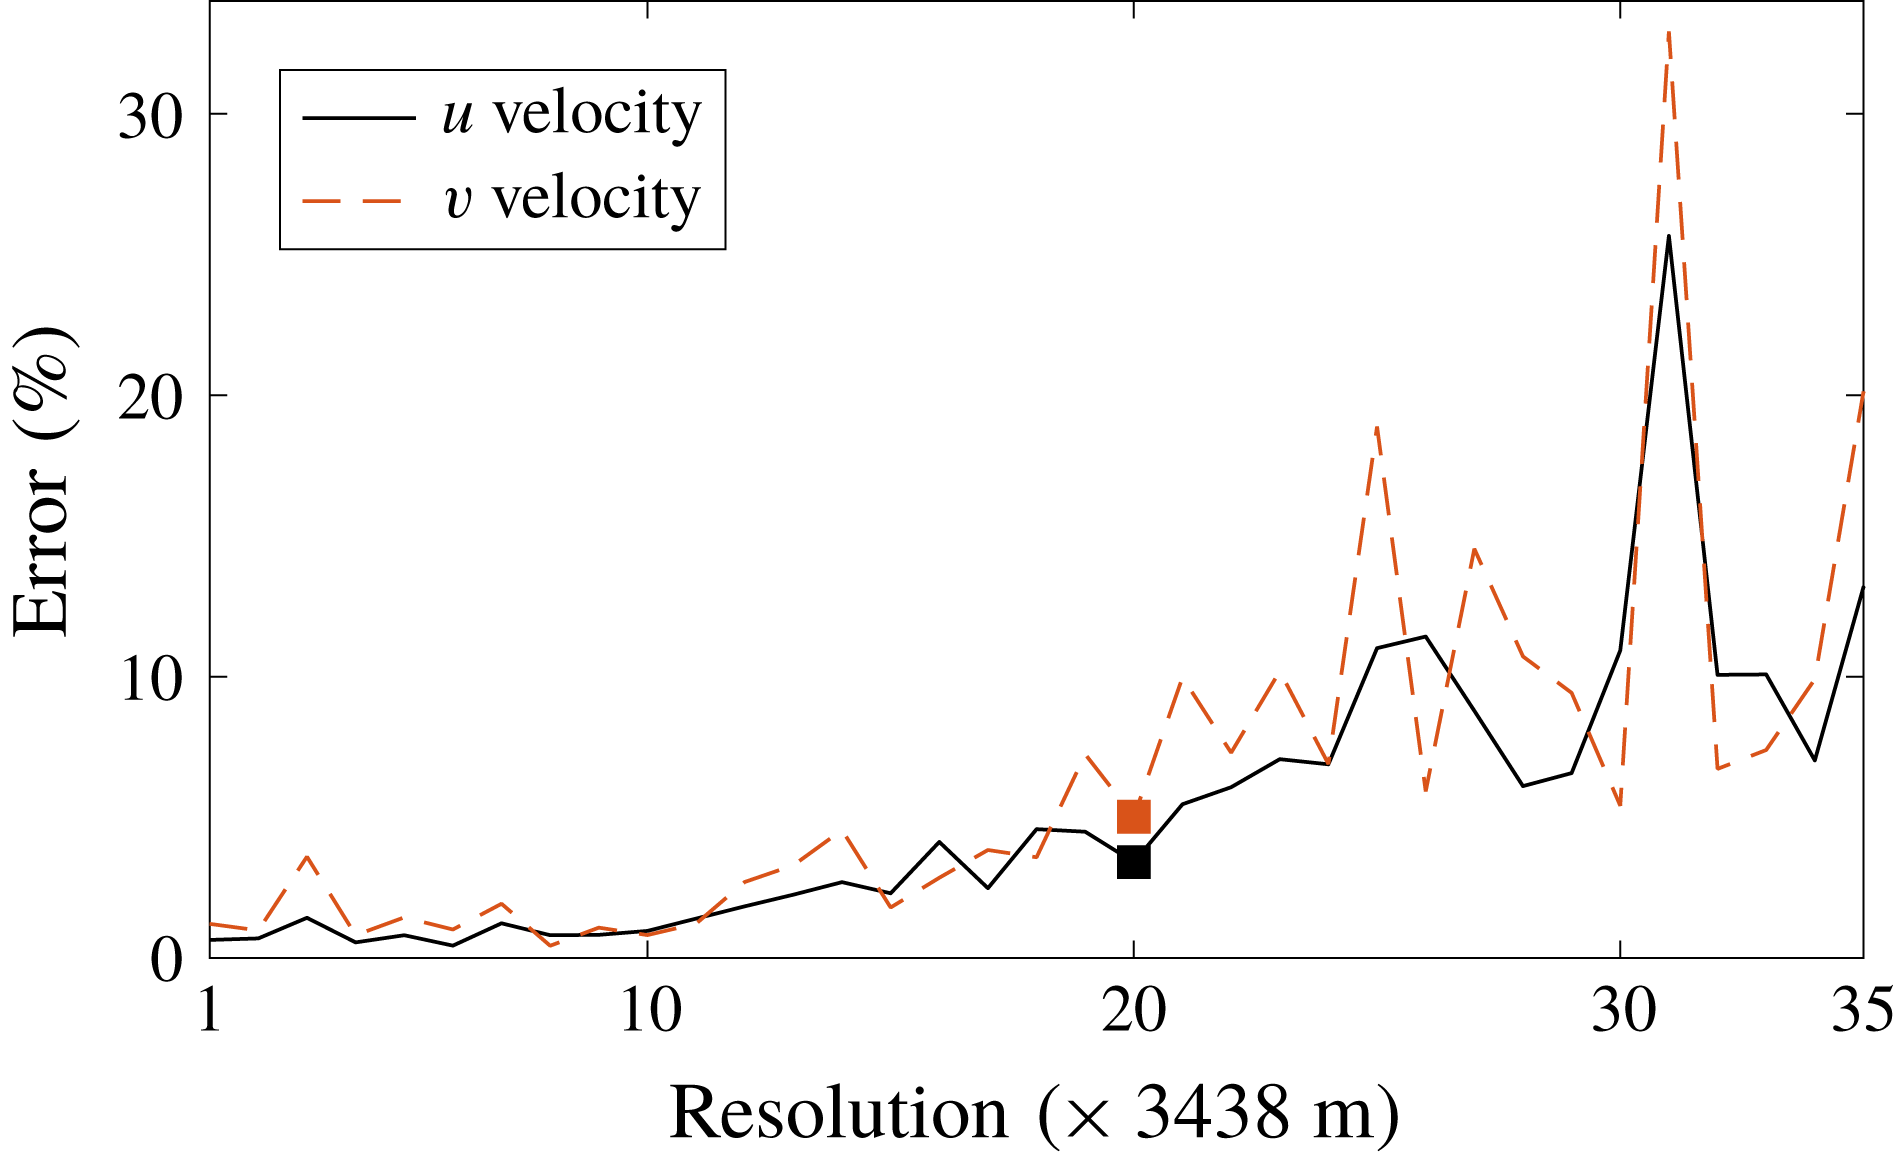
We illustrate the outcome of velocity reconstruction from under-resolved tracer fields in figures 9(a) and 10, where we sub-sampled the full model tracer field over an increasingly sparse grid. The sub-sampled field was then interpolated to its original grid using MATLAB’s build-in cubic interpolator, and the velocity inversion was applied along the same level contour of the tracer, as in figure 7(c,d). An example of the velocity reconstruction using an under-resolved tracer field is shown in figure 9(a).
Our analysis suggests that the inversion is reasonably insensitive to under-sampling as the contour-averaged reconstructed velocity error (expressed as a percentage of the range of respective velocity along the iso-contour) in both the zonal and meridional direction (figure 10) is less than
 $5\,\%$
for grids with spacing up to about 70 km, which is 20 times the original grid spacing. The critical grid spacing is likely to be dependent on the kinetic energy spectrum and the dominant length scales of the flow.
Since real data are noisy, we have also investigated the applicability of the velocity inversion to model fields with increasing noise levels. We add noise pointwise,
 $$\begin{eqnarray}N=A\tanh ({\mathcal{N}}(0,\unicode[STIX]{x1D70E})),\end{eqnarray}$$
where
 $A$
is the noise amplitude and
 ${\mathcal{N}}(0,\unicode[STIX]{x1D70E})$
is a zero-mean Gaussian random variable with standard deviation
 $\unicode[STIX]{x1D70E}$
(generated using MATLAB’s ‘randn’ function), to the model tracer field. Unlike a pure Gaussian signal, (4.1) allows for defining a maximal noise amplitude normally guaranteed for a remote-sensing instrument. As a first step in our reconstruction algorithm, we use a linear regression model using the 37 time slices (about 2 h) centred around the current time to temporally filter the input scalar-field data. We then smooth the noisy tracer concentration fields in space using MATLAB’s ‘conv2’ filter with constant coefficient square kernels, both before and after calculating a scalar derivative required in the reconstruction (cf. (2.7)). For purely spatial derivatives of any order, a
 $17\times 17$
kernel is used in all the examples presented below, which correspond to about 58 km. The size of spatial filter for terms involving temporal derivatives is optimized for each case.
Figure 9(b) shows the velocity reconstruction along the tracer contour in figure 7(c,d) but using the noisy scalar data with noise amplitude
 $A$
equal to
 $10\,\%$
of the local temporal mean concentration across the 37 time slices (equivalent to a 2 h period, which is effectively the observation time for this example) and setting a standard deviation
 $\unicode[STIX]{x1D70E}$
equal to
 $0.01$
in the definition (4.1). The shape of the iso-contour remains almost the same as that without the noise. The kernel size for spatial filtering of terms involving the temporal derivatives is
 $30\times 30$
or, equivalently, 103 km. For these parameters, we have found the contour-averaged errors relative to the model velocities in the zonal and meridional direction to be 5.6 % and 7.8 %.
In the remote sensing of scalars, such as sea-surface temperature through satellite microwave radiometers, noise levels up to 18 % may be present (Gentemann, Meissner & Wentz Reference Gentemann, Meissner and Wentz2010). Aerial measurements of dye from multispectral and hyperspectral cameras have similar noise levels (about 20 %) for Rhodamine WT concentrations of about 20 p.p.b. (Clark et al.
Reference Clark, Lenain, Feddersen, Boss and Guza2014; Hally-Rosendahl et al.
Reference Hally-Rosendahl, Feddersen, Clark and Guza2015). Dye releases of this magnitude on spatio-temporal scales of several km and several hours have been successfully carried out both in the surf-zone (Clark et al.
Reference Clark, Lenain, Feddersen, Boss and Guza2014; Hally-Rosendahl et al.
Reference Hally-Rosendahl, Feddersen, Clark and Guza2015) and in the coastal ocean (Rypina et al.
Reference Rypina, Kirincich, Lentz and Sundermeyer2016). Figure 9(c) shows the reconstructed velocity with 20 % noise amplitude and the rest of the parameters being the same as figure 9(b). The kernel size for spatial filtering of terms involving the temporal derivatives is
 $45\times 45$
(or 155 km). The contour-averaged errors in zonal and meridional velocity for this case are 9 % and 10.8 %. The joint effect of 20 % amplitude noise and under-sampling (20 times less resolution) is shown in figure 9(d). The contour-averaged errors in the zonal and meridional velocity are 10 % and 10.5 % for this case.
The presence of second- and third-order derivatives in (2.7) would usually make our reconstruction method susceptible to noise in the data. In the example presented above, however, we find that
 $\mathit{O}((\unicode[STIX]{x2202}^{2}c/\unicode[STIX]{x2202}t\unicode[STIX]{x2202}x),(\unicode[STIX]{x2202}^{2}c/\unicode[STIX]{x2202}t\unicode[STIX]{x2202}y))\gg \mathit{O}(\unicode[STIX]{x1D707}(\unicode[STIX]{x2202}\unicode[STIX]{x1D6FB}^{2}c/\unicode[STIX]{x2202}x),\unicode[STIX]{x1D707}(\unicode[STIX]{x2202}\unicode[STIX]{x1D6FB}^{2}c/\unicode[STIX]{x2202}y))$
holds throughout the domain, so the right-hand side of (2.7) is dominated by the second- rather than the third-derivative terms. Recall that for a characteristic velocity,
 $U$
, and characteristic length scale,
 $L$
, the Péclet number for the scalar transport equation (1.1) is defined as
 $$\begin{eqnarray}Pe={\displaystyle \frac{UL}{\unicode[STIX]{x1D707}}}.\end{eqnarray}$$
Using the empirical relation between length scale
 $L$
[cm] and diffusivity
 $\unicode[STIX]{x1D707}$
[
 $\text{cm}^{2}~\text{s}^{-1}$
] obtained through synthesis from various dye release experiments in the ocean (Okubo Reference Okubo1971), we can let
 $\unicode[STIX]{x1D707}=0.0103L^{1.15}$
. Therefore, for typical velocity values,
 $U=10$
–
 $100~\text{cm}~\text{s}^{-1}$
, the Péclet number estimated for length scales,
 $L=0.5$
–10
 $^{4}$
km ranges from 61 to 2706. Evolution of tracers in flows with large Péclet numbers is advection-dominated, rendering the terms involving the third derivatives in (2.7) small. Thus, in our velocity reconstruction procedure, the sensitivity to noise would enter largely through the second derivatives in (2.7) or (2.11). Therefore, the most effort for noise suppression in the purely spatial derivatives via smoothing or filtering should be directed towards these terms.
In the noisy scalar examples presented in figure 9(b–d), the major source of error is the first-order temporal scalar gradient,
 $\unicode[STIX]{x2202}c/\unicode[STIX]{x2202}t$
. Using noisy scalar data to evaluate purely spatial derivative terms of all orders in (2.7) and using model scalar data for the temporal derivatives, we have found that an accurate velocity reconstruction (where contour average velocity errors remains less than about 10 %) can be obtained for much higher noise levels (both
 $A$
and
 $\unicode[STIX]{x1D70E}$
in (4.1)). Hence, the higher-order derivatives in the formulation of our velocity reconstruction method do not necessarily pose a challenge for accurate velocity reconstruction from noisy scalar data.
In summary, our numerical results indicate that the velocity reconstruction proposed here is of value to physical oceanography when applied to tracer fields with spatial resolution of several km, temporal resolution of minutes to hours, and noise levels of up to 20 % of the local temporal mean and a standard deviation of 0.01 for the noise model represented by (4.1). Such resolution can be achieved for airplane-mounted radars but is currently beyond the capabilities of the existing satellites that have resolution from tens to hundreds of km spatially and from days to weeks temporally.
Even though our idealized model was able to reproduce several of the major qualitative features of the real ocean circulation in the Atlantic and Pacific Oceans, a more realistic baroclinic free-surface model configuration is required in order to better simulate real oceanic conditions. We also note that because sea surface temperature and salinity are influenced by vertical mixing, air–sea interaction and precipitation/evaporation/river run off, these two tracer fields are only purely diffusive on short temporal scales. Additional challenges will arise in real ocean applications that are associated with small but non-zero horizontal divergence of surface velocity, which was exactly zero in our numerical model due to the rigid-lid approximation, the space-dependent diffusivity and the presence of higher-level non-Gaussian noise in data.
5 Conclusion
It is well established that unique velocity reconstruction from an observed scalar field is an underdetermined problem (Kelly Reference Kelly1989; Dahm et al. Reference Dahm, Su and Southerland1992). We have pointed out here, however, that if the velocity at a point is known, then the velocity field all along the scalar level curve emanating from that point can be uniquely expressed using sufficiently well-resolved observations of the scalar. In a well-mixing flow, therefore, velocities can in principle be reconstructed on global domains from highly localized velocity measurements combined with global imaging of a scalar field.
While our procedure also works with unknown scalar diffusivities, we have found in our examples the reconstruction errors
 $E_{u}$
and
 $E_{v}$
to be about an order of magnitude smaller when the diffusivity is a priori known. This is due to the numerical errors in the evaluation of higher scalar derivatives involved in the unknown diffusivity formulation (cf. (2.9) versus (2.7)). To further improve accuracy for the latter formulation, once the velocity field is recovered, a pointwise estimate for the scalar diffusivity could be obtained at each point in the domain spanned by the scalar level curves emanating from an initial curve. A subsequent statistical analysis could then establish an acceptable estimate for
 $\unicode[STIX]{x1D707}$
from these pointwise values, which would in turn enable use of the known-diffusivity formulation of our approach. Depending on accuracy requirements, this modification could even be turned into an iterative procedure, involving a gradual, simultaneous refinement of both the velocity field and the diffusivity estimate.
Extensions of our results to three-dimensional flows may be possible but remain mathematically challenging because of the lack of a general recipe for solving multi-dimensional systems of linear partial differential equations. An extension to general compressible flows appears beyond reach because incompressibility or specific form of shallow-water equations secures the common set of characteristic curves critical to our analytic solution strategy. A case with temporally constant but spatially varying density of the fluid in two dimensions will have a similar formulation as the shallow-water case.
The approach proposed here has the potential to extend spatially localized ocean velocity measurements along contours of satellite-observed tracer fields, such as temperature, salinity and ocean colour (phytoplankton) measurements. In § 4, we have provided a first proof of concept by reconstructing larger-scale velocities generated by a global circulation model, with the tracer-field output of the same model serving as observational input to our procedure. We have also demonstrated the robustness of this reconstruction under sparsification of the observed scalar field and the addition of noise that models observational inaccuracies. More work is required to investigate applicability of this method to real ocean data. Further work can build on the extension of our theory we have given in §§ 2.3–2.4 for spatially dependent diffusivities and two-dimensional-divergent but mass-conserving shallow-water velocities.
Acknowledgements
We acknowledge useful conversations with M. Holzner and L. Pratt, as well as partial funding from the Turbulent Superstructures priority program of the German National Science Foundation (DFG), and from the NASA grant no. NNX14AH29G to IR.