




1. Introduction
Wind generated near-inertial waves (NIWs) form one of the two main energy sources for the internal gravity wave field in the ocean (Alford et al. Reference Alford, MacKinnon, Simmons and Nash2016), gravitationally generated tides being the second one. Although NIWs are predominantly excited in the upper ocean, their subsequent vertical propagation and breaking assists in turbulent overturning and irreversible mixing in the deeper parts of the ocean (Munk & Wunsch Reference Munk and Wunsch1998; Alford Reference Alford2003a; Ferrari & Wunsch Reference Ferrari and Wunsch2009). Additionally, it is often hypothesized that NIWs could act as an energy sink for the geostrophic balanced flow. Suggested popular mechanisms for the dissipation of balanced energy are balanced flows interacting with bottom boundary layers (Arbic et al. Reference Arbic, Shriver, Hogan, Hurlburt, McClean, Metzger, Scott, Sen, Smedstad and Wallcraft2009; Sen, Scott & Arbic Reference Sen, Scott and Arbic2013), western boundaries (Zhai, Johnson & Marshall Reference Zhai, Johnson and Marshall2010) and topographic features (Hogg et al. Reference Hogg, Dewar, Berloff and Ward2011; Nikurashin, Vallis & Adcroft Reference Nikurashin, Vallis and Adcroft2013). Given that all these mechanisms involve the balanced flow interacting with some form of boundary, mechanisms that can lead to an energy sink for the balanced flow in the open ocean, away from all forms of boundaries, continues to be an active research direction. If NIWs can act as a balanced energy sink – a possibility that still remains a subject of debate – that would be a potential route for the loss of balanced energy away from boundaries.
Inspired by the abovementioned and related scientific motivations, a wide range of works have examined NIW-balanced flow interactions in different configurations. These include the usage of ray tracing equations and Schrödinger-like amplitude equations to capture the effects of weak waves on pre-existing frozen-in-time balanced flows (Kunze Reference Kunze1985; Young & Ben Jelloul Reference Young and Ben Jelloul1997; Balmforth, Llewellyn Smith & Young Reference Balmforth, Llewellyn Smith and Young1998; Thomas, Smith & Bühler Reference Thomas, Smith and Bühler2017; Asselin & Young Reference Asselin and Young2019), two-way coupled NIW-balanced flow models including both asymptotic (Zeitlin, Reznik & Jelloul Reference Zeitlin, Reznik and Jelloul2003; Xie & Vanneste Reference Xie and Vanneste2015; Wagner & Young Reference Wagner and Young2016; Rocha, Wagner & Young Reference Rocha, Wagner and Young2018) and non-asymptotic (Gertz & Straub Reference Gertz and Straub2009; Thomas & Arun Reference Thomas and Arun2020) reduced models, studies focusing on NIW-front interactions (Grisouard & Thomas Reference Grisouard and Thomas2015; Whitt & Thomas Reference Whitt and Thomas2015; Shakespeare & Hogg Reference Shakespeare and Hogg2018; Thomas Reference Thomas2019) and studies examining interactions in the high-Rossby-number regimes (Taylor & Straub Reference Taylor and Straub2016; Barkan, Winters & McWilliams Reference Barkan, Winters and McWilliams2017).
On examining oceanic observational data sets that have been collected over the past few decades, significant geographic and seasonal variability is seen to be associated with the strength of geostrophic balanced energy (Stammer Reference Stammer1997; Wunsch & Stammer Reference Wunsch and Stammer1998; Wortham & Wunsch Reference Wortham and Wunsch2014) and NIW energy (D'Asaro et al. Reference D'Asaro, Eriksen, Levine, Niiler, Paulson and van Meurs1995; Alford Reference Alford2003b; Alford & Whitmont Reference Alford and Whitmont2007; Chaigneau, Pizarro & Rojas Reference Chaigneau, Pizarro and Rojas2008; Silverthorne & Toole Reference Silverthorne and Toole2009). These data sets point out that NIW energy can be comparable or sometimes even exceed balanced flow energy. In spite of several NIW-balanced flow investigations having been carried out in different configurations, the wave-balance energy transfer directions and its dependence on the relative strengths of the NIW field and balanced flow remain unresolved in the small-Rossby-number regime. Additionally, a clear understanding of the effects the geostrophic energy level has on the dynamics of NIWs is still lacking.
The abovementioned questions form the primary inspiration for the present work. We explore turbulent interactions between NIWs and balanced flows in different balance-to-wave energy regimes using numerical integration of the non-hydrostatic Boussinesq equations. Throughout this work we take an initial value problem approach, i.e. we assume that wind excited NIWs with large horizontal scales have been generated in the upper ocean, on top of pre-existing geostrophic balanced flow. We examine the subsequent evolution of wave and balanced fields in different regimes by varying the initial balance-to-wave energy ratio. Using such an initial value problem approach, we explore the effect of balanced flows of different strengths on the vertical propagation and dissipation of NIWs, the energy transfers between the two fields and the effect of increasing wave energy levels on the balanced flow. Based on the results of our numerical experiments we develop conceptual diagrams illustrating NIW-balanced flow turbulent interactions and the energy flow pathways between fields and across spatial scales in different parameter regimes.
The plan for this paper is as follows: we present the governing equations, their non-dimensionalization, and the wave-balance decomposition in § 2, discuss results based on numerical experiments and present detailed energy flow pathways in § 3, and conclude with conceptual diagrams for turbulence phenomenology in different regimes in § 4.
2. Governing equations
The Boussinesq equations that govern the dynamics of a rotating and stratified fluid are
 \begin{gather} \frac{\partial{\boldsymbol{v}}}{\partial{t}} + \boldsymbol{f} \times \boldsymbol{v} + \boldsymbol{\nabla} p + \boldsymbol{v} \boldsymbol{\cdot} \boldsymbol{\nabla} \boldsymbol{v} + w \frac{\partial{\boldsymbol{v}}}{\partial{z}} = 0, \end{gather}
 \begin{gather} \frac{\partial{w}}{\partial{t}} + \frac{\partial{p}}{\partial{z}} - b + \boldsymbol{v} \boldsymbol{\cdot} \boldsymbol{\nabla} w + w \frac{\partial{w}}{\partial{z}} = 0, \end{gather}
 \begin{gather} \frac{\partial{b}}{\partial{t}} + N^{2} w + \boldsymbol{v} \boldsymbol{\cdot} \boldsymbol{\nabla} b + w \frac{\partial{b}}{\partial{z}} = 0, \end{gather}
 \begin{gather} \boldsymbol{\nabla} \boldsymbol{\cdot} \boldsymbol{v} + \frac{\partial{w}}{\partial{z}} =0, \end{gather}
where  $\boldsymbol {v} = (u,v)$ is the horizontal velocity,
 $w$ is the vertical velocity,
 $b$ is the buoyancy,
 $f$ and
 $N$ are the constant frequencies associated with rotation and stratification of the fluid and
 $\boldsymbol {\nabla } = \hat {x} \partial /\partial x + \hat {y} \partial /\partial y$. We non-dimensionalize (2.1) using the scaling
 \begin{align}
\left.\begin{aligned} t \rightarrow t/f, \quad \boldsymbol{x} & \rightarrow L_D \boldsymbol{x}, \quad z \rightarrow H z, \quad \boldsymbol{v} \rightarrow U \boldsymbol{v}, \quad w \rightarrow (H U/L_D) w,\nonumber\\
p & \rightarrow (\,fUL_D) p, \quad b \rightarrow (\,fUL_D/H) b. \end{aligned}\right\} \end{align}
In the above scaling, the inertial frequency  $f$ was used to scale time while the vertical length scale was chosen as the depth of the domain,
 $H$. We chose the horizontal length scale to be the deformation scale,
 $L_D = N H /f$. Horizontal velocity was scaled using an arbitrary velocity scale,
 $U$, which may be thought of as an estimate for the magnitude of maximum value of initial flow velocity in our freely evolving simulations. The scale for vertical velocity,
 $HU/L_D$, was chosen to satisfy continuity equation (2.1d). The scale for pressure was chosen such that the horizontal pressure gradient (
 $\boldsymbol {\nabla } p$) was of the same order as the Coriolis term (
 $\,\boldsymbol {f} \times \boldsymbol {v}$). Finally, the scale for buoyancy was obtained by setting the vertical pressure gradient (
 $\partial p/ \partial z$) to be of the same order as buoyancy (
 $b$).
Scaling (2.1) using (2.2) gives us the non-dimensional equations:
 \begin{gather} \frac{\partial{\boldsymbol{v}}}{\partial{t}} + \boldsymbol{\hat{z}} \times \boldsymbol{v} + \boldsymbol{\nabla} p + Ro \left( \boldsymbol{v} \boldsymbol{\cdot} \boldsymbol{\nabla} \boldsymbol{v} + w \frac{\partial{\boldsymbol{v}}}{\partial{z}} \right) = 0, \end{gather}
 \begin{gather} \frac{\partial{w}}{\partial{t}} + \alpha^{2} \left( \frac{\partial{p}}{\partial{z}} - b \right) + Ro \left( \boldsymbol{v} \boldsymbol{\cdot} \boldsymbol{\nabla} w + w \frac{\partial{w}}{\partial{z}} \right) = 0, \end{gather}
 \begin{gather} \frac{\partial{b}}{\partial{t}} + w + Ro \left( \boldsymbol{v} \boldsymbol{\cdot} \boldsymbol{\nabla} b + w \frac{\partial{b}}{\partial{z}} \right) = 0, \end{gather}
 \begin{gather} \boldsymbol{\nabla} \boldsymbol{\cdot} \boldsymbol{v} + \frac{\partial{w}}{\partial{z}} =0. \end{gather}
In the above non-dimensional equations  $Ro=U/fL_D$ is the Rossby number and
 $\alpha =N/f$. Our study will focus on wave-balance interactions using (2.3) in the regime
 $Ro \ll 1$.
2.1. The wave-balance decomposition
Setting  $Ro=0$ in (2.3), we get the linear equations:
 \begin{gather} \frac{\partial{\boldsymbol{v}}}{\partial{t}} + \boldsymbol{\hat{z}} \times \boldsymbol{v} + \boldsymbol{\nabla} p = 0, \end{gather}
 \begin{gather} \frac{\partial{w}}{\partial{t}} + \alpha^{2} \left( \frac{\partial{p}}{\partial{z}} - b \right) = 0, \end{gather}
 \begin{gather} \frac{\partial{b}}{\partial{t}} + w = 0, \end{gather}
 \begin{gather} \boldsymbol{\nabla} \boldsymbol{\cdot} \boldsymbol{v} + \frac{\partial{w}}{\partial{z}} =0. \end{gather}
The linear equations can be used to decompose the fields into internal gravity waves (denoted with subscript  $W$ below) and a part that is in geostrophic balance (denoted with subscript
 $G$ below). The wave fields satisfy
 \begin{gather} \frac{\partial{ {{{ \boldsymbol{v}}}_{{W}}} }}{\partial{t}} + \boldsymbol{\hat{z}} \times {{{ \boldsymbol{v}}}_{{W}}} + \boldsymbol{\nabla} {{{p}}_{{W}}} = 0, \end{gather}
 \begin{gather} \frac{\partial{{{{w}}_{{W}}}}}{\partial{t}} + \alpha^{2} \left( \frac{\partial{{{{p}}_{{W}}}}}{\partial{z}} - {{{b}}_{{W}}} \right) = 0, \end{gather}
 \begin{gather} \frac{\partial{{{{b}}_{{W}}}}}{\partial{t}} + {{{w}}_{{W}}} = 0, \end{gather}
 \begin{gather} \boldsymbol{\nabla} \boldsymbol{\cdot} {{{ \boldsymbol{v}}}_{{W}}} + \frac{\partial{{{{w}}_{{W}}}}}{\partial{z}} =0 \end{gather}
and the balanced flow satisfies
 \begin{gather} \boldsymbol{\hat{z}} \times {{{ \boldsymbol{v}}}_{{G}}} + \boldsymbol{\nabla} {{{p}}_{{G}}} = 0, \end{gather}
 \begin{gather} \frac{\partial{{{{p}}_{{G}}}}}{\partial{z}} - {{{b}}_{{G}}} = 0, \end{gather}
 \begin{gather} {{{w}}_{{G}}}=0, \end{gather}
 \begin{gather} \boldsymbol{\nabla} \boldsymbol{\cdot} {{{ \boldsymbol{v}}}_{{G}}} =0. \end{gather}
The linear wave-balance decomposition given above provides us with a balanced field that is exactly in geostrophic balance while linear internal gravity waves form the flow field that is orthogonal to the balanced field such that the total energy is the sum of these two quantities, i.e.  $E={{{{E}}_{{G}}}} + {E}_{W}$, where
 $E$,
 ${{{{E}}_{{G}}}}$ and
 ${E}_{W}$ denotes total, balanced and wave energies, respectively. We will use this orthogonal decomposition to analyse wave-balance energy exchanges in this work (we refer the reader to appendix A for specific details on spectral implementation of the decomposition).
3. Results
Our investigation was based on numerical integration of (2.3) in a domain  $(x, y) \in [0, 2 {\rm \pi}]^{2}, z \in [-{\rm \pi} , 0]$ with periodic boundary conditions in the
 $x$ and
 $y$ directions and with rigid lids on the top and bottom, i.e. velocity boundary conditions on top (
 $z=0$) and bottom (
 $z=-{\rm \pi}$) were free slip for
 $\boldsymbol {v}$ and impenetrability for
 $w$. The simulations were performed using a dealiased pseudospectral code with
 $384^{3}$ grid points. We used
 $\alpha =20$ and
 $Ro=0.1$ for the numerical experiments reported below, although we found that the qualitative phenomenology and energy transfer directions were similar in neighbouring regimes. Hyperdissipation terms of the form
 $\nu {\rm \Delta} _{3D}^{8} \boldsymbol {v}$,
 $\nu {\rm \Delta} _{3D}^{8} w$ and
 $\nu {\rm \Delta} _{3D}^{8} b$, where
 ${\rm \Delta} _{3D}= \partial ^{2}/\partial x^{2} + \partial ^{2}/\partial y^{2} + \partial ^{2}/\partial z^{2}$, were added to the right-hand sides of (2.3a), (2.3b) and (2.3c) to dissipate energy reaching grid scale and to increase the range of inviscid scales we resolve. Based on multiple iterative simulations, we set hyperviscosity values ranging from
 $\nu = 10^{-29}$ to
 $\nu = 10^{-31}$ for different parameter regimes.
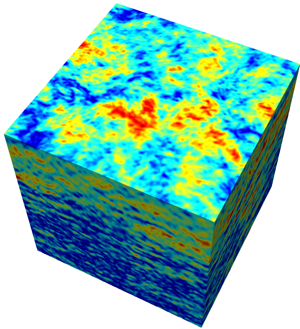
Prior to our wave-balance interaction experiments, we first simulated (2.3) with purely balanced initial conditions for long enough so as to get a matured turbulent geostrophic flow field. Specifically, we simulated (2.3) initializing only the geostrophic balanced field at low wavenumbers,  $k \leq 6$, with random numbers assigned to each wavenumber. An example final state of such a balance-only initialized simulation with
 ${{{{E}}_{{G}}}}(t=0) = 1$ is shown in figure 1
 $(a)$. Observe the presence of large domain scale vortices. Figure 1
 $(b)$ shows the time evolution of balanced energy for this particular simulation. Overall we find that in this experiment, that lasted several thousand eddy turn over time scales, less than
 $1\,\%$ of the balanced energy was dissipated by final time. Figures 1
 $(c)$ and 1
 $(d)$ show the horizontal and vertical energy spectra of balanced flows and wave fields at the final time. Although the initial condition was purely in geostrophic balance, weak waves are generated as the flow evolves. Nevertheless, these weak waves and other ageostrophic contributions remain insignificant, as seen in the energy spectra in figures 1
 $(c)$ and 1
 $(d)$ showing wave energy spectrum being several orders of magnitude below balanced flow's spectrum.
Panel  $(a)$ shows geostrophic vorticity
 ${{{\zeta }}_{{G}}}$ at
 $t=4000$. The top surface in the figure is the horizontal plane
 $z=-h$, where
 $h={\rm \pi} /100$. Panel
 $(b)$ shows the time series of the fractional change in balanced energy,
 $({{{{E}}_{{G}}}}(t) - E(0))/{{{{E}}_{{G}}}}(0)$. Panel
 $(c)$ shows the horizontal energy spectra
 $\hat {E}( k_h)$ of the wave and balanced flow on the horizontal plane
 $z=-h$ at
 $t=4000$. Finally, panel
 $(d)$ shows the vertical energy spectrum of the horizontally averaged energy
 $\hat {E}( k_z)$ associated with the wave and balanced flow at
 $t=4000$. The spectral slopes shown above were calculated based on a best fit in the range
 $k=10\text{--}50$.

We used simulations such as those described above to get matured turbulent geostrophic flow fields with energy values of our choice. On top of this balanced flow we added NIWs with specific energy levels. We initialized NIWs by setting  ${{{u}}_{{W}}} = A(z), \ {{{v}}_{{W}}} = {{{w}}_{{W}}} = {{{b}}_{{W}}}=0$, where
 $A(z) = c_0 \exp (- z^{2}/2 h^{2})$,
 $c_0$ being a constant which was chosen such that the wave energy
 ${E}_{W}$ had a specific initial value for each experiment and
 $z=-h$ is the location where inertial shear,
 $\textrm {d} A/\textrm {d} z$, is maximum (for the specific experiments discussed below, we set
 $h={\rm \pi} /100$). This initial condition, which is homogeneous in horizontal space to mimic large scales of the wave field, will generate inertial oscillations as
 ${{{u}}_{{W}}} + \textrm {i} {{{v}}_{{W}}} = A(z) \exp (-\textrm {i}t), \ {{{w}}_{{W}}} = {{{b}}_{{W}}}= {{{p}}_{{W}}} = 0$, which is an exact solution of the linear wave equations given in (2.5). Furthermore, this horizontally homogeneous inertial oscillation by itself (i.e. in the absence of a balanced flow) satisfy the full set of nonlinear equations (2.3) exactly. Therefore, horizontally homogeneous pure inertial oscillations will retain their state and remain confined to the upper ocean in the absence of a balanced flow.
We integrated (2.3) with the initial conditions being a combination of NIWs and balanced flow as discussed above and, based on our exploratory simulations, we will present three cases in detail and then briefly discuss the changes in neighbouring regimes at the end of this section. The first regime we will examine corresponds to the case where wave and balanced energies have comparable strengths. We identify this as the comparable wave (CW) regime and initialized the flow with  ${E}_{W} = {{{{E}}_{{G}}}} = 1$ so that
 ${ ( {{{{E}}_{{G}}}}/ {E}_{W} ) }_{t=0}=1$. The second regime we will focus on was initialized with
 ${E}_{W} = 1$,
 ${{{{E}}_{{G}}}} = Ro^{2}$ so that
 ${ ( {{{{E}}_{{G}}}}/ {E}_{W} ) }_{t=0} = Ro^{2}$ and will be identified as the strong wave (SW) regime in this work. Finally, for the purposes of comparison, we examine a regime where the balanced flow was not initialized, i.e.
 ${E}_{W} = 1$,
 ${{{{E}}_{{G}}}} = 0$ resulting in
 ${ ( {{{{E}}_{{G}}}}/ {E}_{W} ) }_{t=0} = 0$ and we identify this as the only wave (OW) regime.
For the three regimes described above, figures 2 $(a{,}c{,}e)$ and 2
 $(b{,}d{,}f)$ show the spatial structure of geostrophic vorticity
 ${{{\zeta }}_{{G}}}$ and the waves’ speed
 ${U}_{W} = \sqrt { u_{{W} }^{2} + v_{{W} }^{2}}$, respectively. Figures 2
 $(a{,}b)$, 2
 $(c{,}d)$ and 2
 $(e{,}f)$ correspond to the CW, SW and OW regimes, respectively. In the CW regime we found that the balanced vortices continued to merge and become larger, similar to the phenomenology expected in quasi-geostrophic turbulence. A snapshot of such a state is shown in figure 2
 $(a)$. Although NIWs are initially homogeneous in the horizontal direction and are confined to the upper ocean, the balanced flow imprints its spatial scales on the wave field. Consequently, the wave field acquires small scales and propagates vertically. Figure 2
 $(b)$ shows the spatial structure of the wave speed at the same time as figure 2
 $(a)$. Observe that the wave field consists of small scales and is spread across the whole ocean depth. Therefore, the CW regime is characterized by waves developing small scales and rapidly propagating in the vertical direction.
Physical fields in the three regimes at  $t=2000$. Panels
 $(a{,}b)$,
 $(c{,}d)$ and
 $(e{,}f)$ show CW, SW and OW regimes, respectively. Panels
 $(a),(c)$ and
 $(e)$ show geostrophic vorticity while
 $(b)$, (d) and
 $(\,f)$ show wave speed. In all cases the top surface is the plane
 $z=-h$.

When contrasted with the CW regime, we find significant differences in the SW regime shown in figures 2(c) and 2(d). At early times we observed that the interaction with waves resulted in breaking up of vortices, generating a wide range of small-scale structures in the balanced flow. Qualitatively similar turbulence phenomenology characterized by waves breaking up vortices was seen in the two-dimensional experiments described in Thomas & Yamada (Reference Thomas and Yamada2019) and Thomas & Arun (Reference Thomas and Arun2020). In our experiments in the SW regime, although waves facilitated the generation of small-scale features in the balanced flow, the small-scale vortices were seen to gradually merge. Such an intermediate state of the balanced flow is shown in figure 2 $(c)$. Note the small-scale structures and the vortices showing tendencies to merge. In comparison to the CW regime, the wave field in the SW regime is relatively less modulated by the balanced flow. As seen in figure 2
 $(d)$ showing the spatial structure of waves, the inhomogeneities in the NIW field is much less in this regime relative to the CW regime, in addition to a weaker vertical propagation of waves.
Finally, figures 2 $(e)$ and 2
 $(f)$ show the OW case. The balanced flow, which was not initialized in this case, remains zero at all times as can be seen in figure 2
 $(e)$ showing geostrophic vorticity. Additionally, the wave field remains as horizontally homogeneous inertial oscillations with no vertical propagation (figure 2
 $f$). As pointed out earlier, spatially homogeneous inertial oscillations, in the absence of a geostrophic flow, is an exact solution of the full Boussinesq equations (2.3). We included figures 2
 $(e)$ and 2
 $(f)$ above to demonstrate that the numerical integration retains features of exact solutions of the Boussinesq equations (apart from a small amount of wave energy being lost to small-scale viscous dissipation in the OW regime) and to emphasis the stark contrast in wave and balanced fields seen in figures 2
 $(a)$–2
 $(\,f)$.
We complement the three-dimensional wave speed plots shown in figures 2 $(b)$, 2
 $(d)$ and 2
 $(\,f)$ with figure 3
 $(a)$ that shows the vertical structure of horizontally averaged wave kinetic energy at
 $t=2000$. Note that the wave field in the OW case retains its initial structure, and remains confined to the upper ocean (as inferred from figure 2
 $f$), while the SW case shows some vertical propagation leading to a decrease in the magnitude of wave energy in the upper ocean relative to the OW case. On the other hand, the CW case shown in figure 3
 $(a)$ is seen to have relatively negligible energy in the upper ocean, concomitant with the rapid vertical propagation seen in figure 2
 $(b)$. A further detail associated with wave energy is given in figure 3
 $(b)$, which shows the time evolution of wave kinetic energy contained in the horizontally homogeneous mode
 $k_h = 0$. Recall that the wave field in all regimes were initialized as pure inertial oscillations, with energy only in the
 $k_h = 0$ mode. Therefore, figure 3
 $(b)$ shows how the energy in pure inertial oscillations changes with time. Note that the OW case shows only a minor drop in energy, this energy drop being due to viscous dissipation at small vertical scales. The wave field in this case retains its initial features and remains as horizontally homogeneous inertial oscillations. The SW case on the other hand is seen to exhibit much more loss in inertial oscillations energy, primarily due to energy conversion to horizontally inhomogeneous NIWs – a mechanism that is absent in the OW case. On a relative comparison, most efficient conversion of energy from pure inertial oscillation mode
 $k_h = 0$ to inhomogeneous wave modes
 $k_h \neq 0$ is seen in figure 3
 $(b)$ to take place in the CW regime.
Panel  $(a)$ shows the vertical structure of horizontally averaged wave kinetic energy in the top one-tenth of the domain at
 $t=2000$, the same time corresponding to the physical plots of the wave field shown in figure 2
 $(b{,}d{,}f)$. Panel
 $(b)$ shows the time evolution of kinetic energy of inertial oscillations, i.e. the horizontally homogeneous Fourier mode, in all three regimes.

Our comparison of the CW and SW regimes with the OW regime above highlights the dominant role the strength of the balanced flow has on NIWs. The OW regime with  ${ ( {{{{E}}_{{G}}}}/ {E}_{W} ) }_{t=0} = 0$ is characterized by NIWs retaining their initial features, being confined to the upper ocean and remaining spatially homogeneous. Except for a small amount of viscous dissipation, the wave field in the OW regime remains as pure inertial oscillations. The SW regime with
 ${ ( {{{{E}}_{{G}}}}/ {E}_{W} ) }_{t=0} = Ro^{2}$ was seen to have waves becoming horizontally inhomogeneous and propagating vertically to a certain extent. Finally, the most extreme effects of balanced flow on waves were seen in the CW regime with
 ${ ( {{{{E}}_{{G}}}}/ {E}_{W} ) }_{t=0} = 1$, where the wave field acquired smaller horizontal scales and exhibited significant vertical propagation to ocean depths. Since all these regimes were initialized with the same wave energy, their inter-comparison reveals that stronger balanced flow leads to higher modulation of NIWs.
To further analyse these cases, we examined the frequency and energy spectra of the wave field in the three regimes at different times. Figure 4 $(a)$ shows a typical frequency spectra of
 ${{{u}}_{{W}}}$ on the plane
 $z=-h$ corresponding to
 $t=2000$. The frequency spectra were obtained by ensemble averaging the frequency spectra obtained from 20 arbitrarily chosen spatial locations. Frequency spectrum associated with each specific point in the domain was computed using a time series of
 ${{{u}}_{{W}}}$ in a time interval centred at
 $t=2000$. Observe that the wave field remains purely inertial in the OW regime (blue curve), while some higher harmonics are generated in the SW regime (notice the frequencies
 $\omega =2, 3, 4$ seen in the black curve). In contrast, relatively much more broadening of the frequency spectrum is seen in the CW regime (see the red curve). The excitation of higher harmonics, vertical propagation and subsequent dissipation (which will be discussed in detail below) of the wave field is also seen to decrease the energy content in the inertial peak in the CW case, relative to the SW and OW cases (note that the inertial peak of the red curve in figure 4
 $(a)$ is much lower than the blue and black curves). To complement our frequency spectra analysis, figure 4
 $(b)$ shows the waves’ energy spectra at
 $t=2000$ and
 $t=4000$ on the same plane,
 $z=-h$, where the frequency spectra were computed. We find that the waves’ spectrum is much shallower in the CW regime relative to the SW regime, reflecting the prominence of small-scale wave features in the CW regime.
Panel  $(a)$ shows the frequency spectra of
 ${{{u}}_{{W}}}$. Dashed horizontal lines in the figure are added to indicate the inertial peak in the three regimes. Panel
 $(b)$ shows the waves’ energy spectra on the plane
 $z=-h$, with the solid lines being at
 $t=2000$ and the discontinuous lines being at
 $t=4000$. The spectra remain around
 $k_h^{-1.6}$ in the CW regime and
 $k_h^{-4.3}$ in the SW regime (calculated based on a best fit in the range
 $k_h=10\text {--}50$). The lack of horizontal scales for waves in the OW regime results in the energy spectrum collapsing to a single point (blue dot) in this regime.

Since wave energy decreases due to dissipation at small scales in our freely evolving experiments (the exact amounts to be quantified below), we observed that the magnitudes of frequency and energy content seen in figures 4 $(a)$ and 4
 $(b)$ were higher at earlier times and lower at late times. This can be seen in the energy spectra of the CW and SW regimes shown in figure 4
 $(b)$ – note the drop in wave energy at
 $t=4000$ compared to
 $t=2000$. Consequently, the reader is reminded that figure 4 primarily serves as an intercomparison between the three regimes. Overall higher energy content at small spatial scales and at higher harmonics was seen to be associated with the wave field in the CW regime, compared to the SW regime. On examining energy spectra of balanced flows (figures omitted), we found that spectral slopes ranged from
 $k_h^{-3}$ to
 $k_h^{-4}$ in both the CW and SW regimes at early times. As the balanced flow evolved leading to vortex mergers and large-scale coherent structure formation, we observed that spectral slopes became steeper.
The NIWs are often seen to have an affinity for anticyclonic mesoscale eddies, based on in situ oceanic observations and large-scale ocean model simulations (Lee & Niiler Reference Lee and Niiler1998; Zhai, Greatbatch & Eden Reference Zhai, Greatbatch and Eden2007; Danioux, Klein & Riviere Reference Danioux, Klein and Riviere2008; Elipot, Lumpkin & Prieto Reference Elipot, Lumpkin and Prieto2010; Joyce et al. Reference Joyce, Toole, Klein and Thomas2013) and explanations for this have been proposed based on multiple reduced models in the past (see discussions in Kunze Reference Kunze1985; Balmforth et al. Reference Balmforth, Llewellyn Smith and Young1998; Danioux, Vanneste & Bühler Reference Danioux, Vanneste and Bühler2015; Thomas et al. Reference Thomas, Smith and Bühler2017). To examine affinity of NIWs towards anticyclonic geostrophic fields, we computed the correlation  $R$ defined as
 \begin{equation} R= \frac{ \left \langle {{{\zeta}}_{{G}}} { E }_{W} \right \rangle }{ \sqrt{ \left \langle \zeta_{G}^{2} \right \rangle \left \langle { { E }_{W}^{2} } \right \rangle } }, \end{equation}
where  ${{{\zeta }}_{{G}}}$ is the geostrophic vorticity,
 ${ E }_{W}$ is the wave energy and angle brackets denote spatial integration over the whole domain. Figure 5
 $(a)$ shows the time series of
 $R$; observe that
 $R$ is negative in both CW and SW regimes, implying the affinity of NIWs for anticyclonic vorticity regions. We also note that
 $R$ attains much lower values in the CW regime than in the SW regime. This feature is primarily due to the higher amount of energy retained in pure inertial oscillations in the SW regime when compared with the CW regime, as seen in figure 3
 $(b)$. We therefore recomputed
 $R$ using the wave field obtained by removing the horizontally homogeneous inertial oscillation mode. In other words, we subtracted the horizontally homogeneous wave mode from the wave field, and computed the energy associated with the horizontally inhomogeneous wave field so obtained and used that to compute
 $R$. This modified
 $R$ is plotted in figure 5
 $(b)$. Notice that both CW and SW regimes now show more or less comparable magnitudes for
 $R$, indicating that spatially inhomogeneous NIWs are indeed strongly correlated with anticyclonic regions of geostrophic vorticity.
Panel  $(a)$ shows the time series of
 $R$ defined in (3.1) to quantify the affinity of NIWs for anticyclonic vorticity regions. Panel
 $(b)$ shows the time series of
 $R$ computed after removing horizontally homogeneous inertial oscillations from the wave field.

We follow up our examination of the spatial fields, energy and frequency spectra with an estimation of the direction and magnitudes of wave-balance energy exchanges in the CW and SW regimes (we leave out the OW regime where the balanced flow remained zero throughout). To examine the wave-balance energy exchanges, we apply the linear wave-balance decomposition to the governing equations (2.3). This gives us the energy evolution equations for balance ( $G$) and wave (
 $W$) modes in spectral space as (see appendix B for more details on deriving spectral energy exchange equations):
 \begin{gather} \frac{\partial{ {{{{\hat{E} }}_{{G}}}} ( k, t) }}{\partial{t}} = \hat{T}_{{GGG} }( k, t) + \hat{T}_{{GWW} } ( k, t) + \hat{T}_{{GGW} } ( k, t) - \hat{D}_{G} ( k, t), \end{gather}
 \begin{gather} \frac{\partial{ { \hat{E} }_{W} ( k, t) }}{\partial{t}} = \hat{T}_{ { WWW } } ( k, t) + \hat{T}_{ {WGW} } ( k, t) + \hat{T}_{ {WGG} } ( k, t) - \hat{D}_{W} ( k, t). \end{gather}
Above  ${{{{\hat{E} }}_{{G}}}} ( k, t)$ and
 ${\hat{E}}_{W} ( k, t)$ refer to balanced and wave energies, respectively, the
 $\hat {T} ( k, t)$ terms represent different triadic interactions between wave and balanced modes, and
 $\hat {D} ( k, t)$ represent dissipation, all corresponding to a certain wavenumber
 $k=\sqrt {k_x^{2} + k_y^{2} + k_z^{2}}$. We will first examine the spectral fluxes to identify the directions of energy flow across scales of wave and balanced modes. We sum the terms in (3.2) from the largest wavenumber
 $k=k_{{max}}$ to an arbitrary wavenumber
 $k=k$ to get the energy flux equations in spectral space as
 \begin{gather} \frac{\partial{ \hat{{\hat{E}}}_{{G} } (k, t) }}{\partial{t}} = \underbrace{ \Pi_{{GGG} }(k, t) + \Pi_{{GWW} } (k, t) + \Pi_{{GGW} } (k, t) }_{\Pi_{{G} }} - \hat{{\hat{D}}}_{{G} } (k, t), \end{gather}
 \begin{gather} \frac{\partial{ \hat{{\hat{E}}}_{{W} } (k, t) }}{\partial{t}} = \underbrace{ \Pi_{{WWW} } (k, t) + \Pi_{{WGW} } (k, t) + \Pi_{{WGG} } (k, t) }_{\Pi_{{W} }} - \hat{{\hat{D}}}_{{W} } (k, t). \end{gather}
Above  $\hat {{\hat {E}}}_{{G} } (k, t)$ and
 $\hat {{\hat {E}}}_{{W} } (k, t)$ represent balance and wave energies contained in the spectral band
 $[k, k_{{max}}]$. The triadic terms on the right-hand side of (3.3) gives the respective spectral fluxes:
 $\Pi _{{G} }$ for the balanced flow and
 $\Pi _{{W} }$ for the waves. Note that the total geostrophic flux,
 $\Pi _{{G} }$ in (3.3a), has been decomposed into different triadic contributions such as triadic balanced flow alone (
 $\Pi _{{GGG} }$), balance-wave-wave triads (
 $\Pi _{{GWW} }$) and balance-balance-wave triads (
 $\Pi _{{GGW} }$). Similarly, the decomposition of total wave flux
 $\Pi _{{W}}$ into individual triads is given in (3.3b). Finally,
 $\hat {{\hat {D}}}_{{G} } (k, t)$ and
 $\hat {{\hat {D}}}_{{W} } (k, t)$ in (3.3) indicate balance and wave energy dissipation within the spectral band
 $[k, k_{{max}}]$.
Figures 6 $(a{,}c)$ and 6
 $(b{,}d)$ show the spectral fluxes for the CW regime and the SW regime, respectively, corresponding to a specific time. The fluxes were computed using (3.3) and time-averaged in the interval
 $t=2000-\delta$ to
 $t=2000+\delta$ (with
 $\delta$ being chosen to match a few eddy turn over time scales) so as to remove fast-time fluctuations. On examining the waves’ fluxes shown in figures 6
 $(a)$ and 6
 $(b)$, we find that
 $\Pi _{{W} }$ is positive in both cases with significant contributions from
 $\Pi _{{WWW} }$ and
 $\Pi _{{WGW} }$. Waves therefore exhibit a forward energy flux, caused by triadic wave interactions (
 $WWW$) and wave-balance interactions (
 $WGW$). We also observe that
 $\Pi _{{WGW} }$ has a higher contribution than
 $\Pi _{{WWW} }$ to the total waves’ flux
 $\Pi _{{W} }$ in the CW regime, while the magnitudes of
 $\Pi _{{WGW} }$ and
 $\Pi _{{WWW} }$ are more or less comparable in the SW regime. The balanced flow therefore plays a major role in facilitating the forward flux of the waves’ energy, as expected based on our examination of physical fields in figure 2. On examining the balanced flows’ fluxes in the bottom row of figure 6, we find that in the CW regime shown in figure 6
 $(c)$, triadic balanced interactions make up most of the balanced energy flux, which is negative, i.e.
 $\Pi _{{G} } \sim \Pi _{{GGG} } < 0$. Other fluxes being weak, this leads to an inverse energy flux for the balanced flow, resulting in the formation of larger vortices with time as seen in figure 2
 $(a)$. On examining balanced energy flux in the SW regime shown in figure 6
 $(d)$, we find that
 $\Pi _{{G} } \sim \Pi _{{GGG} } < 0$ at large scales, although wave induced effects lead to a non-negligible positive flux at small scales; observe that
 $\Pi _{{G} } > 0$ for high wavenumbers, while
 $\Pi _{{GGG} }$ is negligible at these scales. Waves therefore facilitate a forward flux and dissipation of a fraction of the balanced energy in the SW regime (the exact amounts will be quantified below).
Spectral energy fluxes corresponding to  $t=2000$ for CW
 $(a{,}c)$ and SW
 $(b{,}d)$ calculated based on (3.3).

We note that spectral fluxes shown in figure 6 correspond to a specific time  $t=2000$. Similar to the energy spectra shown in figure 4(b), the absolute magnitudes of spectral fluxes decreases with time in our freely evolving experiments, although the qualitative phenomenology described above was observed at all times we checked. Specifically, in the CW regime balanced flow plays a major role in the forward flux of wave energy, an effect which is weaker in the SW regime. The balanced flow on the other hand exhibits an inverse energy flux in both regimes, concomitant with vortex mergers and large-scale vortex formation seen in physical space. Additionally, waves induce a weak forward flux leading to the dissipation of a small fraction of balanced energy in the SW regime.
We next examine the energy budgets of wave and balanced fields with an eye on the net energy exchange between the two fields. We form the energy transfer equations by summing the terms in (3.2) from  $k=k_{{max}}$ to
 $k=0$ to get the total energy change associated with each specific term. Additionally, we integrate in time each term thus obtained from 0 to
 $t$ to get net energy change equations as
 \begin{gather} {\rm \Delta} {{{{E}}_{{G}}}} (t)= {{{{E}}_{{G}}}} (t) - {{{{E}}_{{G}}}} (0) = \underbrace{ E_{ {GWW} } (t) + E_{ {GGW} } (t) }_{ E^{triads}_{ {G} } } - {{{{D}}_{{G}}}} (t), \end{gather}
 \begin{gather} {\rm \Delta} {E}_{W} (t)= {E}_{W} (t) - {E}_{W} (0) = \underbrace{ E_{ {WGW} } (t) + E_{ {WGG} } (t) }_{ E^{triads}_{ {W} } } - {D}_{W} (t). \end{gather}
Since triadic self-interactions between balanced modes and waves cannot transfer net energy within the  $G$ and
 $W$ modes,
 $GGG$ and
 $WWW$ terms do not appear above. Furthermore, since triadic interactions of a similar kind conserve energy, we have
 $E_{{GWW}} (t) + E_{{WGW}} (t) = 0$ and
 $E_{{GGW}} (t) + E_{{WGG}} (t) = 0$. Figures 7(a,c,e) and 7(b,d,f) show the time series of different terms in (3.4) for the CW regime and SW regime, respectively.
Energy transfers in CW ( $a{,}c{,}e$) and SW (
 $b{,}d{,}f$) regimes computed based on (3.4).

On examining figure 7 $(a)$ showing the triads involved in energy exchange in the CW regime, we find that waves gain energy from the balanced flow primarily via the
 $E_{ {WGW} }$ triads, while the balanced flow loses an equal amount of energy via the
 $E_{ {GWW} }$ triads. The balanced energy budget given in figure 7
 $(c)$ based on (3.4a) shows that in addition to direct energy extraction by waves via the triadic interactions noted above, waves facilitate dissipation of the balanced flow. By the end of our experiment at
 $t=4000$, we find that the balanced flow loses about
 $10.4\,\%$ of its energy, with
 $2.4\,\%$ being due to dissipation at small scales and
 $8\,\%$ being direct extraction by waves. Figure 7
 $(e)$ showing the waves energy budget based on (3.4b) reveals that although direct extraction of balanced energy increases wave energy by
 $8\,\%$, approximately
 $70\,\%$ of wave energy is dissipated at small scales. As a result,
 $62\,\%$ of wave energy is lost by the end of our simulation. The gradual drop in wave energy makes balanced energy extraction by waves inefficient as time progresses.
The time series of triads involved in energy exchange in the SW regime, shown in figure 7 $(b)$, exhibit an exact opposite behaviour to that seen in the CW regime discussed above. We find that waves lose energy to the balanced flow primarily via the
 $E_{ {WGW} }$ triads, while the balanced flow gains energy via the equal and opposite
 $E_{ {GWW} }$ triads. Since initial balanced energy was
 ${{{{E}}_{{G}}}} = Ro^{2}=0.01$ in this case, we find from figure 7
 $(b)$ that balanced energy increases by
 $12.9\,\%$ due to direct transfer by the waves. Although waves transfer energy to the balanced flow in the SW regime, a fraction of the small-scale features formed at early times in the balanced flow seen in figure 2
 $(c)$ reaches dissipative scales leading to a loss of balanced energy. The balanced flow's energy budget based on (3.4a) shown in figure 7
 $(d)$ reveals this. Observe that approximately
 $10.8\,\%$ of balanced energy gets dissipated, due to which there is only
 $2.1\,\%$ increase in balanced energy by the end of the experiment. On examining the waves energy budget given in figure 7
 $(f)$ we find that waves have lost
 $16.5\,\%$ of their energy. Since the balanced energy is small in this regime, the
 $12.9\,\%$ gain in balanced energy due to direct transfer by the waves is only a small loss of energy for the waves. Consequently, as seen in figure 7
 $(f)$, most of the wave energy is lost to dissipation. On comparing figures 7
 $(e)$ and 7
 $(\,f)$, we find that the waves’ energy loss in the CW regime is significantly higher than that in the SW regime, in spite of both these regimes having the same initial wave energy
 ${E}_{W}=1$. As clarified with the spectral flux plots in figure 6, the forward wave energy flux is significantly enhanced by the presence of a stronger balanced flow. Weak balanced flow in the SW regime leads to lower wave dissipation.
Recall that we defined the balanced field to be the flow field that is in geostrophic balance based on (2.6). Nevertheless, high frequency fluctuations can still be present in the balanced flow, which is especially expected in the SW regime where wave fields are much stronger than balanced flow. To extract a slow balanced component from the total balanced flow, we performed a running time averaging operation on the balanced fields as
 \begin{equation} {{{\bar{u}}_{{G}}}} (\boldsymbol{x}, z, t) = (1/ \tau) \int_{t-\tau/2}^{t+\tau/2} {{{u}}_{{G}}} (\boldsymbol{x}, z, s)\,\textrm{d} s. \end{equation}
Figures 8 $(a)$ and 8
 $(b)$ show the frequency spectra of the balanced velocity
 ${{{u}}_{{G}}}$ before (black curve) and after (red curve) the fast-time-averaging operation. Observe that time-averaging removes high frequency fluctuations from the frequency spectrum, providing us a slow balanced field. We used time-averaged balanced fields –
 ${{{\bar{u}}_{{G}}}}$,
 ${{{\bar{v}}_{{G}}}}$ and
 ${{{\bar{b}}_{{G}}}}$ – to compute the slow geostrophic flow energy and compared it with the original unaveraged geostrophic energy during multiple time intervals. An example comparison for the duration
 $t=2000\text {--}3000$ is given in figures 8
 $(c)$ and 8
 $(d)$ for the CW and SW cases, with the black curve showing the evolution of the full balanced energy (i.e. a part of the black curves shown in figures 7
 $c$ and 7
 $d$) and the red curves showing the evolution of the slow balanced energy. As seen in figures 8
 $(c)$ and 8
 $(d)$, the slow balanced flow's energy captures the changes in the total balanced flow's energy very well. This comparison between slow balanced flow's and unaveraged balanced flow's energy illustrate that the changes in the balanced energy seen in figures 7
 $(c)$ and 7
 $(d)$ corresponds to changes in the slow-evolving geostrophic balanced flow's energy. Although fast fluctuations are inherently present in the geostrophic flow, especially in the SW regime, their effects are weak and therefore insignificant.
Panels ( $a$) and (
 $b$) show the frequency spectra of
 ${{{u}}_{{G}}}$ (black curve) and
 ${{{\bar{u}}_{{G}}}}$ (red curve) for the CW and SW regimes. The frequency spectra were computed using time series of velocity stored from
 $t=2000\text {--}3000$. Panels (
 $c$) and (
 $d$) show the total balanced energy (black curves) and slow balanced energy (red curves), computed based on the slow balanced fields:
 ${{{\bar{u}}_{{G}}}}$,
 ${{{\bar{v}}_{{G}}}}$ and
 ${{{\bar{b}}_{{G}}}}$. Note that the black curves in panels (
 $c$) and (
 $d$) above are a small part of the black curves seen in figures 7
 $(c)$ and 7
 $(d)$, respectively.

3.1. Wave kinetic and potential energy budgets
The results of our numerical experiments described above point out that in the  $Ro \ll 1$ regime NIWs can act as an energy sink for the balanced flow when wave and balanced flow energies are comparable, whereas NIWs act as an energy source for the balanced flow in regimes where wave energy exceeds balanced energy. We will now examine more specific details of the wave energy budget so as to check some of the hypothesis used in developing coupled NIW-balanced flow asymptotic models in recent times, described in Xie & Vanneste (Reference Xie and Vanneste2015), Wagner & Young (Reference Wagner and Young2016) and Rocha et al. (Reference Rocha, Wagner and Young2018), which we refer to as XV, WY and RWY, respectively, hereafter in this section.
Young & Ben Jelloul (Reference Young and Ben Jelloul1997) derived an approximate Schrödinger-like amplitude equation for the evolution of NIWs. A distinct feature of this approximate asymptotic model is that NIWs conserve their kinetic energy. Xie & Vanneste (Reference Xie and Vanneste2015) coupled this reduced wave model with an asymptotic equation for the evolution of a Lagrangian averaged balanced flow in a regime where wave energy is asymptotically higher than balanced flow energy, i.e. the same regime we identify as SW in this paper. Wagner & Young (Reference Wagner and Young2016) extended XV's model to include a weak second inertial harmonic wave field while RWY truncated NIWs in XV's model to a plane wave and examined its interactions with a barotropic flow using two-dimensional simulations. A horizontally homogeneous wave field with zero potential energy, such as our wave field in the present study, will acquire spatial scales from the mean flow and thereby increase its potential energy. Since the kinetic energy of NIWs is conserved in their asymptotic models, total energy conservation of the coupled model demands that the increase in wave potential energy should correspond to a decrease in the balanced flows energy. Consequently, XV, WY and RWY conclude that NIW-balanced flow interactions can result in an energy sink for the balanced flow in the SW regime.
Before we dwell into a detailed examination of energy budgets of our experiments, we point out two noteworthy differences between our set-up and that of the asymptotic models refereed to above. The first difference is in the way we scaled the governing equations. Recall that our experiments are based on the weakly nonlinear dynamics of (2.3) in the regime  $Ro \ll 1$. In our non-dimensionalization, as explained below (2.2), the velocity scale
 $U$ may be thought of as an estimate for the largest velocity value prescribed initially. In the CW regime initialized with
 ${{{{E}}_{{G}}}} = {E}_{W}$ or, equivalently,
 ${{{{U}}_{{G}}}} \sim {U}_{W}$, this means that the velocity scale appearing in
 $Ro$ may be identified with the wave or balanced field, i.e.
 $Ro \sim Ro_{wave} = {U}_{W}/fL \sim {{{{U}}_{{G}}}}/fL = Ro_{balanced}$. In contrast, we initialized our SW regime as
 ${{{{E}}_{{G}}}} = Ro^{2}\ {E}_{W}$, leading to
 ${{{{U}}_{{G}}}} \sim Ro\ {U}_{W}$. Therefore, in the SW regime we have
 $Ro \sim Ro_{wave} = {U}_{W}/fL$ and
 $Ro_{balanced} = {{{{U}}_{{G}}}}/fL = Ro \ {U}_{W}/fL \sim Ro^{2}$. Consequently, if we defined the Rossby number based on the balanced velocity in the SW regime, it would be
 $Ro^{2}$ and not
 $Ro$. In the asymptotic models noted above they define the Rossby number based on the balanced velocity field. Therefore, the Rossby number in the asymptotic models is given by
 $Ro_{asymptotic} = Ro^{2}$ and the asymptotic expansions they use to derive approximate reduced models are based on the small parameter
 $\epsilon = \sqrt {Ro_{asymptotic}} = Ro$.
The second key difference between our set-up and that of reduced asymptotic models is in the way wave-balance decomposition is defined. Our wave-balance decomposition is based on the linear equations (2.4), where the wave field consists of linear waves evolving based on (2.5). As confirmed by our detailed examination of the waves’ frequency spectra, with figure 4 $(a)$ showing a specific snapshot, the wave field remains near-inertial throughout the dynamics. The balanced flow on the other hand is the Eulerian field in geostrophic balance given by (2.6). This decomposition is orthogonal (see details given in appendices A and B) such that the total energy is the exact sum of wave and balanced energies. Contrary to our Eulerian wave-balance decomposition, the asymptotic models of XV, WY and RWY use an approximate Lagrangian balanced flow derived based on asymptotic analysis, this being the balanced flow that is coupled with linear NIWs. This crucial difference in defining balanced flow makes a straightforward comparison between our results and the results of the asymptotic models challenging.
In spite of the challenge noted above, we remind the reader that our numerical experiments are based on the Boussinesq equations, equations that conserve total energy in the absence of dissipative effects; the total energy being the sum of wave and balance energies as noted below (2.5) and (2.6). Furthermore, the asymptotic models noted above are derived starting form the Boussinesq equations as their parent model. Additionally, the asymptotic models conserve the sum of linear wave and Lagrangian balanced energy, in the absence of dissipative effects. Therefore, if the results of the asymptotic models agree with the results of Boussinesq equations then, since the wave field is linear in both cases, the wave energy budget should be similar within Boussinesq equations and the asymptotic models. In other words, if waves gain energy in the asymptotic models, the same must be observed in the results that follow from the Boussinesq equations, and vice versa. To check these aspects in greater detail than that provided in figure 7, we will now take a closer look at the wave energy budget within our experiments.
Along the same lines as the development of the total wave energy change equation (3.4b), we may write the kinetic and potential energy change equations of waves as (see appendix B for specific details on the derivation of these equations)
 \begin{align} {\rm \Delta} E^{ {KE} }_{ {W} } (t)& = E^{ {KE} }_{ {W} } (t) - E^{ {KE} }_{ {W} } (0)\nonumber\\ & = \underbrace{ E^{ {KE \leftrightarrow PE} }_{ {W} } (t) + E^{ {KE} }_{ {WWW} } (t) + E^{ {KE} }_{ {WGW} } (t) + E^{ {KE} }_{ {WGG} } (t) }_{ E^{ {KE} }_{ {net} } (t)} - D^{ {KE} }_{ {W} } (t), \end{align}
 \begin{align} {\rm \Delta} E^{ {PE} }_{ {W} } (t) &= E^{ {PE} }_{ {W} } (t) - E^{ {PE} }_{ {W} } (0)\nonumber\\ & = \underbrace{ E^{ {PE \leftrightarrow KE} }_{ {W} } (t) + E^{ {PE} }_{ {WWW} } (t) + E^{ {PE} }_{ {WGW} } (t) + E^{ {PE} }_{ {WGG} } (t) }_{ E^{ {PE} }_{ {net} } (t)} - D^{ {PE} }_{ {W} } (t). \end{align}
In the above equations  ${\rm \Delta} E^{ {KE} }_{ {W} }$ and
 ${\rm \Delta} E^{ {PE} }_{ {W} }$ correspond to changes in the waves’ kinetic and potential energies, respectively, from initial time while the right-hand sides of the equations above give the different terms that lead to the changes. The term
 $E^{ {KE \leftrightarrow PE} }_{ {W} }$ that appears in the kinetic energy equation (3.6a) is the wave kinetic-to-potential energy conversion term and is equal and opposite to term
 $E^{ {PE \leftrightarrow KE} }_{ {W} }$ that appears in the potential energy equation (3.6b). Specifically,
 \begin{equation} E^{ {KE \leftrightarrow PE} }_{ {W} } = \int_{\tau=0}^{\tau=t} \left \langle {{{b}}_{{W}}} {{{w}}_{{W}}} \right \rangle d \tau ={-} E^{ {PE \leftrightarrow KE} }_{ {W} }, \end{equation}
where the angle brackets above, as in (3.1), represent integration over the whole domain. The above kinetic-to-potential conversion term straightforwardly appears on writing down the waves’ energy budget from the linear wave equations given in (2.5).
The  $E^{ {KE} }_{ {WWW} }$,
 $E^{ {KE} }_{ {WGW} }$,
 $E^{ {KE} }_{ {WGG} }$ terms in the kinetic energy equation (3.6a) and the
 $E^{ {PE} }_{ {WWW} }$,
 $E^{ {PE} }_{ {WGW} }$,
 $E^{ {PE} }_{ {WGG} }$ terms in the potential energy equation (3.6b) refer to changes in wave kinetic and potential energies due to different kinds of triadic interactions. Finally,
 $D^{ {KE} }_{ {W} }$ and
 $D^{ {PE} }_{ {W} }$ represent dissipation of wave kinetic and potential energies, respectively. Note that the wave kinetic and potential energy equations given above are basically a break up of the waves’ total energy budget given in (3.4b), i.e. we recover (3.4b) on summing up the kinetic and potential energy equations in (3.6). Consequently, we have the identities:
 $E^{ {KE} }_{ {WWW} } + E^{ {PE} }_{ {WWW} } = 0$,
 $E^{ {KE} }_{ {WGW} } + E^{ {PE} }_{ {WGW} } = E_{ {WGW} }$,
 $E^{ {KE} }_{ {WGG} } + E^{ {PE} }_{ {WGG} } = E_{ {WGG} }$ and
 $D^{ {KE} }_{ {W} } + D^{ {PE} }_{ {W} } = D_{ {W} }$.
For convenience in examining wave kinetic and potential energy budgets below, we combine the changes due to kinetic–potential conversion and triadic terms as  $E^{ {KE} }_{ {net} }$ in the kinetic energy budget (3.6a) and
 $E^{ {PE} }_{ {net} }$ in the potential energy budget (3.6b). Note that since the kinetic–potential energy conversion terms are equal and opposite in sign, we have the identity
 $E^{ {KE} }_{ {net} } + E^{ {PE} }_{ {net} } = E^{ {triads} }_{ {W} }$,
 $E^{ {triads} }_{ {W} }$ being the sum of all triads that appears in the waves’ energy budget given in (3.4b). Figures 9
 $(a)$ and 9
 $(b)$ show the time series of
 $E^{ {KE} }_{ {net} }$,
 $E^{ {PE} }_{ {net} }$ and
 $E^{ {triads} }_{ {W} }$ with the SW regime and CW regime, respectively. We excluded the waves’ small-scale dissipation in figure 9, which was already discussed in connection with figures 7
 $(e)$ and 7
 $(\,f)$.
Wave kinetic and potential energy transfers: SW ( $a$) and CW (
 $b$).

In the SW regime shown in figure 9 $(a)$, we find that the waves’ kinetic energy contribution (black curve) decreases more than the increase in the waves’ potential energy contribution (blue curve), resulting in a net decrease in wave energy, as shown by the red curve (this being the same red curve that appears in figure 7
 $(\,f)$, although it appears as a straight line there due to the small magnitude of change). Above observations point out that the changes in wave kinetic energy is by no means negligible when compared with the changes in wave potential energy. A key constraint in the asymptotic formulations of XV, WY and RWY is that wave kinetic energy is conserved in time while wave potential energy increases due to interactions with the balanced flow. Since these models are set in a regime where wave energy dominates over balanced flow, i.e. our SW regime, one might have anticipated NIW kinetic energy to be ‘almost conserved’ or at least to change by an amount that is significantly less than the change in NIW potential energy. However, as seen in figure 9
 $(a)$, the magnitude of changes in NIW kinetic and potential energies are of the same order, with the magnitude of the kinetic energy drop exceeding the increase in potential energy, leading to waves losing energy to the balanced flow.
Recently Thomas & Arun (Reference Thomas and Arun2020) examined NIW-balanced flow interactions in a two-vertical-mode model. As described in detail there, their two-vertical-mode model can be used as a starting point for deriving coupled two-dimensional NIW-balanced flow models such as those used in XV and RWY. Although NIWs extracting energy from the balanced flow was anticipated in that set-up as well, Thomas & Arun found that in the SW regime the magnitude of decrease in NIW kinetic energy exceeded the increase in NIW potential energy, resulting in a net drop in NIW energy (see discussions in § IV of Thomas & Arun Reference Thomas and Arun2020 with regards to their figures 6 $a$ and 12
 $a$), similar to our findings given in figure 9
 $(a)$. The results from the two-dimensional work of Thomas & Arun (Reference Thomas and Arun2020) and our findings described in this paper point out that NIWs should in general be expected to transfer energy to balanced flows in wave-dominant regimes.
In spite of the asymptotic models of XV, WY and RWY being based in the SW regime where NIW energy exceeds balanced energy, we will now examine the wave energy budget in the CW regime. In the CW regime shown in figure 9 $(b)$ we find that the wave potential energy contribution (blue curve) increases more than the decrease in the wave kinetic energy contribution (black curve) resulting in a net increase in the wave energy indicated by the red curve (this being the same red curve that appears in figure 7
 $e$). In this regime, although the increase in wave potential energy exceeds the magnitude of decrease in wave kinetic energy, the magnitude of their changes are of the same order. Note that the increase in wave potential energy is not more than three times the magnitude of decrease in wave kinetic energy. Additionally, on short time scales, such as
 $t<500$ where the asymptotic models are expected to work better, the changes in wave kinetic and potential energies are quite close in magnitude.
Based on our examination of wave kinetic and potential energy budgets, we conclude that the simple mechanism by which NIWs extract balanced energy, suggested by the asymptotic models, are not seen in our numerical simulation results. In the specific CW and SW regimes presented in detail in figure 9 and in many other cases we examined on an exploratory parameter sweep summarized in table 1 (see § 3.2 below), we consistently found that NIW kinetic energy changed by magnitudes comparable to changes in NIW potential energy, invalidating the key conservation law in the asymptotic models of XV, WY and RWY. As mentioned earlier, although the balanced flow is different in our set-up and theirs, the wave field is linear. Therefore, a key result that follows from our detailed examination of the wave energy budget is the significant change in NIW kinetic energy, contrary to the assumption of conservation of NIW kinetic energy based on the Young & Ben Jelloul (Reference Young and Ben Jelloul1997) model. Our findings reveal shortcomings of existing NIW-balanced flow coupled asymptotic models and emphasize the need to improve them. Recent work by Asselin & Young (Reference Asselin and Young2019) suggest that higher-order corrections can be incorporated to the wave evolution equation, thereby modifying the energetics of coupled asymptotic models (see speculations detailed in their § 3.2). This could be a potential avenue for further exploration so as to develop improved asymptotic models whose predictions align with energy transfer pathways predicted by the Boussinesq equations.
Summary of net energy changes in the geostrophic balanced flow and NIW field based on numerical experiments. All simulations were performed up to  $t=4000$.

3.2. Energetics in neighbouring regimes
Based on our exploratory numerical experiments, the abovementioned phenomenology and energy transfer directions were observed in other parameter regimes as well, except for quantitative changes. We will now examine the quantitative changes observed in neighbouring regimes. When we set  ${{{{E}}_{{G}}}} = {E}_{W} =1$ in the CW regime, we found that
 $10.4\,\%$ of the balanced energy and
 $62\,\%$ of the wave energy were lost by final time, as summarized in table 1 corresponding to experiment 1 (also recall left column of figure 7). On doubling the initial wave and balanced energies to
 ${{{{E}}_{{G}}}} = {E}_{W} = 2$, we found that the balanced energy dropped by
 $15\,\%$ while the wave energy dropped by
 $80\,\%$. On the other hand, decreasing the initial wave and balanced energies to
 ${{{{E}}_{{G}}}} = {E}_{W} = 0.5$ resulted in an
 $8\,\%$ drop in balanced energy and
 $56\,\%$ drop in wave energy. The results of these two experiments, given in table 1 as experiments 2 and 3, are as expected. Increasing the flow energy increases the magnitudes of wave and balanced fields in the governing equations (2.3), thereby accelerating the rate of turbulent exchanges between the fields, while the opposite scenario takes place on decreasing the flow energy resulting in weaker interactions. Consequently, by a fixed final time (
 $t=4000$) we find more energy loss in the wave and balanced flow fields for the higher flow energy case and vice versa for the lower flow energy case. Overall we find
 $O(10\,\%)$ loss of balanced energy in CW regimes.
On examining the SW regime, we found that the balanced energy increased by  $2.1\,\%$ while the wave energy dropped by
 $16.5\,\%$ in the case we discussed in detail (recall figure 7
 $b{,}d{,}f$), this case being summarized as experiment 4 in table 1. On increasing the initial wave and balanced energies to
 ${E}_{W} = 2, \ {{{{E}}_{{G}}}}=2Ro^{2}$ (experiment 5 in table 1), we found that the balanced energy increased by
 $13\,\%$ while the wave energy dropped by
 $57\,\%$. In contrast, decreasing the initial wave and balanced energies to
 ${E}_{W} = 0.5, \ {{{{E}}_{{G}}}}=0.5Ro^{2}$ (experiment 6 in table 1), we found much less increase in the balanced energy (
 $0.8\,\%$) and a decrease in the wave energy (
 $8\,\%$). As in the CW regime discussed above, increasing wave and balanced energies increases the interaction rate in (2.3), resulting in higher magnitudes of changes in wave and balanced energies. On the other hand, the opposite effect is seen on decreasing wave and balanced energies.
For consistency, we kept  $Ro$ fixed at 0.1 for the experiments summarized in table 1. On changing
 $Ro$ in (2.3) we found a behaviour similar in effect to that of changing wave and balanced energies. Specifically, increasing
 $Ro$ was seen to speed up interactions resulting in higher magnitudes of changes in wave and balanced energies. The opposite effect was observed when
 $Ro$ was decreased, resulting in lower magnitudes of changes in wave and balanced fields by the end of the experiment.
Based on a broad set of exploratory simulations (from which a subset of quantitative results are summarized in table 1), irrespective of specific magnitudes of energy transfer, overall we found that waves were efficient in extracting balanced energy in CW regimes with  ${{{{E}}_{{G}}}} \sim {E}_{W}$, while waves fed the balanced flow in SW regimes with
 ${{{{E}}_{{G}}}} \sim Ro^{2} {E}_{W}$. We focused on specific SW regimes with
 ${{{{E}}_{{G}}}}/{E}_{W} \sim Ro^{2}$ in the high wave energy limit, since this distinguished limit has received considerable attention with regards to multiple asymptotic models as discussed earlier. Nevertheless, waves were seen to feed the balanced flow in regimes where balanced energy was less than that in the SW regime, i.e. in regimes where
 ${{{{E}}_{{G}}}} \ll Ro^{2} {E}_{W}$. On the other extreme end, when wave energy was asymptotically weaker than balanced energy with
 ${E}_{W} \ll {{{{E}}_{{G}}}}$, we observed almost no changes in balanced energy. Finally, in intermediate regimes where balanced energy was lower than that in the CW regime but higher than that in the SW regime, such as
 ${{{{E}}_{{G}}}}/{E}_{W} = Ro$ for example, we observed that balanced flow gained energy from waves for a certain duration, after which they slowly started losing energy to waves. Due to this gradual change in energy transfer direction, effectively after a significant duration, balanced flow was seen to lose a small fraction of its energy.
4. Summary
Wind generated NIWs are ubiquitous in the upper ocean and form an important energy source for oceanic internal gravity waves. The interaction of these waves with balanced flows can result in wave modulations, facilitating their vertical propagation, thereby leading to turbulent mixing and dissipation in the interior parts of the ocean. Additionally, NIWs are often hypothesized to be a potential agent that can form an energy sink for balanced energy. These and related questions have triggered many studies on NIW-balanced flow interactions. The present work was inspired by the recognition of high variability in the balance-to-wave energy ratio in the ocean, as a function of geographic location and seasons of the year. We therefore explored turbulent energy exchanges between NIWs and balanced flows in different balance-to-wave energy regimes.
Our investigation was based on freely evolving numerical integrations of the non-hydrostatic Boussinesq equations in the small-Rossby-number regime. We generated multiple turbulent geostrophic balanced flow fields with energy levels of our choice and initialized horizontally homogeneous inertial oscillations on top of the balanced flow. The three cases we discussed in great detail – CW, SW and OW – were initialized with  ${({{{{E}}_{{G}}}}/{E}_{W})}_{t=0}=1$,
 ${({{{{E}}_{{G}}}}/{E}_{W})}_{t=0}=Ro^{2}$ and
 ${({{{{E}}_{{G}}}}/{E}_{W})}_{t=0}=0$, respectively,
 $Ro$ being the Rossby number. All cases had the same initial wave energy, the regimes being differentiated with varying balanced energy levels.
On examining the dynamics of different regimes, the wave field was seen to remain as pure inertial oscillations trapped in the upper ocean in the OW regime, where no balanced flow was initialized. The SW regime with weak balanced flow was characterized by the waves becoming horizontally inhomogeneous and propagating vertically to some extent. On the other hand, the wave field in the CW regime was seen to develop much smaller horizontal scales and rapidly propagate to the interior parts of the ocean. In addition to the rapid vertical propagation and small-scale formation, the CW regime was seen to have much higher wave dissipation than the SW regime, this being facilitated by the balanced flow. The inter-comparison between the three regimes with fixed initial wave energies but varying balanced energies highlights that vertical propagation, forward energy flux and subsequent small-scale dissipation of NIWs can be accelerated by the presence of a stronger balanced flow.
A summary of the turbulent energy transfer pathways in different regimes based on our study is shown as schematics in figures 10 $(a)$ and 10
 $(b)$ for the CW and SW regimes, respectively. The NIWs exhibit a forward energy flux in both regimes, as shown by the red rightward pointing arrows in the red boxes representing NIWs. Notice that the red arrows are longer in the CW regime than in the SW regime, indicating a relatively rapid forward energy flux and dissipation of NIWs in CW regimes associated with a stronger balanced flow. The geostrophic flow exhibits an inverse energy flux in both regimes, indicated by black left-going arrows in the black bottom boxes representing geostrophic flow. Additionally, in the SW regime waves facilitate a weak forward flux of geostrophic energy, which is indicated by the small reddish brown rightward pointing arrows in the geostrophic flow's box in figure 10
 $(b)$. Finally, the blue arrows between the wave and balanced flow's boxes indicate energy transfer between the two fields. Net energy transfer is from the balanced flow to waves in CW regimes and vice versa in SW regimes.
Schematics showing energy transfer pathways in  $(a)$ CW and
 $(b)$ SW regimes. The top red boxes represents NIWs while the black bottom boxes represents the geostrophic balanced flow. Within wave and balanced modes, the wavenumber increases from left to right, as represented by the long blue rightward pointing arrows at the bottom of panels (a) and (b). In both regimes the geostrophic balanced flow undergoes inverse energy flux, as indicated by the leftward pointing black arrows in the
 $G$-boxes. Additionally, waves in the SW regime facilitate a weak forward flux of geostrophic energy, as indicated by the small reddish brown rightward pointing arrows in the
 $G$-box. In both regimes NIWs exhibit a forward energy flux, as indicated by the rightward pointing red arrows in the
 $W$-boxes. The forward flux of wave energy is stronger in the CW regime, which is why the red arrows are longer in the CW waves’ box relative to the SW waves’ box. Finally, in the CW regime NIWs extract energy from the balanced flow, as shown by the upward pointing blue arrows in panel
 $(a)$ while NIWs transfer energy to the balanced flow in the SW regime, as indicated by the downward pointing blue arrows in panel
 $(b)$.

In addition to the significant effect balanced flow strength has on the modulation of NIWs, a key outcome of this study is the variability in the direction of energy transfer between NIWs and balanced flow in different parameter regimes. The NIWs extract energy from geostrophic balanced flows in CW regimes where balanced and wave energy levels are of the same order, while NIWs transfer energy to balanced flows in SW regimes where wave energy exceeds balanced energy. Our results therefore point out that depending on the relative strengths of wave and balanced energy levels in the ocean, geostrophic balanced flow may lose or gain energy from NIWs. In other words, NIWs need not always act as an energy sink for balanced energy, contrary to popular notions generically trying to portray NIWs as a potential energy sink for mesoscale geostrophic balanced flow in the global ocean.
Acknowledgements
The authors thank the Los Alamos National Laboratory Institutional Computing Program for providing required computational resources for this work. Los Alamos National Laboratory is operated by Triad National Security, LLC, for the National Nuclear Security Administration of U.S. Department of Energy (contract number 89233218CNA000001).
Declaration of interests
The authors report no conflict of interest.
Appendix A. Implementing the wave-balance decomposition
The wave-balance decomposition we used is based on the linear Boussinesq equations and are given in (2.5) and (2.6). Here we will describe how the decomposition is carried out in spectral space. We expand the wave field in Fourier modes as
 \begin{gather} \left [ {{{u}}_{{W}}}, {{{v}}_{{W}}}, {{{p}}_{{W}}} \right] = \sum_{\boldsymbol{k}} \left [ {\hat{u}}_{W} (\boldsymbol{k}), {\hat{v}}_{W} (\boldsymbol{k}) , {\hat{p}}_{W} (\boldsymbol{k}) \right ] \cos (k_z z)\exp({\textrm{i} (k_x x + k_y y - \omega t)}), \end{gather}
 \begin{gather} \left [ {{{w}}_{{W}}}, {{{b}}_{{W}}} \right] = \sum_{\boldsymbol{k}} \left [ {\hat{w}}_{W} (\boldsymbol{k}), {\hat{b}}_{W}(\boldsymbol{k}) \right ] \sin (k_z z)\exp({\textrm{i} (k_x x + k_y y - \omega t)}), \end{gather}
where  $\omega = {\pm }\alpha \sqrt { ( k_h^{2} + k_z^{2} ) / ( k_h^{2} + \alpha ^{2} k_z^{2} ) }$ is the linear internal gravity wave dispersion relationship in non-dimensional form. In dimensional form this is equivalent to
 $\omega _{{dimensional}} = {\pm } \sqrt {( N^{2} k_h^{2} + f^{2} k_z^{2} ) / ( k_h^{2} + k_z^{2} ) }$. Similarly, we expand the balanced field in Fourier modes as
 \begin{gather} \left [ {{{u}}_{{G}}}, {{{v}}_{{G}}}, {{{p}}_{{G}}} \right] = \sum_{\boldsymbol{k}} \left [ {{{{\hat{u}}}_{{G}}}} (\boldsymbol{k}), {{{{\hat{v}}}_{{G}}}} (\boldsymbol{k}) , {{{{\hat{p}}}_{{G}}}} (\boldsymbol{k}) \right ] \cos (k_z z)\exp({\textrm{i} (k_x x + k_y y )}), \end{gather}
 \begin{gather} \left [ {{{w}}_{{G}}}, {{{b}}_{{G}}} \right] = \sum_{\boldsymbol{k}} \left [ {{{{\hat{w}}}_{{G}}}} (\boldsymbol{k}), {{{{\hat{b}}}_{{G}}}} (\boldsymbol{k}) \right ] \sin (k_z z)\exp({\textrm{i} (k_x x + k_y y )}). \end{gather}
In the above expansions we used cosine and sine series in the vertical direction since our domain consists of impenetrable rigid lids on top and bottom ends. In triply periodic domains one would use the full Fourier series in  $z$, as can be seen in several previous works such as Bartello (Reference Bartello1995), Embid & Majda (Reference Embid and Majda1998), Smith & Waleffe (Reference Smith and Waleffe2002), Majda (Reference Majda2002), Deusebio, Vallgren & Lindborg (Reference Deusebio, Vallgren and Lindborg2013), Hernandez-Duenas, Smith & Stechmann (Reference Hernandez-Duenas, Smith and Stechmann2014), Herbert et al. (Reference Herbert, Marino, Rosenberg and Pouquet2016) and Waite (Reference Waite2017) for example.
Substituting (A 1) in (2.5), (A 2) in (2.6) and simplifying gives us
 \begin{align} \boldsymbol{ {{{\phi}}_{{W}}} } (\boldsymbol{k}, t) = \left [ {\hat{u}}_{W}, {\hat{v}}_{W}, {\hat{w}}_{W}, {\hat{b}}_{W}\right]^{\textrm{T}} & = {{{a}}_{{W}}} (t) \left [ (\omega k_x + \textrm{i} k_y ) k_z, ( \omega k_y - \textrm{i} k_x ) k_z, -\textrm{i} \omega k_h^{2}, - k_h^{2} \right ]^{\textrm{T}} \nonumber\\
&= {{{a}}_{{W}}} (t) \boldsymbol{ {{{\psi}}_{{W}}} } (\boldsymbol{k}), \end{align}
 \begin{align} \boldsymbol{ {{{\phi}}_{{G}}} } (\boldsymbol{k}, t) = \left [ {{{{\hat{u}}}_{{G}}}}, {{{{\hat{v}}}_{{G}}}}, {{{{\hat{w}}}_{{G}}}}, {{{{\hat{b}}}_{{G}}}} \right]^{\textrm{T}} & = {{{a}}_{{G}}} (t) \left [ -\textrm{i} k_y, \textrm{i} k_x, 0, - k_z \right ]^{\textrm{T}} = {{{a}}_{{G}}} (t) \boldsymbol{ {{{\psi}}_{{G}}} } (\boldsymbol{k}), \end{align}
where  ${{{a}}_{{W}}}$ and
 ${{{a}}_{{G}}}$ are the amplitudes of wave and balanced flow for each wavenumber. It is easy to see in the above expressions that the wave and balance vectors above are orthogonal, i.e.
 $\boldsymbol { \psi ^{*}_{G} } (\boldsymbol {k}) \boldsymbol{\cdot} \boldsymbol { \psi _{W} } (\boldsymbol {k}) = \boldsymbol { \psi ^{*}_{W} } (\boldsymbol {k}) \boldsymbol{\cdot} \boldsymbol { \psi _{G} } (\boldsymbol {k}) = 0$. Above expressions for the spectral fields of wave and balanced flow applies to wavenumbers
 $\boldsymbol{k_h} \neq 0$. For the special case of the horizontally homogeneous mode,
 $\boldsymbol{k_h} = 0$, there is no geostrophic mode and the wave field is pure inertial oscillation. For the
 $\boldsymbol{k_h} = 0$ mode, the expansion (A 1) still holds with
 $\omega = {\pm }1$ and
 \begin{equation} \boldsymbol{ {{{\phi}}_{{W}}} } (\boldsymbol{k}) = \left [ {\hat{u}}_{W}, {\hat{v}}_{W}, {\hat{w}}_{W}, {\hat{b}}_{W}\right]^{\textrm{T}} = \left [ 1, \textrm{i}, 0, 0 \right ]^{\textrm{T}} a_0(t). \end{equation}
The total wave field is then the sum of horizontally homogeneous inertial oscillations ( $\boldsymbol{k_h} = 0$ mode) and inhomogeneous wave modes (
 $\boldsymbol{k_h} \neq 0$). The sum of wave and balanced fields gives the total flow fields. We will now describe how the wave-balance decomposition is performed in spectral space.
As pointed out above, the combination of (A 3) and (A 4) gives us the spectral wave-balance decomposition. Any solution of the Boussinesq equations in spectral space can be expressed as a linear combination of the orthogonal vectors  $\boldsymbol { {{{\psi }}_{{W}}} } (\boldsymbol {k})$ and
 $\boldsymbol { {{{\psi }}_{{G}}} } (\boldsymbol {k})$ as
 \begin{equation} \left( \hat{u}_{\boldsymbol{k}}, \hat{v}_{\boldsymbol{k}}, \hat{w}_{\boldsymbol{k}}, \hat{b}_{\boldsymbol{k}}\right)^{\textrm{T}} = \boldsymbol{ \phi } (\boldsymbol{k}, t) = {{{a}}_{{W}}} \boldsymbol{ {{{\psi}}_{{W}}} } (\boldsymbol{k}) + {{{a}}_{{G}}} \boldsymbol{ {{{\psi}}_{{G}}} } (\boldsymbol{k}). \end{equation}
Consider first modes  $\boldsymbol{k_h} \neq 0$. For these modes, each wavenumber consists of balanced and wave modes. The constants
 ${{{a}}_{{W}}}$ and
 ${{{a}}_{{G}}}$ in (A 5) can be determined by taking the dot product of (A 5) with
 $\boldsymbol { \psi ^{*}_{W} }$ and
 $\boldsymbol { \psi ^{*}_{G} }$. This gives (taking advantage of the orthogonal property of the vectors noted above)
 \begin{equation} {{{a}}_{{G}}} = \frac{ \boldsymbol{ \psi^{*}_{G} } (\boldsymbol{k}) \boldsymbol{\cdot} \boldsymbol{ \phi } (\boldsymbol{k}) }{ \boldsymbol{ \psi^{*}_{G} } (\boldsymbol{k}) \boldsymbol{\cdot} \boldsymbol{ \psi_{G} } (\boldsymbol{k}) }, \quad {{{a}}_{{W}}} = \frac{ \boldsymbol{ \psi^{*}_{W} } (\boldsymbol{k}) \boldsymbol{\cdot} \boldsymbol{ \phi } (\boldsymbol{k}) }{ \boldsymbol{ \psi^{*}_{W} } (\boldsymbol{k}) \boldsymbol{\cdot} \boldsymbol{ {{{\psi}}_{{W}}} } (\boldsymbol{k}) }, \end{equation}
for the modes  $\boldsymbol {k}_h \neq 0$. Since the
 $\boldsymbol {k}_h =0$ mode has no balanced component, this mode is purely a wave mode – inertial oscillations. Once the wave and balanced fields are obtained in spectral space following the spectral decomposition above, three-dimensional inverse Fourier transformation gives us the wave and balanced fields in physical space as
 \begin{equation} ( u, v, w, b) = ( {{{u}}_{{W}}}, {{{v}}_{{W}}}, {{{w}}_{{W}}}, {{{b}}_{{W}}}) + ( {{{u}}_{{G}}}, {{{v}}_{{G}}}, {{{w}}_{{G}}}, {{{b}}_{{G}}}), \end{equation}
with the wave and balanced fields obtained by the decomposition satisfying (2.5) and (2.6) exactly.
Appendix B. Derivation of wave-balance energy exchange equations
Taking the three-dimensional Fourier transform of (2.3) and projecting the equations on to the wave and balanced fields based on the above procedure gives us
 \begin{gather} \frac{\partial{ \boldsymbol{ {{{\phi}}_{{W}}} } (\boldsymbol{k}, t) }}{\partial{t}} + {L}_{W} ( \boldsymbol{ {{{\phi}}_{{W}}} } (\boldsymbol{k}, t) ) + {NL}_{W} ( \boldsymbol{ {{{\phi}}_{{W}}} } (\boldsymbol{k}, t), \boldsymbol{ {{{\phi}}_{{G}}} } (\boldsymbol{k}, t) ) = 0, \end{gather}
 \begin{gather} \frac{\partial{ \boldsymbol{ {{{\phi}}_{{G}}} } (\boldsymbol{k}, t) }}{\partial{t}} + {{{{L}}_{{G}}}} ( \boldsymbol{ {{{\phi}}_{{G}}} } (\boldsymbol{k}, t) ) + {{{{NL}}_{{G}}}} (\boldsymbol{ {{{\phi}}_{{W}}} } (\boldsymbol{k}, t), \boldsymbol{ {{{\phi}}_{{G}}} } (\boldsymbol{k}, t) ) = 0, \end{gather}
where  $\boldsymbol { {{{\phi }}_{{G}}} } (\boldsymbol {k}, t)$ is as given in (A 3b) while
 $\boldsymbol { {{{\phi }}_{{W}}} } (\boldsymbol {k}, t)$ is the combination of (A 3a) and (A 4).
Obtaining separate evolution equations for the wave and balanced field – as given in (B 1a) and (B 1b) – is the achievement of applying the wave-balance decomposition to the governing equations. The  ${L}_{W} ( \boldsymbol{ {{{\phi }}_{{W}}} } (\boldsymbol {k}, t) )$ and
 ${{{{L}}_{{G}}}} ( \boldsymbol{ {{{\phi }}_{{G}}} } (\boldsymbol {k}, t) )$ terms above are the linear terms in the equations and
 ${NL}_{W} ( \boldsymbol{ {{{\phi }}_{{W}}} } (\boldsymbol {k}, t), \boldsymbol{ {{{\phi }}_{{G}}} } (\boldsymbol {k}, t) )$ and
 ${{{{NL}}_{{G}}}} (\boldsymbol{ {{{\phi }}_{{W}}} } (\boldsymbol {k}, t), \boldsymbol{ {{{\phi }}_{{G}}} } (\boldsymbol {k}, t) )$ being the nonlinear terms in the equations. In the absence of the nonlinear terms solving the above equations will give us linear waves with specific frequencies at each wavenumber (based on the dispersion relationship) and geostrophic flow that does not evolve at the linear level. Additionally, at the linear level waves and balanced flow separately conserve their energy. The nonlinear interaction terms above couple the two fields and allow exchange of energy. A detailed discussion of the eigenvalue decomposition can be found in Majda (Reference Majda2002) (especially see chapter 8 there).
We will now describe the steps to obtain the energy equations for wave and balanced flow. Multiplying the  ${\hat{u}}_{W}$ equation in (B 1a) with
 $\hat {u}^{*}_{W}$ and adding the complex conjugate of the equation so obtained with itself gives us an evolution equation for
 $\vert \hat {u}_{W} \vert ^{2}$. Similarly from the
 ${\hat {v}}_{W}$,
 ${\hat {w}}_{W}$ and
 $ {\hat {b}}_{W}$ equations in (B 1a) we obtain evolution equations for
 $\vert \hat {v}_{W} \vert ^{2}$,
 $\vert \hat {w}_{W} \vert ^{2}$ and
 $\vert \hat {b}_{W} \vert ^{2}$. Summing up these equations leads to the wave energy evolution equation in spectral space, (3.2b). Similar manipulations with the balanced flow's equation (B 1b) gives us the balanced energy evolution equation in spectral space, (3.2a).
Following the above procedure, from the  ${ \hat {u} }_{W}$ and
 ${ \hat {v} }_{W}$ equations in (B 1a) we obtain the wave kinetic energy equation in spectral space. Summing the spectral wave kinetic equation over all wavenumbers gives us an evolution equation for the net wave kinetic energy. Integrating the net wave kinetic energy equation in time from
 $t=0$ to
 $t=t$ gives us the wave kinetic energy equation (3.6a). Along the same lines, manipulating the
 ${ \hat {b} }_{W}$ equation in (B 1a) gives us the wave potential energy equation (3.6b).



