Implication
The animal feed industry is facing the challenge of contributing to the provision of sufficient food of animal-origin to the growing world population while simultaneously improving environmental sustainability of animal production systems. Therefore, there is a need to use feed ingredients more efficiently in animal production. Information on protein digestion kinetics of protein sources using in vitro approaches can be used to further develop the concept of synchronising the dietary supply of energy and protein, which could improve protein retention and efficiency in production animals.
Introduction
In current feed evaluation systems, the nutritional value of protein sources in diets for pigs is based on the concentration and ratio of indispensable amino acids, and their digestibility up to the end of ileum (National Research Council, 2012; Centraal Veevoeder Bureau (CVB), 2016). The ileal digestibility of protein and amino acids only provides information on the quantity of proteins and amino acids apparently absorbed from the gastrointestinal tract (GIT) up to the end of the ileum. Such data do not account for the kinetics of protein digestion along the GIT. Additional information on protein digestion kinetics may help to understand the timing of delivery of amino acids and peptides from dietary proteins along the GIT.
Protein sources with comparable ileal protein digestibility can differ in the kinetics of protein digestion, thereby affecting the postprandial appearance of amino acids and peptides in blood and their post-absorptive metabolism (Mahé et al., Reference Mahé, Benamouzig, Gaudichon, Huneau, de Cruz, Rautureau and Tomé1995; Boirie et al., Reference Boirie, Dangin, Gachon, Vasson, Maubois and Beaufrère1997; Dangin et al., Reference Dangin, Boirie, Garcia-Rodenas, Gachon, Fauquant, Callier, Ballèvre and Beaufrère2001). In humans, fast digestible dietary proteins such as whey protein show an earlier postprandial appearance of amino acids and peptides in blood compared to more slowly digestible sources such as casein (Boirie et al., Reference Boirie, Dangin, Gachon, Vasson, Maubois and Beaufrère1997). The timing of postprandial appearance of amino acids and peptides in blood may relate to the release kinetics of free amino acids or di- and tri-peptides during the process of protein digestion. The release kinetics of free amino acids or di- and tri-peptides can be affected by the chemical composition, the structure of constituting proteins and the physicochemical properties (e.g. solubility) of protein sources. For instance, the in vitro hydrolysis rate of a water-soluble form of casein (i.e. Na+-caseinate) was almost twice as high compared to that of water-insoluble casein at pH 8.0 (Tonheim et al., Reference Tonheim, Nordgreen, Høgøy, Hamre and Rønnestad2007).
Protein digestion along the GIT can be simulated in vitro by incubating protein sources with pepsin and pancreatin sequentially using incubation conditions as prevailing in the GIT. Various in vitro methods have been developed to estimate protein digestibility of feed ingredients for pigs (Babinszky et al., Reference Babinszky, van der Meer, Boer and Den Hartog1990; Cone and van der Poel, Reference Cone and van der Poel1993; Boisen and Fernández, Reference Boisen and Fernández1995). Generally, these methods are end point methods, meaning that they generate a single in vitro digestibility value for nitrogen (N) or CP (N×6.25) after incubation for a fixed period of time. The in vitro digestibility of protein is determined as the solubility of N in the sample, assuming that N present in soluble form is absorbed in the GIT in vivo. However, around 50% of unabsorbed N was present as soluble N in ileal digesta of pigs (Hulshof et al., Reference Hulshof, van der Poel, Hendriks and Bikker2016), indicating that this assumption is incorrect. In vivo, dietary proteins need to be hydrolysed into free amino acids or di- and tri-peptides before they can be absorbed by enterocytes in the small intestinal mucosa (Webb et al., Reference Webb, Matthews and DiRienzo1992; Ganapathy et al., Reference Ganapathy, Ganapathy and Leibach2000). Protein sources with a similar in vitro protein digestibility based on determination of N solubility can differ in the extent of release of free amino acids or di- and tri-peptides. Current in vitro methods for estimating protein digestibility do not take this into account. Rather than measuring only the change in N solubility in vitro, determination of the change of molecular weight distribution of soluble proteins and peptides before and during enzymatic incubation might improve the understanding of both in vitro and in vivo digestion of proteins in feed ingredients. The objective of the present study was to determine in vitro protein digestion kinetics of different protein sources. The in vitro protein digestion kinetics were described as the change in N solubility and in molecular weight distribution of the soluble protein and peptide fraction during in vitro simulation of gastric and intestinal protein digestion in pigs.
Material and methods
Experimental design
Each protein source was incubated in triplicate with pepsin and pancreatin sequentially. Per protein source, values were averaged and expressed as mean±SEM.
Protein sources and enzymes used for in vitro incubations
The protein sources evaluated were five batches of soya bean meals (SBMs) (four obtained from Nutreco, Boxmeer, the Netherlands; one as a commodity batch obtained via Research Diet Services, Wijk bij Duurstede, The Netherlands), and single batches of wheat gluten (WG), rapeseed meal (RSM), whey powder (WP) (all commodity batches obtained via Research Diet Services), dried porcine plasma protein (DPP) (obtained from Darling Ingredients Inc., Irving, TX, USA), yellow meal worm larvae (MW) (obtained from Kreca, Ermelo, The Netherlands) and black soldier fly larvae (BSF) (obtained from the Laboratory of Entomology, Wageningen University, The Netherlands). Porcine pepsin (2000 FIP U/g; Merck, Darmstadt, Germany), porcine pancreatin (P1750; Sigma-Aldrich, St. Louis, MO, USA) and porcine bile extract (B8631; Sigma-Aldrich) were used in the incubations with pepsin and pancreatin, respectively.
Chemical analysis
All chemical analyses were performed according to standard laboratory methods. Protein sources were analysed for DM (method ISO 6496; International Organization for Standardization (ISO), 1999b), ash (method ISO 5984; ISO, 2002), acid-hydrolysed ether extract (method ISO 6492; ISO, 1999a) and N by Kjedahl method (method ISO 5983-1; ISO, 2005). The N content of samples obtained during the sequential incubation with pepsin and pancreatin was determined using the Dumas method (method ISO 16634-1; ISO, 2008) and a Flash EA 1112 NC Analyzer (Thermo Fisher Scientific, Waltham, MA, USA).
In vitro incubations with pepsin and pancreatin
The protein sources were hydrolysed according to a two-step method described by Boisen and Fernández (Reference Boisen and Fernández1995) with modifications. The pepsin incubation was carried out under pH 3.5 rather than pH 2.0 as pH 3.5 is more reflective to the condition of the stomach of pigs (Merchant et al., Reference Merchant, McConnell, Liu, Ramaswamy, Kulkarni, Basit and Murdan2011). All protein sources were ground using an ultracentrifugal mill with a 1 mm sieve (ZM200; Retsch GmbH, Hann, Germany). For the simulation of protein digestion in the stomach, 1 g of sample was incubated in a 100 ml plastic centrifuge tube with a phosphate buffer (25 ml, 0.1 M, pH 6.0) and an HCl solution (2 ml, 1 M). The pH was adjusted to 3.5 with 1 M HCl or 1 M NaOH. Freshly prepared pepsin solution (1 ml, 10 g/l) was added and each centrifuge tube was covered with a plastic lid and placed in the heating chamber at 39°C under constant magnetic stirring. The incubation times with pepsin were 0, 30, 60 and 90 min. Following the 90-min incubation with pepsin, the protein digestion in the small intestine was simulated by adding 10 ml phosphate buffer (0.2 M, pH 6.8) and 3 ml, 1 M, NaOH to the samples and the pH was adjusted to 6.8 with 1 M HCl or 1 M NaOH. Freshly prepared pancreatin solution (1 ml, 100 g/l) and bile solution (1 ml, 150 g/l) were added and the incubation with pancreatin was continued in the heating chamber at 39°C under constant magnetic stirring. The incubation times with pancreatin were 0, 30, 60, 90, 120, 150, 180 and 210 min. To correct for the N of the enzymes added, blanks (triplicates) without protein sources were analysed. The samples taken during the sequential incubation with pepsin and pancreatin and from blanks were cooled on ice for 10 min and then centrifuged (30 min, 20 000×g, 4°C) to separate the insoluble protein fraction (IPF) and soluble protein fraction (SPF) (Zayas, Reference Zayas1997). After centrifugation, the supernatant containing the soluble fraction was transferred to a 50 ml volumetric flask and the flask was made up to 50 ml with de-mineralised water. One milliliter of soluble fraction was transferred to a 2 ml Eppendorf tube (Eppendorf AG, Hamburg, Germany) and 20% sulfosalicylic acid was added to the sample in a 1 : 1 (v/v) ratio. The sample was centrifuged (10 min, 12 000×g, 4°C) to separate the soluble high molecular weight (>500 Da) peptides (HMW) and the soluble low molecular weight (<500 Da) peptides (LMW) (Greenberg and Shipe, Reference Greenberg and Shipe1979). The IPF was freeze-dried and ground using an ultracentrifugal mill with a 1 mm sieve (ZM200) before chemical analysis. The N content of IPF and LMW was analysed using the method described above.
Size exclusion chromatography
The molecular weight distribution of hydrolysates in the SPF was analysed using an ÄKTA micro system (GE Healthcare, Uppsala, Sweden) with a Superdex Peptide PC 3.2/30 column (GE Healthcare). The eluent used was a 10 mM potassium phosphate buffer with 150 mM NaCl and 2% SDS. All samples were first boiled for 5 min to inactivate the enzymes and then diluted with the eluent in a 1 : 1 (v/v) ratio. Thereafter, samples were centrifuged (10 min, 20 000×g, 20°C), and 50 μl of the sample were injected onto the column. The absorbance was measured at 214 nm. For the calibration curve, β-lactoglobulin (18 360 Da), aprotinin (6512 Da), vitamin B12 (1335 Da), glutathione (307 Da) and glycine (75 Da) were used. The chromatograms obtained were separated into molecular weight ranges of>10 kDa, 10 to 5 kDa, 5 to 3 kDa, 3 to 1 kDa and<1 kDa by calculating the eluent volumes based on the calibration curve.
Calculations and statistical analysis
The N solubility was calculated by equation (1):
 $${\rm N }\,{\rm solubility\ (\%){\equals}}{{{\rm N}_{{{\rm sample}}} -\left( {{\rm N}_{{{\rm IPF}}} {\rm -N}_{{{\rm blank}}} } \right)} \over {{\rm N}_{{{\rm sample}}} }}{\rm {\times}100 \,\%\,}$$
where Nsample (mg) is the amount of N in 1 g of protein source, NIPF (mg) is the amount of N in the IPF during the sequential incubation with pepsin and pancreatin and Nblank (mg) is the amount of N in the IPF of blank samples during the sequential incubation with pepsin and pancreatin.
The N present in LMW was calculated by equation (2):
 $$\eqalignno{ {\rm Soluble}\,{\rm low}\,{\rm molecular}\,{\rm weight}\,{\rm peptides}\,{\rm fraction }\left( {{\rm \%}} \right) \cr {\rm {\equals} }{{{\rm N}_{{{\rm LMW}}}- {\rm N}_{{{\rm blank}}} } \over {{\rm N}_{{{\rm sample}}} }}{\rm {\times}100 \,\%\,}$$
where NLMW (mg) is the amount of N in the LMW during the sequential incubation with pepsin and pancreatin, Nblank (mg) is the amount of N in the LMW of blank samples during the sequential incubation with pepsin and pancreatin, and Nsample (mg) is the amount of N in 1 g of protein source.
The kinetics of N solubilisation and the release of LMW for different protein sources during the incubations were described using an exponential equation (Ørskov and McDonald, Reference Ørskov and McDonald1979) (equation (3)):
 $$D_{t} {\rm {\equals} }D_{0} {\plus}\Delta {\rm D{\times}}\left( {{\rm 1 {\minus}}e^{{{\rm {\minus}k}t}} } \right)$$
where D t (%) is the N solubility or the N present in LMW at incubation time t (min), D 0 (%)the N solubility or the N present in LMW at 0 min, ∆D (%) is maximum N solubility or the N present in LMW (asymptote) corrected for D 0 and k the rate constant.
The kinetics of N solubilisation of MW during pepsin hydrolysis and the kinetics the release of LMW of MW during pancreatin hydrolysis were described using a linear equation (equation (4)) as these data did not fit the exponential equation.
 $$D_{t} {\rm {\equals}}D_{0} {\rm {\plus}k}t$$
where D t (%) is the N solubility or the N present in LMW at incubation time t (min), D 0 (%)the N solubility or the N present in LMW at 0 min and k the rate constant.
Data on N present in the IPF, HMW and LMW as percentage of total N during the sequential incubation with pepsin and pancreatin were analysed by ANOVA using the GLM procedure of SAS (version 9.3; SAS Institute Inc., Cary, NC, USA) with protein source, time and the interaction between protein source and time as fixed effects. Incubation replicate was the experimental unit. All dependent variables were tested for normality and non-normal distributed data were log transformed. Probability levels of less than 5% were considered to be statistically significant, and levels between 5% and 10% were considered a trend.
Results
Chemical composition of protein source
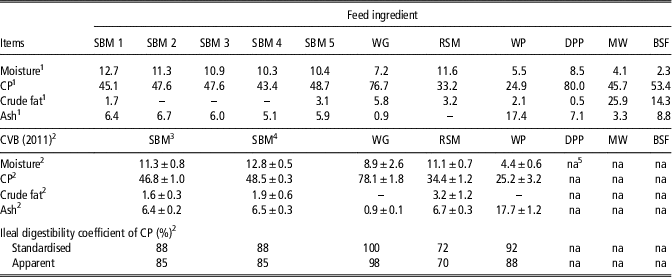
The analysed chemical composition of the protein sources is presented in Table 1. The SBMs had a mean CP content of 46.5±2.2% (SD). The CP content of the other protein sources ranged from 24.9% for WP to 80.0% for DPP.
Chemical composition (g/100 g sample) and apparent ileal protein digestibility of protein sources

SBM=soya bean meal; WG=wheat gluten; RSM=rapeseed meal; WP=whey powder; DPP=dried porcine plasma protein; MW=meal worm; BSF=black soldier fly larvae.
1 Analysed values.
2 Mean values and standard deviations as reported by CVB (2016).
3 SBM with a crude fibre content smaller than 4% and a CP content smaller than 48%.
4 SBM with a crude fibre content smaller than 4% and a CP content larger than 48%.
5 Not available.
Separation of soluble nitrogen into high molecular weight fraction and low molecular weight fraction
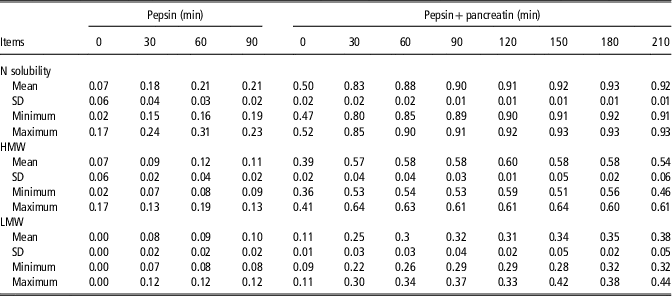
Before the start of incubation with pepsin, the five batches of SBM showed a mean N solubility of 7±6%. The soluble N was only present in HMW (Table 2). Between 0 and 30 min of the incubation with pepsin, the N solubility of SBMs increased from an average of 7% to 18%. At the end of incubation with pepsin (90 min), the SBMs showed a mean N solubility of 21±2%, of which 10% was present in LMW and 11% in HMW. After the incubation with pepsin, pH of the incubation solutions was adjusted from 3.5 to 6.8. This change of pH resulted in an increased N solubility of SBMs from an average of 21% to 50%, mainly related to an increased solubility of HMW (from an average of 11% to 39%). During the incubation with pancreatin, the N solubility of SBMs increased from an average of 50% to 83% between 0 and 30 min. At the end of incubation with pancreatin (210 min), SBMs showed a mean N solubility of 92±1%, of which 38% was present in LMW and 54% in HMW.
Nitrogen (N) solubility and N present in the soluble high molecular weight peptide fraction (HMW) and the soluble low molecular weight peptide fraction (LMW) as a proportion of total N of five different batches of soya bean meal at different time points during the sequential incubation with pepsin and pancreatin

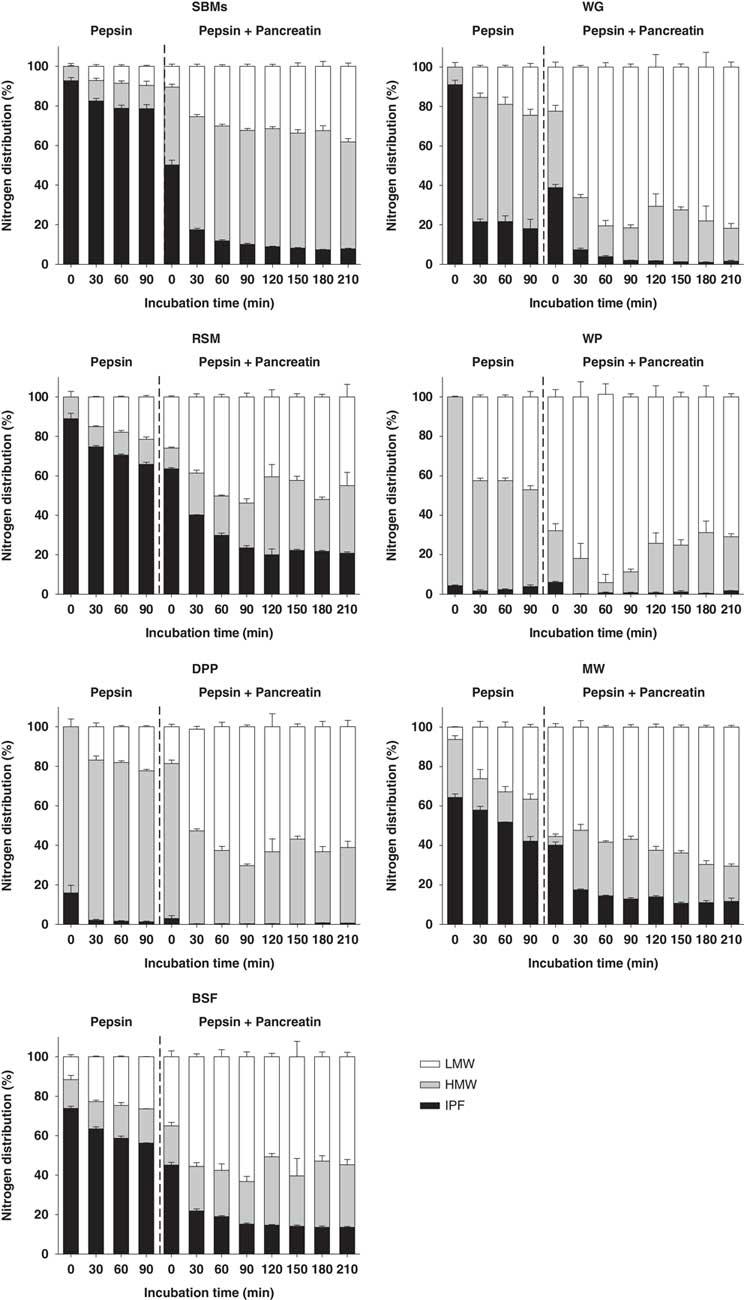
For the other protein sources, before the start of incubation with pepsin, the N solubility ranged from 9% for WG to 95% for WP. For MW and BSF, 6% and 11% of total N was present in LMW, respectively. For the other protein sources, soluble N was only present in HMW (Figure 1). The N solubility of WG, RSM, MW and BSF increased during the sequential incubation with pepsin and pancreatin and was affected by the interaction between protein source and incubation time (P<0.001) (Table 3). The N solubility of these four protein sources ranged from 34% for RSM to 82% for WG at the end of incubation with pepsin, and from 79% for RSM to 98% for WG at the end of incubation with pancreatin. Similar to what was observed in SBMs, the changes in N solubility occurred mainly in the initial phase (between 0 to 30 min) of both the incubation with pepsin and with pancreatin. In contrast, the N solubility for WP and DPP remained high with values 98% and 99%, respectively, during the sequential incubation with pepsin and pancreatin.
Nitrogen present in the insoluble protein fraction (IPF), the soluble high molecular weight peptide fraction (HMW) and the soluble low molecular weight peptide fraction (LMW) of soya bean meal (SBM), wheat gluten (WG), rapeseed meal (RSM), whey powder (WP), dried porcine plasma protein (DPP), meal worm (MW) and black soldier fly larvae (BSF) as percentage (%) of total N at different time points during the sequential incubation with pepsin and pancreatin. Values are means±SEM calculated for triplicate (n=3).

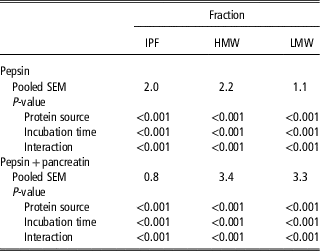
Effect of protein source, incubation time and their interaction on the nitrogen present in the insoluble protein fraction (IPF), the soluble high molecular weight peptide fraction (HMW) and the soluble low molecular weight peptide fraction (LMW) as percentage of total N during the sequential incubation with pepsin and pancreatin

The N present in the HMW and LMW as percentage of total N during the sequential incubation with pepsin and pancreatin showed an interaction between protein source and time of incubation (P<0.001) (Table 3). The differences in the percentage of N present in the HMW and LMW were large among protein sources (Figure 1). At the end of incubation with pepsin, N present in LMW ranged from 21% for RSM to 44% for WP. Rape seed meal, MW and BSF showed a higher percentage of N in the LMW compared to the HMW. At the end of incubation with pancreatin, N present in the LMW ranged from 45% for RSM to 82% for WG. All protein sources showed a higher percentage of N in the LMW compared to the HMW at the end of incubation with pancreatin with the exception of SBMs.
Changes in molecular weight distribution of soluble proteins and peptides during in vitro digestion
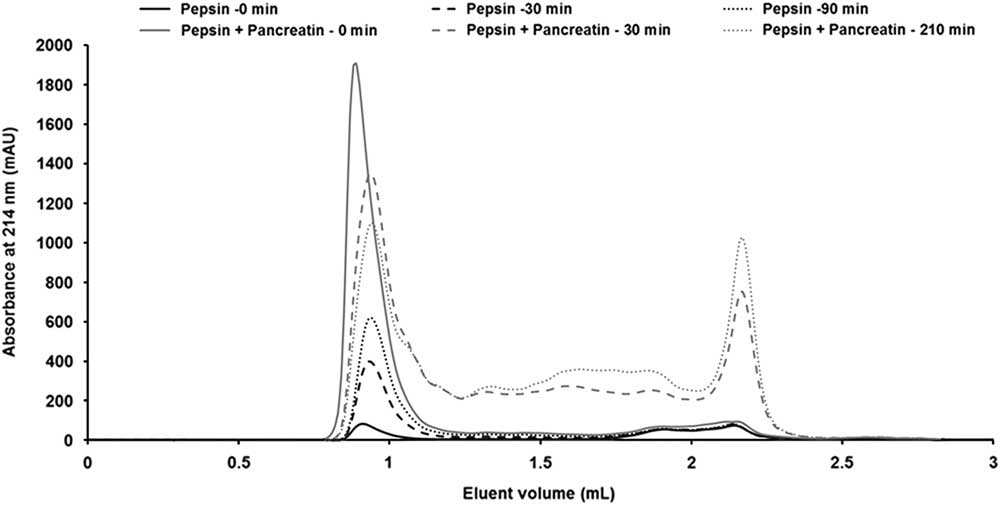
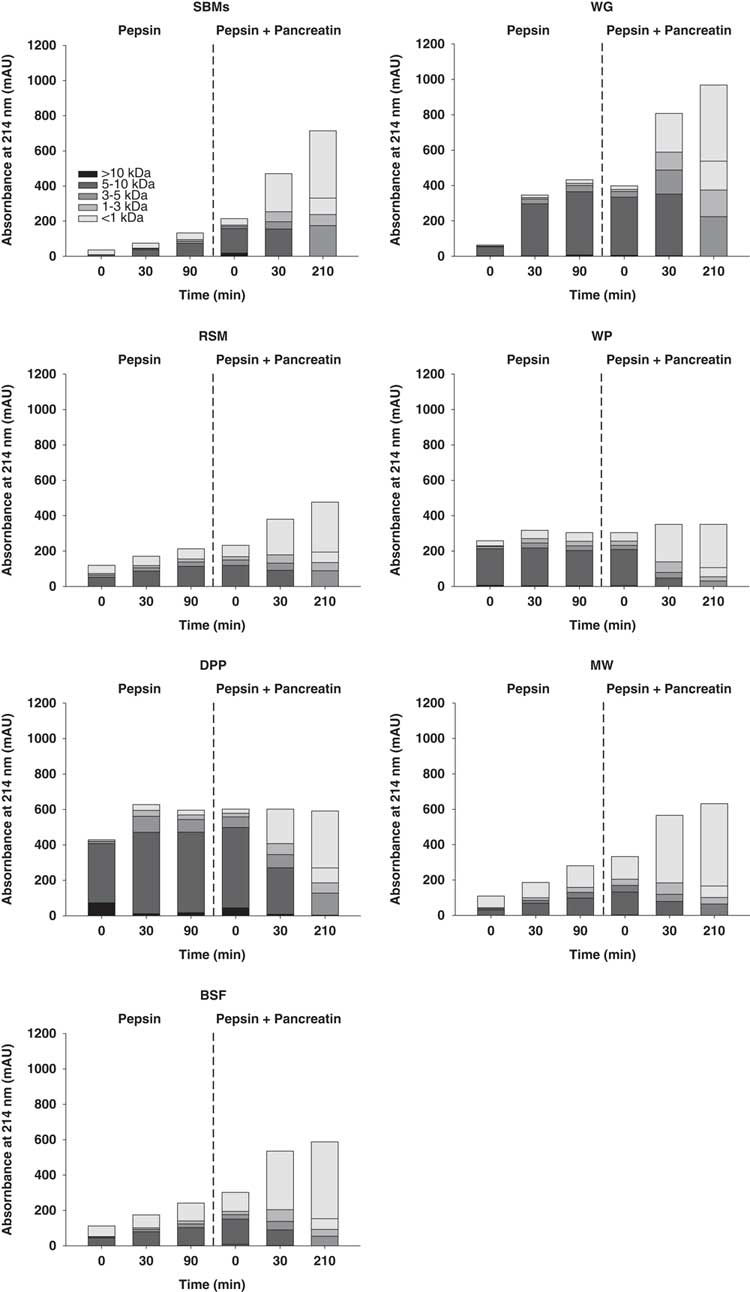
An increase of total absorbance at 214 nm was observed from the SEC chromatogram of SBMs during the sequential incubation with pepsin and pancreatin (Figure 2). During the incubation with pepsin, the amount of peptides with a molecular weight range of 5 to 10 kDa increased (Figure 3). During the incubation with pancreatin, the amount of peptides with a molecular weight range of 5 to 10 kDa decreased, whereas the amount of peptides with a molecular weight smaller than 1 kDa increased. Wheat gluten, RSM, MW and BSF behaved similar to the SBMs, with respect to total absorbance as well as the changes in molecular weight distribution of soluble proteins and peptide. In contrast, the total absorbance at 214 nm of WP and DPP stayed constant during the sequential incubation with pepsin and pancreatin. During the sequential incubation with pancreatin, the amount of peptides with a molecular weight range of 5 to 10 kDa decreased, whereas the percentage of peptides with a molecular weight range of 1 to 5 kDa increased.
Size-exclusion chromatograms of soluble proteins and peptides of one batch of soya bean meal at different time points during sequential incubation with pepsin and pancreatin.

Molecular weight distribution (>10 kDa; 5 to 10 kDa; 3 to 5 kDa; 1 to 3 kDa; <1 kDa) of the soluble proteins and peptides of the soya bean meals (SBMs), wheat gluten (WG), rapeseed meal (RSM), whey powder (WP), dried porcine plasma protein (DPP), meal worm (MW) and black soldier fly larvae (BSF) at different time points during the sequential incubation with pepsin and pancreatin.

Kinetics of nitrogen solubilisation and the release of low molecular weight peptides
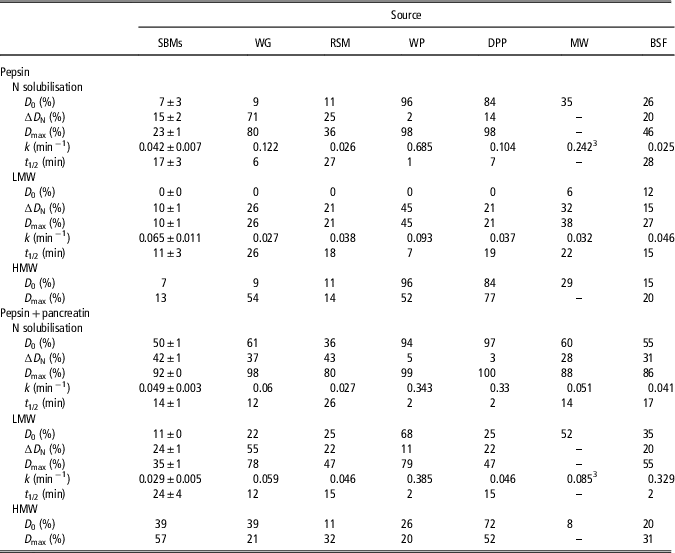
During the incubation with pepsin, SBMs had a mean N solubilisation rate of 0.042±0.007 min−1 with a mean maximum increase (∆D) of 15±2% (Table 4). As for the kinetics of the release of LMW peptides, SBMs had a mean rate of 0.065±0.011 min−1 with a mean maximum increase of 10±1%. During the incubation with pancreatin, SBMs had a mean N solubilisation rate of 0.049±0.003 min−1 with a mean maximum increase of 42±1%. As for the kinetics of the release of LMW peptides, SBMs had a mean rate of 0.029±0.005 min−1 with a mean maximum increase of 24±1%. There were large differences between the kinetics of N solubilisation and the release of LMW for the different protein sources (Figure 4). During the incubation with pepsin, the N solubilisation rate ranged from 0.025 min−1 for BSF to 0.685 min−1 for WP, and the release rate of LMW ranged from 0.027 min−1 for WG to 0.093 min−1 for WP. During the incubation with pancreatin, the N solubilisation rate ranged from 0.027 min−1 for RSM to 0.343 min−1 for WP, and the release rate of LMW peptides ranged from 0.046 min−1 for RSM to 0.385 min−1 for WP (Table 4).
Rescaled kinetics curves (using D 0 as 0% and D max as 100%) of N solubilisation (a) and the release of low molecular weight peptides (LMW) (b) of one batch of soya bean meal (SBM), wheat gluten (WG) and dried porcine plasma protein (DPP) during sequential incubation with pepsin and pancreatin.

Parameter estimatesFootnote 1 characterising the kinetics of nitrogen (N) solubilisation and the kinetics of the release of low molecular weight peptide (LMW) and high molecular weight peptide (HMW)Footnote 2 of protein sources during the sequential incubation with pepsin and pancreatin

SBMs=soya bean meals; WG=wheat gluten; RSM=rapeseed meal; WP=whey powder; DPP=dried porcine plasma protein; MW=meal worm; BSF=black soldier fly larvae.
1 D 0 (%) is the N percentage at 0 min; ∆D (%) maximum N solubility or the N present in LMW (asymptote) corrected for D 0; D max (%) is the sum of D 0 and ∆D (asymptote); k (min−1) is the rate constant; t 1/2 (min) is the time where half of ∆D is reached.
2 Values for HMW were calculated by the difference between values for N solubilisation and values for LMW.
3 Data were fitted using a linear equation: Dt=D 0+kt.
Discussion
In the present study, in vitro protein digestion kinetics of protein sources differing in origin, chemical composition and in vivo protein digestibility was studied using a two-step in vitro method with sequential incubation with pepsin and pancreatin. Multiple batches of SBM as well as single batches of WG, RSM, WP, DPP, MW and BSF were evaluated. The chemical composition of the batches of SBMs, WG, RSM and WP was close to the tabulated values (CVB, 2016), indicating that the batches used in the current study were representative for these ingredients as protein sources in animal feeds with respective to the chemical composition.
In the present study, in vitro protein digestibility values are represented by the values for maximum N solubility after the incubation with pancreatin. Values for SBM, RSM, MW and BSF (92%, 80%, 88% and 86%, respectively) are comparable to those reported in literature in which similar in vitro methods were applied (93%, 84%, 90% and 91%, respectively) (Cone and van der Poel, Reference Cone and van der Poel1993; Boisen and Fernández, Reference Boisen and Fernández1995; Bosch et al., Reference Bosch, Zhang, Oonincx and Hendriks2014). The kinetics of N solubilisation was established only for the potentially soluble fraction, corrected for the soluble fraction at the start of the in vitro incubations (D 0N). ∆D N differed greatly among protein sources, ranging from 2% for WP to 71% for WG. During the sequential incubation with pepsin and pancreatin, WP showed a higher rate of N solubilisation than the other protein sources. The N solubility of WP, however, was already high before the start of enzymatic incubations, resulting in a low ∆D N for WP (2% and 5% during the incubations with pepsin and pancreatin, respectively). A rate estimated based on a small ∆D fraction provides limited information compared to a rate based on a large ∆D fraction. The N solubilisation rates of WP should, therefore, be viewed with caution. In the present study, WG showed a greater rate of N solubilisation than SBM during the incubation with pepsin. This result is not in agreement with data from (Wilfart et al., Reference Wilfart, Jaguelin-Peyraud, Simmins, Noblet, Van Milgen and Montagne2008), who found no difference in the rate of N solubilisation for SBM and wheat during the incubation with pepsin.
The kinetics of the release of LMW was established only for the potentially releasable fraction corrected for the fraction already present at the start of the in vitro incubations (D 0LMW). This fraction also differed largely among protein sources, ranging from 11 for WP to 55% for WG. Whey protein showed a faster release of LMW than other protein sources. Wheat gluten showed the slowest release during the incubation with pepsin and SBMs during the incubation with pancreatin. At the end of sequential incubation with pepsin and pancreatin, WG and WP showed the highest percentage of LMW in the soluble fraction and SBMs the lowest. Under in vivo conditions, the release of LMW is expected to be higher than measured in vitro. This relates to the action of brush border aminopeptidases, which are involved in the final step of protein digestion. The brush border aminopeptidases contribute to a substantial release of LMW (Silk et al., Reference Silk, Grimble and Rees1985; Picariello et al., Reference Picariello, Miralles, Mamone, Sánchez-Rivera, Recio, Addeo and Ferranti2015).
Luo et al. (Reference Luo, Boom and Janssen2015) showed that the in vitro hydrolysis of whey protein using pepsin followed the ‘zipper’ type of protein hydrolysis mechanism, meaning that proteins are hydrolysed into peptides with a very wide range of molecular weights during the various stages of the hydrolysis process (Adler-Nissen, Reference Adler-Nissen1976). Assuming the hydrolysis of protein sources using pepsin and pancreatin also follows the ‘zipper’ type of protein hydrolysis mechanism, a substantial quantity of peptides with intermediate molecular weight were expected during the in vitro incubations in the present study. Such a substantial quantity of intermediate peptides, however, was not observed. Instead, a decrease of intact proteins and HMW and a concomitant and immediate increase of LMW were observed. These results suggest that intact proteins from the protein sources are hydrolysed in one sequence to LMW peptides and free amino acids by the proteolytic action of pepsin and proteases in pancreatin.
It should be emphasised that in the present study, a high rate of N solubilisation did not correlate to a fast release of LMW for each of the protein sources evaluated. For instance, WG showed a high rate of N solubilisation but a slow release of LMW during the incubation with pepsin. Compared to the in vitro protein digestion kinetics based on N solubilisation, the in vitro protein digestion kinetics based on the release of LMW might be a better prediction of in vivo protein digestion kinetics. In vivo, dietary proteins need to be hydrolysed into free amino acids and di- and tri-peptides before absorption as these are the main forms of N that can be absorbed by enterocytes in the small intestine (Webb et al., Reference Webb, Matthews and DiRienzo1992; Ganapathy et al., Reference Ganapathy, Ganapathy and Leibach2000). Therefore, a fast release of free amino acids and di- and tri-peptides from the protein sources results in a fast absorption in the GIT, thereby leading to a more rapid postprandial appearance of amino acids and peptides in blood after ingestion of a meal. There is limited published information available on the correlation between in vitro and in vivo protein digestion kinetics of feed ingredients for pigs. In contrast to protein digestion kinetics, starch digestion kinetics, both in vitro and in vivo, for pigs has been extensively studied. In pigs, portal glucose appearance is strongly related to in vitro release of glucose (R 2=0.89) by starch digestion. Fast digestible starch, such as rice starch, showed a fast release of glucose in vitro and a rapid portal appearance of glucose in vivo. In contrast, slow digestible starch, such as pea starch, showed a slower release of glucose in vitro and a delayed portal appearance of glucose in vivo (van der Meulen et al., Reference van der Meulen, Bakker, Smits and de Visser1997; van Kempen et al., Reference van Kempen, Regmi, Matte and Zijlstra2010). Similar to glucose as the end product of starch digestion, free amino acids and di- and tri-peptides are the end products of protein digestion. Thus, the kinetics of the release of LMW might better reflect in vivo protein digestion kinetics than the kinetics of N solubilisation. Digestion kinetics of protein can influence postprandial appearance of free amino acids and peptides in blood in time. Protein sources with a fast release of LMW during the sequential incubation with pepsin and pancreatin can be expected to be digested faster in vivo, resulting in an early appearance of amino acids and peptides in the blood after a meal. Information on protein digestion kinetics can be used to further develop the concept of nutrient (i.e. energy and protein) synchronisation, which could improve overall protein utilisation (van den Borne et al., Reference van den Borne, Schrama, Heetkamp, Verstegen and Gerrits2007; Drew et al., Reference Drew, Schafer and Zijlstra2012).
The differences in the extent and the kinetics of protein digestion among protein sources can be related to various factors. Pepsin, trypsin and chymotrypsin are specific enzymes, meaning they can only cleave certain peptide bonds. The number and accessibility of these cleavage sites for enzymes depend on the amino acid sequence of polypeptide chains and their conformation. For instance, rapeseed albumins showed a higher resistance to pepsin hydrolysis in vitro compared to rapeseed globulins (Malabat and Rabiller, Reference Malabat and Rabiller2001). This is likely due to the compact conformation of rapeseed albumins due to the presence of disulphide bonds (Schwenke et al., Reference Schwenke, Drescher, Zirwer and Raab1988). The accessibility of the cleavage sites for enzymes also depends on the physicochemical properties of the protein. A soluble form of casein (i.e. Na+-caseinate) was hydrolysed faster in vitro than native casein because soluble proteins have a better accessibility to enzymes than insoluble proteins (Tonheim et al., Reference Tonheim, Nordgreen, Høgøy, Hamre and Rønnestad2007). The non-protein constituents can interact with the proteins in the protein source. For instance, tannins present in legume seeds and phytate present in soya beans can bind to proteins. The bound proteins are not susceptible to enzymatic hydrolysis by digestive enzymes, leading to a reduced protein digestibility in pigs (Mangan, Reference Mangan1988; Selle et al., Reference Selle, Cowieson, Cowieson and Ravindran2012). Thermal treatment is commonly involved in the processing of ingredients or complete diets for pigs to improve nutrient digestibility (Johnston et al., Reference Johnston, Hancock, Hines, Behnke, Kennedy, Maloney, Traylor, Sorrell, Goodband and Tokach1998) or to eliminate anti-nutritional factors (van der Poel, Reference van der Poel1990). Severe thermal treatment, however, induces protein aggregation, resulting in a higher resistance to digestive enzymes (Sánchez-Rivera et al., Reference Sánchez-Rivera, Ménard, Recio and Dupont2015).
Conclusion
The present study showed substantial differences in in vitro protein digestion kinetics among protein sources, as measured via kinetics of N solubilisation and release of free amino acids and soluble LMW peptides. The rate of release of LMW was not correlated to the rate of N solubilisation for each of the protein sources evaluated. In vitro protein digestion kinetics as determined by the kinetics of release of LMW might be a preferred method for the prediction of in vivo protein digestion kinetics.
Acknowledgements
The authors gratefully acknowledge the financial support from the Wageningen UR ‘IPOP Customized Nutrition’ programme financed by Wageningen UR (Wageningen, The Netherlands), the Dutch Ministry of Economic Affairs, Agriculture & Innovation (The Hague, The Netherlands), WIAS graduate school (Wageningen, The Netherlands); Nutreco (Boxmeer, The Netherlands) and Darling Ingredients International (Irving, TX, USA). The preliminary results have been published in the Proceedings of the 13th Digestive Physiology of Pig, 19 to 21 May, 2015, Kliczków, Poland.
Declaration of interest
The authors declare that they have no conflicts of interest.
Ethics statement
Not applicable.
Software and data repository resources
None of the data were deposited in an official repository.