Introduction
Soil water controls plant growth and influences a variety of soil processes including erosion, chemical exchange, microbial activity, transport of solutes and water, and pedogenesis. In the ice-free areas of Antarctica the duration and amount of available moisture is a crucial factor restricting the presence, abundance, and diversity of terrestrial biota (Cameron & Conrow Reference Cameron and Conrow1969). Antarctic ecosystem processes depend upon the proximity of water and the duration of liquid water availability (Barrett et al. Reference Barrett, Virginia, Hopkins, Aislabie, Bargagli, Bockheim, Campbell, Lyons, Moorhead, Nkem, Sletten, Steltzer, Wall and Wallenstien2006) and it is important to understand soil moisture and water regimes in Antarctica’s cold desert environment because of possible links to climate change. The fate of ground ice is affected by the amount and distribution of liquid water infiltrating the soil (Hagedorn et al. Reference Hagedorn, Sletten, Hallet, McTigue and Steig2010). Soil water availability and moisture recharge in Antarctic soils is dependent on whether snow and ice melts or sublimates. Modelling has shown that in the valley bottoms, sublimation far exceeds precipitation, and the amount of moisture that enters the ground is unclear because it sublimates prior to melting (Fountain et al. Reference Fountain, Hylen, Monaghan, Basagic and Bromwich2009). Thus, there is a need to characterize the average and dynamic changes in soil water contents of Antarctic soils.
Soil moisture and water holding capacity information for the soils in the McMurdo Sound region is limited (Balks et al. Reference Balks, Paetzold, Kimble, Aislabie and Campbell2002). Soil field moisture contents ranged from 1–5% (by weight) in the upper 10 cm for soils at Marble Point, Wright Valley, and Scott Base (Balks et al. Reference Balks, Paetzold, Kimble, Aislabie and Campbell2002). At undisturbed sites at Marble Point, soil moisture ranged from 0.5–10% (by weight) within the active layer (Campbell et al. Reference Campbell, Claridge and Balks1994). Campbell et al. (Reference Campbell, Claridge, Balks and Campbell1997) reported moisture contents in the active layer of about 5% (by weight) which diminished to about 1% or less on the Dry Valley floors and sides. Gooseff et al. (Reference Gooseff, Barrett, Doran, Fountain, Lyons, Porazinsk, Virginia and Wall2003) reported soil moisture values under snow patches in the Dry Valleys that ranged from 6.9–13.6% (by weight) compared to 0.4% (by weight) in bare soil.
The objectives of this study are to characterize the liquid soil water contents in the seasonally thawed layer (active layer) from a range of soil climate monitoring sites in the McMurdo Sound region. This paper contributes to the Latitudinal Gradient Project “Key Question 4: How does climate affect the availability and composition of free water?” by providing a benchmark soil moisture characterization for the mid-section of the latitudinal gradient range.
Materials and methods
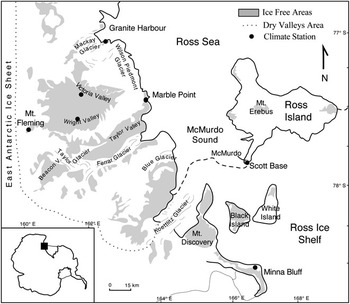
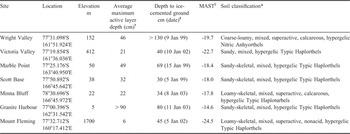
Seven soil climate stations (SCS) were established in the Ross Sea region of Antarctica. Two of the stations are in the McMurdo Dry Valleys, four border the Antarctic coast, and one is on Mount Fleming at the head of the Wright Valley (Fig. 1, Table I). The stations were established at Wright Valley, Victoria Valley, Marble Point, and Scott Base in January 1999, Mount Fleming in January 2002, and at Granite Harbour and Minna Bluff in January 2003. The Wright Valley SCS is located on the foot slope of an outwash terrace below Bull Pass. The site is on a colluvial fan derived from strongly weathered glacial till that is dominated by granodiorite with some diorite and other lithologies. The Victoria Valley site is in a former lake bed characterized by low-centred polygons on alluvial deposits (Hagedorn et al. Reference Hagedorn, Sletten and Hallet2007) that are dominated by granite with some marble and sandstone. Marble Point is a coastal station by the Ross Sea and is located on the nose slope of a fluvial terrace composed of weakly weathered glacial till dominated by gneiss and granite. The Scott Base site is on Ross Island, uphill from Scott Base, on a side-slope of scoriaceous basalt with minor inputs of glacially derived gravel and sand of mixed lithology. The Minna Bluff SCS is adjacent to the Ross Ice Shelf, and is located on patterned ground, which formed in ablation till that is dominated by basalt and granite rock fragments. The northernmost coastal station is Granite Harbour, located on a narrow (c. 60 m wide) fan/lateral moraine (dominated by granite rock materials) between a cliff-face and the edge of sea ice. Between the rocks is sand that may have been reworked by marine and glacial processes. The Mount Fleming SCS is located on patterned ground within a cirque, on the north side of Mount Fleming. The parent material is glacial till of mixed lithology that is dominated by dolerite, but sandstone and granite are common. Adlam et al. (Reference Adlam, Balks, Seybold and Campbell2010) provides additional information on the sites.
Map of the McMurdo Sound region showing locations of the seven soil climate stations.

Location of the seven soil climate stations and soil classifications.

† From Adlam et al. (Reference Adlam, Balks, Seybold and Campbell2010).
‡ Date ice-cemented ground was observed.
§ MAST = Mean Annual Soil Temperature.
* Soil Survey Staff (2006).
Soils pits were dug, by hand, at each site. The soil morphology on one of the pit faces was described and horizons sampled for chemical and physical characterization at the United States Department of Agriculture-Natural Resources Conservation Service (USDA-NRCS), National Soil Survey Center in Lincoln, Nebraska, USA. Soil descriptions are in Appendix A. Soil samples were air-dried (30–35°C) and sieved (< 2 mm). The > 2 mm fragments were sieved to determine the 2–5 mm and 5–20 mm fractions. The 20–75 mm fraction was measured, and the > 75 mm volume fraction was visually estimated in the field. A portion of the bulk sample was set aside to determine bulk density (< 75 mm fraction) by repacking cores of air-dried sample. Average bulk densities of similar textured soil in the USDA-NRCS characterization database were used as an estimate of the bulk density of the < 2 mm fraction of soil. Properties determined on the < 2 mm soil fraction were percent sand, silt, and clay (pipette method), water content at -1500 kPa tension (pressure-membrane extraction using sieved samples), and electrical conductivity (saturated paste). Data are reported on an oven-dry basis. All of the above methods are described in Burt (Reference Burt2004). Maximum active layer depths for the seven sites are reported in Adlam et al. (Reference Adlam, Balks, Seybold and Campbell2010).
Soil water content was measured with the hydra-probe sensor (Stevens Water Monitoring Systems, Portland, Oregon). The hydro-probe sends a 50 MHz electromagnetic signal into the soil and the reflected wave is associated with the dielectric permittivity of the soil, which is then related to the soil water content and conductivity. Output from the hydra-probe consists of four voltages that are converted using software provided by the manufacturer. The fourth voltage is soil temperature measured by a calibrated thermistor embedded in the sensor head. One of four calibration curves, provided by the manufacturer, was selected to convert voltages to volumetric water content depending on the texture of the soil (i.e. sand, silt, clay and loam). The sand calibration curve was used in this study. The probes temperature range is from -10°C to +65°C, and can only measure water in the liquid state. Liquid water in the soil can exist with ice at temperatures well below the normal freezing point of water (0°C), but the hydra-probe cannot detect water in the form of ice. Therefore, only water content values corresponding to soil temperatures > 0°C were used in this study to assure that only liquid water is present. If liquid water and ice exist, an underestimate of the water content will result. According to the manufacturer, the accuracy of the hydra-probe, knowing the general soil type (i.e. sandy), is less than +/- 0.02 m3 m-3, and the precision is typically +/- 0.003 m3 m-3 (Stevens Vitel 1994). Seyfried et al. (Reference Seyfried, Grant, Du and Humes2005) and Kelleners et al. (Reference Kelleners, Ferre-Pikal, Schaap and Paige2009) have shown that the hydra-probe can provide reliable and accurate measurements of soil water content under a variety of soil types and surface conditions, and that a sensor-specific calibration is not necessary for most applications. For saline soils, the hydra-probe will still provide accurate dielectric permittivity measurements up to 1.5 S m-1 (Stevens 2007). Hydra-probe sensors were placed in duplicate at the 2, 20, 30, 50 and 120 cm depths at Wright Valley; at the 3, 10 and 33 cm depths at Victoria Valley; in triplicate at the 2, 20, 50 and 80 cm depths at Marble Point; in triplicate at the 2, 15, 25 and 40 cm depths at Scott Base; in duplicate at the 10, 15, 20 and 37 cm depths at Minna Bluff; at the 2, 5, 15, 25, 45 and 75 cm depths at Granite Harbour; and in duplicate at the 7, 15 and 30 cm depths at Mount Fleming.
Soil temperature was measured with both multiple thermistor probes (Measurement Research Corporation, Gig Harbor, Washington) and single thermistor temperature sensors (model 107; Campbell Scientific, Logan, Utah), except at Mount Fleming where only single thermistor sensors were used. Incoming solar radiation was measured with a pyranometer (model LI200X; Campbell Scientific). Wind speed and direction were measured with a Met One (model 0343; Campbell Scientific) or R.M. Young (model 05103; Campbell Scientific) sensor. Relative humidity was measured with a Vaisala capacitive relative humidity sensor (model HMP45C or HMP35C; Campbell Scientific), which also measured air temperature with a platinum resistance temperature detector, mounted in a gill radiation shield. At most stations, air temperature was also measured with a single thermistor probe (model 107; Campbell Scientific) mounted inside a gill radiation shield. At the Wright Valley SCS, air temperature was measured with a R.M. Young RTD Probe (model 43347; Campbell Scientific) mounted inside a gill radiation shield. The wind and solar radiation sensors were mounted three metres above the ground. The relative humidity/air temperature sensor was mounted 1.6 m above the ground, and the air temperature sensor was mounted 2 m above the ground.
All sensors were connected to a data logger with a wiring panel (CR10X-2M; Campbell Scientific, Logan, Utah) and a 16-channel 4-wire input relay multiplexer (Campbell Scientific) that were enclosed in a water tight 40 x 45 x 23 cm fibreglass-reinforced polyester enclosure (model ENC16/18; Campbell Scientific). Power was supplied by three 12 V, 24 Ahr sealed rechargeable batteries (BP24; Campbell Scientific) either enclosed with the data logger or enclosed in separate containers on the ground. Batteries were powered by a 20 Watt solar panel and regulated through a 12 V charging regulator (model CH100 or CH12R; Campbell Scientific). The enclosure was mounted on a 10 foot galvanized steel tripod with a mast and cross arm (model CM10; Campbell Scientific).
Measurements of atmospheric variables were made at 10 second intervals, and soil measurements were made at 20 minute intervals. All measurements were averaged every hour and the hourly averages recorded in the datalogger and storage module (Campbell Scientific, Logan, Utah). Data was collected from the climate stations annually.
Mean daily and seasonal water contents, as well as mean liquid water contents for the entire monitoring period, were calculated. The water contents reported were not corrected for coarse fragments and represent the volume of water in the < 5 mm fraction of the soil - that which can fit between the tines of the sensor. The hydra-probe effective sensing volume is a cylinder c. 2.5 cm in diameter and 6 cm in length bounded by the three outer tines, the probe head, and the free end of the tines. The resulting probe output parameters reflect an average value over this sensing volume.
Results and discussion
All the soils are classified as Gelisols according to Soil Taxonomy (Soil Survey Staff 2006) because they have permafrost within one metre of the soil surface (Table I). In Antarctica, permafrost does not necessarily correspond to the depth of ice-cemented ground because dry permafrost can exist (due to insufficient moisture in the soil to form ice-cement). The difference between the observed depth to ice-cement and the maximum active layer depth is the dry permafrost. Only at the Granite Harbour and Scott Base SCSs does the depth to ice-cemented ground correspond to permafrost. The depth to ice-cemented ground is used in classifying soils. The soil at the Wright Valley SCS has a depth to ice-cemented ground that is > 70 cm, which puts the soil in the taxonomic great group Anhyorthels, which are further classified based on the type and presence of salts. There was an accumulation of nitrates in the profile at the Wright Valley site, which classifies as a Nitric Anhyorthels (Table I). Source of the nitrates could be from snowfall (Witherow et al. Reference Witherow, Lyons, Bertler, Welch, Mayewski, Sneed, Nylen, Handley and Fountain2006) and has been attributed to a combination of tropospheric transport of photochemically produced HNO3 and HNO3 formed in the stratosphere (Michalski et al. Reference Michalski, Bockheim, Kendall and Thiemens2005). There is strong evidence that the freezing process transports ions downward in the soil (Lundin & Johnsson Reference Lundin and Johnsson1994). The Minna Bluff site has evidence of cryoturbation and was classified as a Haploturbel. The rest of the soils are noncryoturbated and default to Haplorthels. In the present study, all soils had a mean annual soil temperature (at a depth of 50 cm) that was lower than -10°C, which puts them in the hypergelic soil temperature class (Table I). Mount Fleming and the four coastal sites have soils that are dominated by rock fragments (> 2 mm in size), but have at least 10% fine earth material by volume, which puts them in the skeletal taxonomic family particle-size class (see Appendix A for rock fragment contents). Rock fragments (> 2 mm) influence soil hydraulic properties by affecting soil porosity and the tortuosity of water flow paths (Sauer & Logsdon Reference Sauer and Logsdon2002).
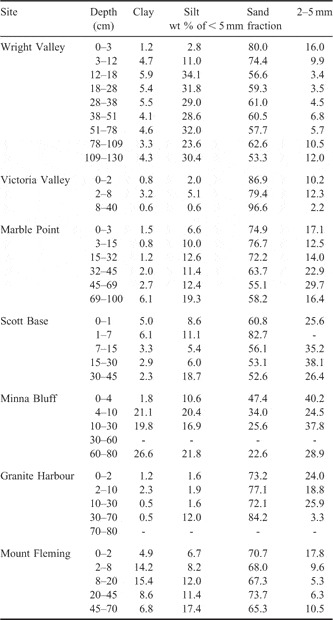
The size of the soil particles determines the amount of pore space and volume of water than can be held in the soil. In general, sand dominates the < 5 mm fraction of soil at all sites except at Minna Bluff, where the sand and 2–5 mm fractions dominate (Table II). Because of the coarse textures, all soils in this study have low water holding capacities. Furthermore, the soils contain numerous rock fragments > 5 mm in size (Appendix A) that take up space in the soil, reducing the total porosity, which further reduces the total water holding capacity of the whole soil. Water contents presented in this study are those of the < 5 mm fraction of soil. Water contents on whole soil basis would require subtracting out the total volume of fragments that are > 5 mm (Bower & Rice Reference Bower and Rice1984).
Soil particle and fine gravel (2–5 mm) distribution at the seven soil climate stations.
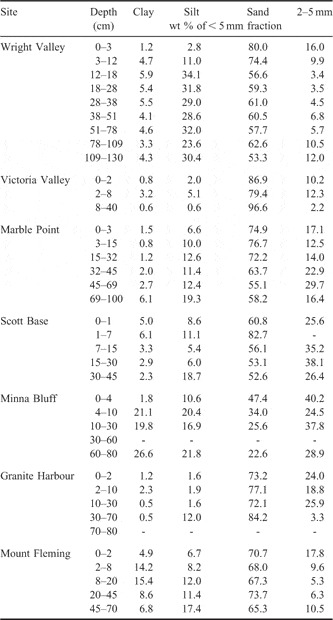
The Mount Fleming and Minna Bluff sites have the highest clay contents, between 14 and 27% of the < 5 mm fraction, with Minna Bluff having the greatest amount. The Wright Valley site contains the greatest amount of silt, ranging up to 35% of the < 5 mm fraction.
Active layer liquid water contents
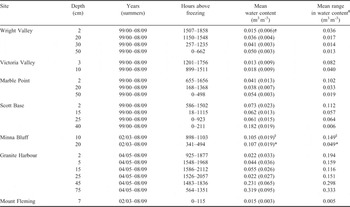
Measurable volumes of liquid water only occur when soils are near to or above 0°C. The depth and duration of soil thaw (Tables I & III) show that temperatures > 0°C are limited to brief summer periods. The depth of thaw was greatest at Granite Harbour and smallest at Mount Fleming (Table I). The duration of thaw varied markedly between sites and seasons ranging from no thawing in some years at Mount Fleming to over 2000 hours (or about 12 weeks) in some summers at Granite Harbour (Table III).
Mean water contents and range in water contents, and hours above freezing in the active layer for each depth at the seven climate stations.

† Number in parentheses is the standard deviation.
‡ The mean difference between the season minimum and maximum water content values.
§ Summer season 08/09.
* Summer seasons 04/05 and 05/06.
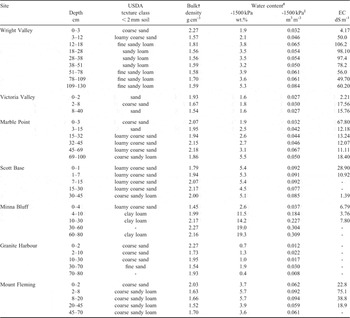
Volumetric water contents (measured when temperatures were > 0°C) at each depth were averaged (across replicates and summer seasons) for the entire monitoring period and are presented in Table III. Mean water contents ranged from 0.013 m3 m-3 near the surface at Victoria Valley to 0.33 m3 m-3 near the ice-cemented layer, in soil, along the coast at Granite Harbour. The near-surface soils at the Dry Valley sites and at Mount Fleming were the driest, ranging from 0.013–0.015 m3 m-3 water contents. The coastal sites (i.e. Granite Harbour, Scott Base, Marble Point and Minna Bluff) have greater water contents, which is expected and has been shown by others (Cameron & Conrow Reference Cameron and Conrow1969, Barrett et al. Reference Barrett, Virginia, Hopkins, Aislabie, Bargagli, Bockheim, Campbell, Lyons, Moorhead, Nkem, Sletten, Steltzer, Wall and Wallenstien2006). Marble Point is the driest of the coastal sites, and has similar subsurface water contents, but greater near-surface water contents compared to the inland sites. At all sites where there was more than one depth of recorded moisture, water contents generally increased with depth in the active layer (Table III). The largest water contents were found near the ice-cemented permafrost. Water contents at Minna Bluff were consistently higher, on average, throughout the active layer than at the other sites (0.105–0.107 m3 m-3). This could be due to the higher water holding capacity of the fine earth fraction (i.e. clay loam texture), which will have a greater water holding capacity than the sandier textures. The retention of water at -1500 kPa is about three times higher at Minna Bluff (12–14% by weight) than that in the other soils (0.4–5% by weight), indicating a much higher water holding capacity at low tensions (Table IV).
Selected soil properties from the pedons at the seven soil climate stations.

† Bulk density of the < 75 mm fraction of soil.
‡ Determined on the < 2 mm soil fraction.
§ Estimated by multiplying by a bulk density estimate of the < 2 mm soil fraction.
The range in water content at each depth, averaged across summer seasons, was generally greater near the surface and decreased with depth (Table III). The greater range in water contents near the surface was due to occasional surface wetting events during the monitoring period. Precipitation occurs primarily as snow and can occur at any time of the year (Fountain et al. Reference Fountain, Hylen, Monaghan, Basagic and Bromwich2009). Coastal sites tend to have more snowfall than inland sites. In the Dry Valleys, wind-drift snow is an important contribution to the total snow accumulation, which contributes about half the snow amounts (Fountain et al. Reference Fountain, Hylen, Monaghan, Basagic and Bromwich2009). Any accumulated snow either sublimates, or melts and then infiltrates the soil (i.e. wetting event) or evaporates.
For mineral soils, the thermal diffusivity increases with water content at low water contents (< 0.15 m3 m-3 for sandy soils) and then gradually decreases with increasing water contents at higher water contents (Jury et al. Reference Jury, Gardner and Garnder1991). The thermal diffusivity generally characterizes the rate at which a heat pulse will diffuse through the soil. Soils with high thermal diffusivity will rapidly adjust their temperature to that of their surroundings. Water contents of the soils in this study are generally much less than 0.15 m3 m-3, therefore small increases in water contents would increase the thermal diffusivity for short periods until the soil dried. The more wetting events and deeper penetration of the wetting events, the greater the potential to increase the thaw depth or its duration at a site.
Wright Valley
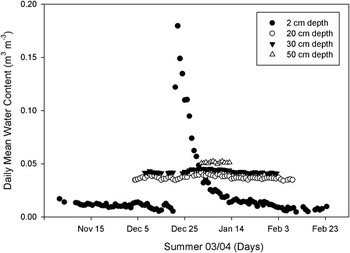
At the Wright Valley site, there were only two obvious wetting events over the entire ten year monitoring period where the water content increased from 0.02 to 0.05 m3 m-3 in the summer of 1999–2000 and from 0.02 to 0.20 m3 m-3 in the summer of 2003–04 (Fig. 2). The later wetting event took about 14 days to dry to the summer minimum water content, which can be considered air-dry. There are a few instances where the water content at the beginning of the thaw period, started out about 2% higher and then would dry to the season minimum. There was no detectable increase or decrease in water content at the 20 cm depth as a result of any wetting event, which indicates that liquid water from snowmelt did not reach the 20 cm depth at the Wright Valley site. The amount of water that infiltrated between the two replicates at this site did vary. Snow may accumulate on the leeward side of boulders and stones that can survive as snowmelt, creating variable amounts of infiltrated water. Sparse snow patches in the Dry Valleys are an important source of soil moisture (Gooseff et al. Reference Gooseff, Barrett, Doran, Fountain, Lyons, Porazinsk, Virginia and Wall2003). Isolated patches, up to 5 m in diameter, of moist surface soil were observed in the area of the Wright Valley Climate station a day or so after a snowfall event in January 2010. However, much of the snowfall sublimated within a few hours of falling with no visible soil moistening. The event was not detected by our sensors.
Daily mean soil liquid water contents in the active layer for the Wright Valley soil climate station in summer 2003–04.

Victoria Valley
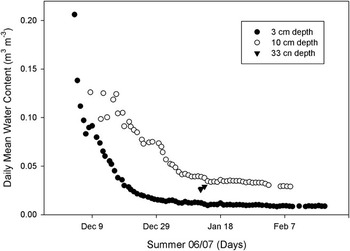
At the Victoria Valley SCS, there were one to three wetting events that occurred each summer over the course of the ten year monitoring period. Increases in water content ranged from 0.02 to 0.18 m3 m-3 (at the 3 cm depth) and up to 0.12 m3 m-3 at the 10 cm depth. At the beginning of the thaw period in 2002–03 and 2006–07, water contents started out at their maximum of 0.08 and 0.18 m3 m-3, respectively, at the 3 cm depth (Fig. 3). Snowmelt can infiltrate frozen soil (Spaans & Baker Reference Spaans and Baker1996) which can result in maximum water contents at the beginning of the thaw period. Also, since water can exist below freezing, it is possible that water existed slightly below 0°C when snowmelt infiltrated. Water did percolate to the 10 cm depth in both events. In the few hours when the 33 cm depth contained liquid water, the water content was generally greater than that at the 10 cm depth (data not shown). After each wetting event the soil would begin to dry out (become air-dry); taking up to 16 days to dry after reaching its maximum moisture content (at the 3 cm depth). Hagedorn et al. (Reference Hagedorn, Sletten, Hallet, McTigue and Steig2010) have shown (through the signature of water) that snowmelt is sufficient to compensate modelled sublimation rates, and therefore conserve ground ice at this Victoria Valley site.
Daily mean soil liquid water contents in the active layer for the Victoria Valley soil climate station in summer 2006–07.

Marble Point
At the Marble Point site there were generally one to four wetting events per summer over the ten year monitoring period. At the 2 cm depth, the maximum water content ranged from 0.05–0.21 m3 m-3 as a result of any given wetting event. Some wetting events occurred at the beginning of the thaw period, which generally produced the largest water contents. There were several small increases in water contents (< 0.05 m3 m-3) due to a wetting event. After each wetting event the soil would begin to dry. The water content at the 20 cm depth did increase in the summer of 2002–03 at all three replicates and in the summer of 2007–08 at the beginning of the thaw period where there was a large increase in water (≈ 0.1 m3 m-3) at the 2 cm depth. However, in most years, the water content did not increase at the 20 cm depth as a result of a wetting event. When the 50 cm depth thawed, the water content was generally at its highest level and then would decrease (dry) slightly over the thawed period. In addition to vertical movement of snow meltwater, water may be moving laterally within the active layer as there are nearby surface waters.
Scott Base
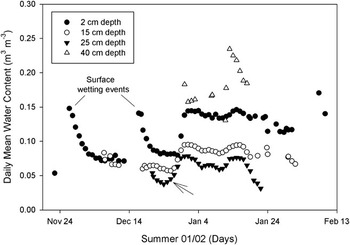
At the Scott Base site, there was generally one to about four wetting events per summer season at the 2 cm depth over the 10 year monitoring period. Increases in water contents from a wetting event ranged from 0.02 up to 0.16 m3 m-3 at the 2 cm depth. Liquid water did percolate downward to the 15 and 25 cm depths in some instances. Also, subsurface movement of water from upslope has been observed to occur, increasing water contents of the active layer, especially at the 25 and 40 cm depths above the ice-cemented permafrost. The 40 cm depth did not thaw in most years. In Fig. 4, water contents increased at the 25 cm depth first (see arrow in graph), then at the 15 cm depth, and then at the 2 cm depth, indicating that water was coming from the subsurface and moving upward in the active layer. The 2001–02 summer (shown in Fig. 4) was the warmest summer in our record, with the deepest active layer depths recorded at a number of sites (Adlam et al. Reference Adlam, Balks, Seybold and Campbell2010), and considerable meltwater reported in the Dry Valleys. Melting to a deeper than usual permafrost interface may have contributed to the moisture observed. The Scott Base SCS is on a back slope, where water can move laterally down hill above the permafrost from snow and permafrost melt which may also have contributed to the raised moisture status recorded.
Daily mean soil liquid water contents in the active layer for the Scott Base soil climate station in summer 2001–02. The arrow points to wetting from upslope subsurface water flow.

Minna Bluff
At the Minna Bluff site, there were several years of incomplete moisture data and some years of no data for a summer due to sensor failure. With the limited data, up to three wetting events occurred at Minna Bluff each summer. The 2008–09 summer season had a complete set of moisture data at the 10 cm depth, which showed early wetting from snowmelt at the beginning of the thaw period (0.20 m3 m-3), and then a gradual drying with one small wetting event, never dropping below 0.08 m3 m-3. At Minna Bluff, water contents tend to start out at their maximum and decrease over the summer season (dry to the season minimum).
Granite Harbour
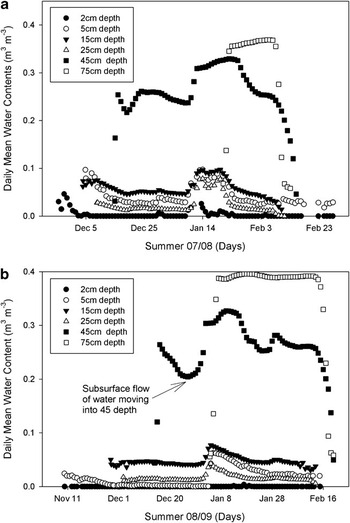
One to three wetting events occurred during each summer season at the Granite Harbour site, with a maximum surface wetting of up to about 0.08 m3 m-3 at the 2 cm depth. Water contents at lower depths did increase as a result of surface wetting events (Fig. 5a). Subsurface wetting events also occurred from lateral subsurface flow of meltwater from upslope along the ice-cemented permafrost. An example of a subsurface wetting event is shown in Fig. 5b. The 45 cm depth is increasing in water content, first, from upslope subsurface flow. Through unsaturated subsurface flow, the shallower depths showed increasing water contents, but the increase did not reach the near-surface (2 cm) depth. The shallow depths reached their maximum water content a few hours after the 45 cm depth reached its maximum. As the 75 cm depth thawed, more lateral flow of water moved into the 45 cm depth. This subsurface flow was also observed and could be heard at the site. Water contents at the 45 and 75 cm depths generally start out high and get wetter from upslope subsurface flow and then decrease towards the end of the thaw season (Fig. 5). The rapid increase or decrease (e.g. from 0.38 to 0.05 m3 m-3) in water content at the 45 and 75 cm depths is due to water thawing or freezing. The drop in liquid water content during freezing is analogous to soil drying.
Daily mean soil liquid water contents in the active layer for the Granite Harbour soil climate station. a. summer 2007–08, b. summer 2008–09.

Mount Fleming
There were no wetting events at the Mount Fleming site during the thaw period, which was very short - only a few hours in some years (Table III). The air temperature at the Mount Fleming site was never above freezing during the study period, and is frequently subject to blowing snow. Frost/ice crystals have been observed in the upper 15 cm of the soil.
Active layer liquid water content trends
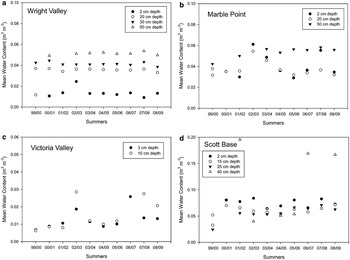
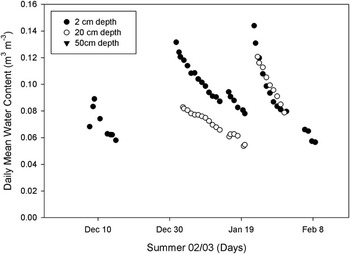
The year-to-year active layer mean water contents remained consistent over the monitoring period (Fig. 6a–d). There was some year-to-year variability, but no significant decreasing or increasing trend in active layer soil water contents over the monitoring period. The temporal variability of water content at the Wright Valley site was the lowest, varying within 0.01 m3 m-3 (Fig. 6a). The 2002–03 summer was consistently wetter across the Wright Valley, Victoria Valley, and Marble Point sites (Fig. 6a–c). The greater water contents are due to greater infiltration of snow meltwater during the 2002–03 summer (e.g. Fig. 7). The previous summer (2001–02) was warmer than average, leading to higher than usual Onyx River flows (Doran et al. Reference Doran, McKay, Fountain, Nylen, McKnight, Jaros and Barett2008). However, our sites did not show an increase in soil moisture during that warm summer. The increased flow in the rivers was attributed primarily to increased glacier meltwater.
Trends in the mean soil liquid water contents of the active layer. a. Wright Valley soil climate station, b. Marble Point soil climate station, c. Victoria Valley soil climate station, d. Scott Base soil climate station.

Daily mean soil liquid water contents in the active layer for the Marble Point soil climate station in summer 2002–03 showing four wetting events and higher than average infiltration of meltwater.

The water contents were averaged over the entire monitoring period for each site and were strongly correlated to the mean annual air temperature (r = 0.76) and the air relative humidity (r = 0.68). In general, as the air temperature and relative humidity increased, so did the soil moisture content. Latitude was weakly correlated to the mean active layer water contents (r = 0.30). The coastal sites alone (which lie along a latitudinal gradient) resulted in no correlation with active layer water contents. It is evident that the local microclimate and topography have a greater influence on active layer water contents than the latitudinal gradient of these sites. It has been shown that local microclimates are more important than regional and environmental gradients in influencing soil development (Cannone et al. Reference Cannone, Wagner, Hubberten and Guglielmin2008) and explaining variation in soil biodiversity and ecosystem functioning (Barrett et al. Reference Barrett, Virginia, Hopkins, Aislabie, Bargagli, Bockheim, Campbell, Lyons, Moorhead, Nkem, Sletten, Steltzer, Wall and Wallenstien2006). Using all sites, the mean water content was negatively correlated to the elevation (r = -0.62). As the elevation increases the moisture content tended to decrease. The inland sites were drier and at a higher elevation than the coastal sites, explaining the negative correlation with elevation. Bockheim (Reference Bockheim2008) also reports a general decrease in soil moisture from the coast inland in the Ross Sea Region.
Conclusions
Mean water contents in the active layer range from 0.013–0.015 m3 m-3 in the surface soils of the Dry Valley sites, to 0.182–0.319 m3 m-3 near the ice-cemented layer at two of the coastal sites. The coastal sites have greater soil water contents than the Dry Valley sites, and the water contents generally increase with depth in the active layer. The Wright Valley site receives very little infiltration from snowmelt, with none in most years. Any water that infiltrates does not reach the 20 cm depth. The Victoria Valley site receives one to three wetting events per summer in which infiltrated water does move to lower depths in some cases. The Marble Point site receives one to four wetting events per summer and infiltrated water does move to the 20 cm depth in some cases. The Scott Base site receives about one to four and Granite Harbour receives about one to three wetting events per summer. At both the Scott Base and Granite Harbour sites, water does move to greater depths. Also, the Scott Base and Granite Harbour sites are situated on sloping ground and receive subsurface flow of water from upslope along the ice-cemented permafrost, which does provide for subsurface wetting events. Up to three wetting events occurred each summer at the Minna Bluff SCS (with only one complete summer of data). There was no wetting events recorded at the cold and windy Mount Fleming site, though it is frequently subject to blowing snow. There was no significant decreasing or increasing trend in active layer soil water contents over the ten year monitoring period (1999–2009) at the Scott Base, Victoria Valley, Wright Valley, and Marble Point sites. Soil water contents were positively correlated with air temperature, and relative humidity, all pointing to coastal sites having greater water contents. In general, water contents are low, there is very little recharge and water contents are consistent between summers. The local microclimate and topography have a greater influence on active layer water contents than the latitudinal gradient of the study area.
Acknowledgements
This research was partially funded by The New Zealand Foundation for Research Science and Technology (FRSTgrant CO930307). Logistics support for this project was provided by Antarctica New Zealand. We acknowledge the contribution of John Kimble (retired from USDA-NRCS), Ron Paetzold (retired from USDA-NRCS), Don Huffman (retired from USDA-NRCS), and Iain Campbell (Land and Soil Consultancy Services) who all assisted in the initial installation of the climate stations and with maintenance in the following years. The Victoria Valley soil climate station was installed by Ron Sletten (University of Washington) who is a collaborator on this site.
Appendix A. Soil profile descriptions