I. INTRODUCTION
Nitrides and related compounds of Ta have been found to exhibit very attractive surface properties. Reference Le Dréo, Banakh, Keppner, Steinmann, Briand and De Rooij1–Reference Banakh, Steinmann and Dumitrescu-Buforn3 These compounds have been prepared by several methods, and a number of phases within the Ta–N system have been reported in the literature. Reference Angelkort, Berendes, Lewalter, Bock and Kolbesen4–Reference Swisher and Read8 Work describing the laser-induced formation of phases within the Ta–N–O system has also been reported recently. Reference Matizamhuka, Sigalas and Herrmann9–Reference Kerlau, Merdrignac-Conanec, Guilloux-Viry and Perrin11 Reactive laser ablation of metals may provide a method to explore part of the energy landscape for the Synthesis Planning concept proposed by Jansen. Reference Jansen12,Reference Jansen and Schön13 According to this concept, solid phase synthesis may occur either at thermodynamic conditions or to reach a metastable state depending on the kinetic constrains of the process. To assess preparative conditions that may yield the desired final materials, it is usually required to use in situ diagnostic techniques capable of distinguishing chemical processes occurring without the intervention of reactive gases in the environment.
In situ laser x-ray photoelectron spectroscopy (XPS) experiments were recently reported for Ti targets, Reference Lahoz, Espinós, De la Fuente and González-Elipe14 where surface cleaning and reactivity with various gases were discussed. This work demonstrated a facile nitridation of the metal under laser irradiation with ns pulses.
Fundamental studies on the oxidation and nitridation of Ta by exposure to controlled amounts of O2 and N2 under in situ conditions were the subject of intensive research more than one decade ago, trying to understand the kinetics of formation and intermediate states underlining these processes. Reference Venkataraj, Kittur, Drese and Wuttig15
The main objective of the present work is to explore the potential of this in situ laser-XPS technique to assess the chemical transformation undergone by Ta metal surfaces irradiated under nitrogen. For such a purpose, in this paper, we present and discuss a series of results obtained by laser irradiation of Ta under N2, O2, their mixtures, and vacuum. These in situ studies have evidenced the importance of the formation of nitride and oxide intermediate states, and that their behavior under laser irradiation is different from results obtained under conventional annealing treatments. Reference Venkataraj, Kittur, Drese and Wuttig15,Reference Lu, Weng, Hwang and Yang16 In addition, the effect of laser irradiation on cleaning efficiency of commercially available substrates has been also explored by this “in situ” approach due to its potential importance for industrial scaling-up of the process.
Finally, a comparison between laser irradiation in pulsed and continuous wave mode (cw) was carried out. The essential difference between these two modes is related to the interaction mechanisms associated to melting (cw mode) and the formation of plasma plumes combined with far from thermodynamic equilibrium or transient melting (ns-pulsed mode). Reference Sánchez-Valencia, Toudert, Borrás, Barranco, Lahoz, de la Fuente, Frutos and González-Elipe17–Reference Rubahn20 In essence, cw laser irradiation induces intense photothermal processes, which result in heating and melting of the irradiated area and its surroundings. The extent of melting is largely determined by the thermal properties of the irradiated substrates. Reference Bäuerle19,Reference Rubahn20 In addition to transient melting, ns-pulsed laser irradiation induces plasma formation and material ablation. It is thus interesting to ascertain the difference caused by these two emission modes on the final properties of the processed substrate.
II. EXPERIMENTAL
All the experiments were performed in a VG ESCALAB 210 spectrometer (Vacuum Generators, Hastings, East Sussex, UK) supplied with a prechamber, where gases can be dosed and samples irradiated with a laser. The experimental setup has been described in detail in a previous work. Reference Lahoz, Espinós, De la Fuente and González-Elipe14 In this experimental arrangement, the laser irradiates the Ta metal samples onto their center position, passing through a borosilicate glass window.
A pulsed multimode Nd:YAG Q-switched laser (Brilliant model, manufactured by Quantel) emitting at 1064 nm with a repetition rate of 20 Hz and 5 ns pulse width was used. The energy per pulse was ranged from 198 to 342.5 mJ. The laser spot measured 4 mm in diameter, resulting in a laser fluence value ranged from 1.576 to 2.725 J cm−2 and an irradiance of 315–545 MW cm−2. Each sample was irradiated with 60 pulses.
The high-irradiance values associated with the process provoked the appearance of intense shock waves due to the recoil pressure associated to the generated plasma plume. Material at the surface was ablated with a mechanism characteristic of ns regimes, where a thin transient melt appears. Reference Bäuerle19,Reference Rubahn20 According to this mechanism, the melt layer is compressed at the spot and pushed away radially, where it deposits on a circle of several mm in diameter around the laser incidence spot. Reference Lahoz, Espinós, De la Fuente and González-Elipe14
Several foils of polycrystalline Ta (Goodfellow, 99.99% purity, 0.127 mm thick) were used as substrates for this study. Since one of the objectives of the present work is to determine the cleaning efficiency of the different laser treatments, the samples were introduced in the prechamber of the XPS spectrometer without undergoing any particular cleaning procedure.
A first set of experiments was carried out at a constant N2 pressure of 0.1 Pa as a function of the laser irradiance at 315, 465, and 545 MW cm−2. To check the effect of oxygen impurities present in the N2 source gas, a second set of experiments was performed by dosing different O2/N2 mixtures, with molar ratios ranging from 1/100 to 1/1, at a total pressure of 0.1 Pa. The effect of irradiating the “as-received” Ta foil under high vacuum (residual pressure < 2 × 10⁻⁵ Pa) was also explored.
Finally, the effect of leaving the treated samples in air was examined by analyzing samples treated in pure N2 and then aged for three months under ambient conditions. An estimation of the penetration depth of N in this sample was made by subjecting it to Ar+ ion sputtering for increasing periods of time, by means of an ion gun (AG10 from VG) dosed with Ar and working at 3 kV. An erosion depth of approximately 0.1 nm min−1 has been estimated for these working conditions.
After in situ laser irradiation in the XPS prechamber and gas pumping, the samples were transferred to the analysis chamber, where spectra were acquired. The latter were collected in the pass energy constant mode at a value of 50 eV. A Mg Kα source was used for the excitation of the spectra. The binding energy scale of the spectra was calibrated with the Fermi edge of a pure Ni sample, electrically attached to the Ta foil. Quantitative analysis of the surface composition was performed by referencing the area of the different photoemission peaks to their sensitivity factors, provided by the spectrometer manufacturer. Since N1s and Ta4p 3/2 photoelectron peaks overlap, the area of the N1s signal was obtained after subtraction of a background line simulating the shape of the Ta4p 3/2 peak. Chemical information was obtained by peak fitting of the Ta4f signals.
Scanning electron microscopy observation of the “in situ” irradiated samples was carried out with a Hitachi S4800FEG scanning electron microscope. Images have been taken both from the irradiated and adjacent zones.
III. RESULTS AND DISCUSSION
A. Laser formation of tantalum oxides and nitrides
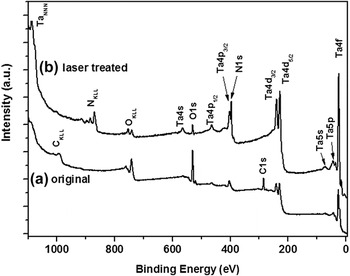
Figure 1 shows a photoemission survey spectrum of a Ti foil before and after laser treated under pure N2 gas phase and 545 MW cm−2 of irradiance. This spectrum has been chosen as a representative example of all obtained in this study, and its several photoemission signals have been labeled according with the standard notation indicating the atom and electronic level. It can be seen that on the surface of the original foil, Ta, O, and C are the elements detected, the carbon and oxygen due to adsorption and reaction of the atmospheric agents (O2, water vapor, CO2, hydrocarbons, and other carbonaceous contaminants) with Ta. After the laser treatment, N1s and NKLL signals arise and the intensity of the Ta photoemission peaks strongly rises, as a consequence of the reaction of Ta with N2 and the removal of most of the surface contaminants, which partially hid the metallic surface. Note that after this treatment, photoemissions from carbon (C1s and CKLL) are hardly detected, although signals from oxygenated species are still clearly visible.
Survey photoemission spectra of a Ta foil: (a) original and (b) after laser treated (in situ) under pure N2 and 545 MW cm−2 of laser irradiance.

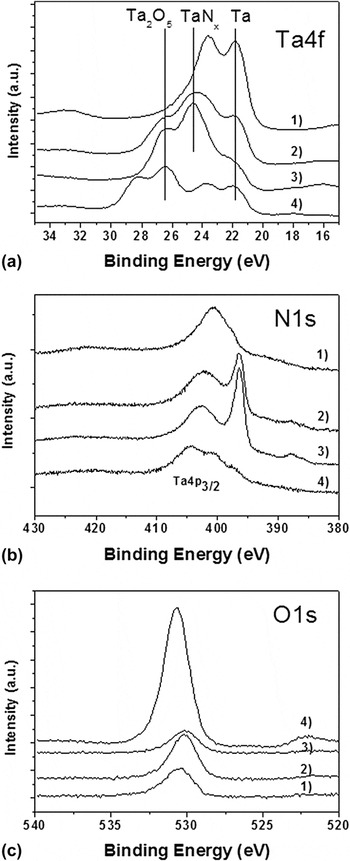
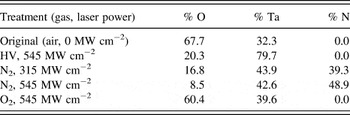
These spectral changes are unambiguously observed in Fig. 2, where a series of high-resolution Ta4f, N1s, and O1s photoemission spectra are depicted for Ta foils subjected to different in situ laser irradiation experiments in vacuum and under-controlled gas mixtures of oxygen and nitrogen and different irradiances. As mentioned above, the spectra taken in the region around the N1s peak, Fig. 2(b), are the result of the superposition of this peak and that of Ta4p 3/2. To ascertain the presence of nitrogen, the NKLL Auger spectra of this element were also recorded in all cases (data not shown). Atomic percentages of Ta, N, and O in the differently treated samples, as well as in the original untreated foil, are gathered in Table I. These spectra confirmed that only when the Ta foil was irradiated in the presence of N2, there was a measurable concentration of this element in the sample. It is also relevant that oxygen is always detected at the surface of the samples, whatever the composition of the gas phase during the laser treatment is, even if this one is carried out under high vacuum (P < 2 × 10⁻⁵ Pa).
(a) Ta4f, (b) N1s (plus Ta4p 3/2), and (c) O1s photoemission spectra of a Ta foil laser treated (in situ) under the following conditions of gas composition and laser irradiance: 1) high vacuum (P < 2 × 10⁻⁵ Pa) and 545 MW cm−2, 2) pure N2 and 315 MW cm−2, 3) pure N2 and 545 MW cm−2, and 4) pure O2 and 545 MW cm−2.

Surface composition obtained by XPS of a Ta foil laser treated (in situ) under the following conditions of gas composition and laser irradiance: (a) original, air exposed; (b) high vacuum (P < 2 × 10⁻⁵ Pa) and 545 MW cm−2; (c) pure N2 and 315 MW cm−2; (d) pure N2 and 545 MW cm−2; and (e) pure O2 and 545 MW cm−2.

As shown in Fig. 1 and indicated in Table I, the original (untreated) surface of Ta foils is strongly oxidized. Thus, for the nitridation process to be effective, the laser treatments must remove this layer of TaO x from the surface. This removal could proceed by thermal ablation or, alternatively, by chemical conversion to nitride and oxynitride. When the oxide film is partially removed, the reaction of metallic Ta, initially beneath the surface, will take place with nitrogen atoms in the plasma plume. Consequently, two possible sources of oxide species can be found at the surface of laser treated samples, the original oxide film has been only partially removed or converted, or the pristine Ta has reacted with oxygen containing reactants in the gas phase. Regarding this second possibility, as determined by mass spectrometry, the main oxygenated compound existing in the residual gas phase of the preparation chamber is H2O, whose partial pressure is around 1 × 10⁻⁵ Pa. The concentrations of other oxygenated species, such as CO2 or O2, are at least 2 or 3 orders of magnitude lower. So, in addition to the unremoved original TaO x (x > 2/5) film, H2O is likely the main source of oxygen species found on the surface of the tantalum foils after their laser treated under high vacuum.
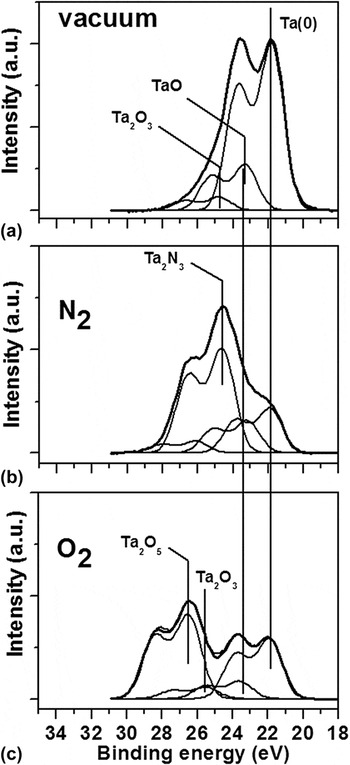
As shown in Fig. 2(a), the Ta4f spectrum of the vacuum-treated sample is characterized by a complex shape, where the theoretical ratio between the Ta4f 7/2 and Ta4f 5/2 components of the doublet (7:5) is apparently not preserved. We attribute this effect to the superposition of several different species of tantalum as evidenced by fitting analysis, in Fig. 3. A main species, due to metallic Ta with a Ta4f 7/2 binding energy (BE) of 21.8 eV, and two other minor ones with BEs at around 23.3 and 24.8 eV are clearly detected. We tentatively attribute these minority components to the formation of several kinds of substoichiometric TaO x (x > 2/5) phases. Similar spectral components were detected during the initial stages of oxidation of pure metallic Ta exposed to low doses of oxygen or the partial decomposition of very thin films of Ta2O5. Reference Hofmann21,Reference Atanassova and Spassov22
Fitting analysis of several selected Ta4f spectra in Fig. 2. Gas composition and laser irradiance treatments: (a) high vacuum (P < 2 × 10⁻⁵ Pa) and 545 MW cm−2, (b) pure N2 and 545 MW cm−2, and (c) pure O2 and 545 MW cm−2.

The Ta4f spectrum of the sample treated under pure oxygen consists of two main components, characterized by Ta4f 7/2 BEs of 21.8 eV (Ta metal) and 26.6 eV. This latter peak has to be attributed to Ta2O5. Reference Hofmann21 In addition, two small components due to substoichiometric tantalum oxides Reference Gnanarajan and Lam23 can be also detected by fitting analysis. It is interesting from these results that even if the overall O/Ta ratio in this sample is 1.53, much smaller than in the stoichiometric Ta2O5, the substoichiometric tantalum oxide components are small (see the fitting analysis in Fig. 3). These results suggest that the extreme conditions achieved during laser irradiation favor disproportionation of substoichiometric species, a process which could be represented as TaO x → Ta + Ta2O5.
The irradiation of the Ta foil in the presence of N2 radically alters the above picture. According to the spectra in Fig. 1, the atomic composition in Table I, and the fitting analysis in Fig. 3, laser irradiation induces the incorporation of a high concentration of nitrogen in the sample, although traces of oxygen still remain on the surface. This effect is enhanced when increasing the laser irradiance. According to the N1s BE (i.e., 395.7 eV), this nitrogen must be in the form of a nitride species. Reference Arshi, Lu, Lee, Koo and Ahmed24–Reference Dang, Hahn, Park, Bard and Mullins27 However, the O1s BE of the remaining oxygen (i.e., around 530.0 eV) is slightly different than that of the oxygen in the TaO x (i.e., 530.6) and Ta2O5 (i.e., 530.6) phases claimed above. This different BE suggests that the environment around oxygen is now a little bit different. We tentatively assume that this remaining oxygen is embedded within a TaN y majority phase, i.e., as in a tantalum oxynitride phase. Certainly, as shown the fitting analysis in Fig. 3, the Ta4f raw spectrum of the metal foil subjected to laser treatment under pure N2 consists of a main component at 24.6 eV for the BE of the Ta4f 7/2 peak, which is attributed to Ta3N5 phase, Reference Lamour, Fioux, Ponche, Nardin, Vallat, Dugay, Brun, Moreaud and Pinvidicb26–Reference Zier, Oswald, Reiche and Wetzig29 together with a small shoulder at around 21.9 eV, which is ascribed to Ta, and finally, two other minor components at approximately 23.2 and 26.0 eV, that could be attributed both to some residual TaO x and TaO x N y phases.
A final important detail that deserves to be noted in the Ta4f spectra is that after the laser treatments, either carried out under pure O2 or under pure N2, metallic Ta is always detected. This result indicates that, if homogeneous and continuous films of nitride, oxynitride, or oxide are formed, their thicknesses are always thinner than the scape depth of Ta4f photoelectrons, which is calculated to be ∼6.4 nm from their inelastic electron mean free path, as obtained by IMFP-TPP2M formula. Reference Tanuma, Powell and Penn30
B. Effect of N2/O2 mixture on the nitriding process
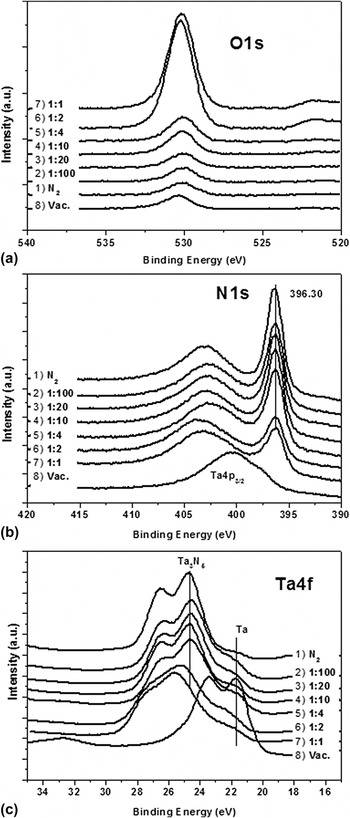
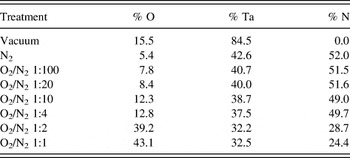
Under conventional operating conditions in an industrial environment or, in general, if the control of the purity of the gases is not straightforward, it has to be expected that nitrogen can be contaminated with oxygen. To check the importance of the purity of nitrogen in the nitriding efficiency of Ta with pulsed lasers, we have carried out a series of experiments “in situ” where the O2/N2 ratio in the gas phase, at a pressure of 0.1 Pa, has been systematically changed. The obtained results are reported in Fig. 4, where Ta4f, O1s, and N1s (plus the Ta4p 3/2) spectra are depicted as a function of the O2/N2 ratio. Atomic compositions deduced from these spectra are reported in Table II. This series of spectra and compositional data indicate that only when the concentration of oxygen in the low pressure mixture is quite high (i.e., for O2/N2 mixtures 1/1 and 1/0.5), the amount of oxygen incorporated within the samples is high. For O2/N2 ratios equal or smaller than 1/4, the formation of nitride is favored and the oxygen does not seem to play a significant role in the chemistry of the laser irradiated Ta. The results of this experiment indicate that, under our working-pulsed laser irradiation conditions, tantalum nitridation is more efficient than oxidation.
(a) O1s, (b) N1s (plus Ta4p 3/2), and (c) Ta4f photoemission spectra of a Ta foil treated (in situ) with laser under N2, vacuum or different mixtures of O2, and N2 with the indicated O2/N2 ratios.

Surface composition (%Atom) obtained by XPS of a Ta foil laser treated under the indicated conditions of gas composition (P = 0.1 Pa) and a laser irradiance of 545 MW cm−2.

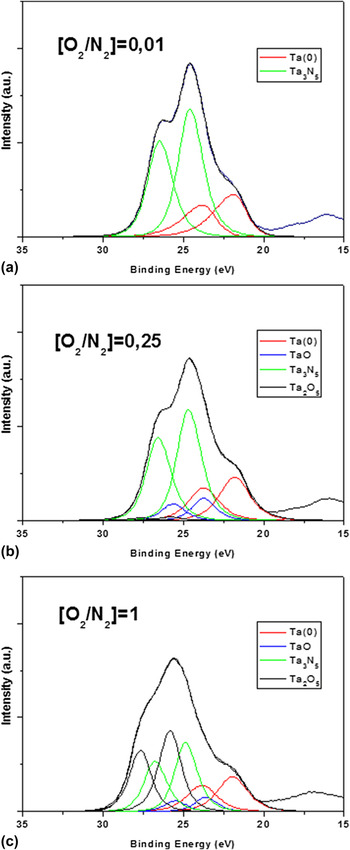
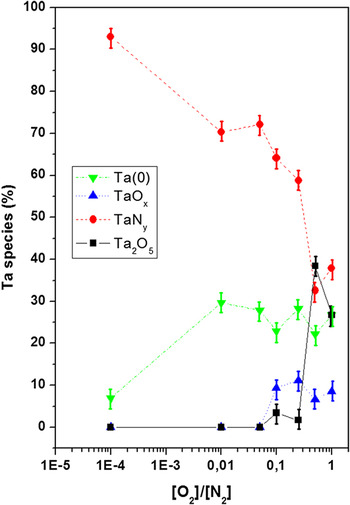
Fitting analysis of representative spectra in Fig. 5 is consistent with the fact that significant oxidation only takes place for O2/N2 ratios higher than 0.25. A quantitative evaluation of the relative concentration of the different tantalum species in the laser-treated samples derived from the areas of the fitting bands is reported in Fig. 6. According to this plot, the formation of Ta3N5 undergoes a drastic decrease for O2/N2 ratios equal to one, while tantalum oxide species increase. The observation in this plot of an inflection in the tendency of formation of oxide and nitride phases, at a O2/N2 ratio equal one, must be linked to the relative increase in metallic Ta observed, which points to an in-depth rearrangement of the different phases under these conditions.
Fitting analysis of selected Ta4f spectra in Fig. 4. Gas O2/N2 ratios: (a) 0.01, (b) 0.25 y, and (c) 1.0.

Evolution of the percentage of the different species of Ta determined from the fitting analysis of Ta4f spectra as a function of the O2/N2 ratio during laser irradiation.

C. Stability of tantalum nitride in air
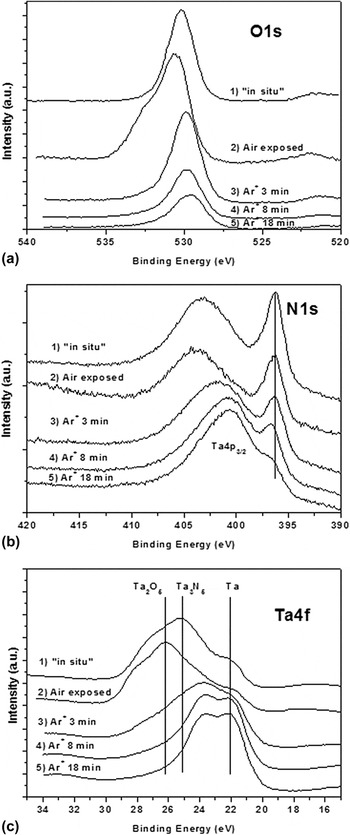
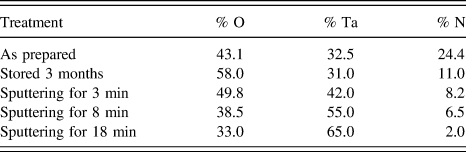
The stability in air of the tantalum nitride formed under laser irradiation is of paramount importance for the anticorrosion performance of tantalum nitride layers. X-ray photoemission spectra have been recorded for a nitrided tantalum sample left in air for three months. Figure 7 shows a series of Ta4f, N1s (plus Ta4p 3/2), and O1s photoemission spectra recorded for this sample just as prepared in situ, after exposure to the atmosphere for three months, and finally, subjected to Ar+ sputtering for increasing periods up to 18 min. The atomic percentages of the analyzed layers are gathered in Table III.
(a) O1s, (b) N1s (plus Ta4p 3/2), and (c) Ta4f photoemission spectra of a Ta foil treated (in situ) with the laser under a O2/N2 ratio 1:1, left in air for three months and then subjected to Ar+ sputtering as indicated.

Surface composition (%Atom) obtained by XPS of a Ta foil laser treated under a O2/N2 ratio 1:1, left in air for three months and then subjected to Ar+ sputtering, as indicated.

As can be seen in Fig. 7, the exposure to the atmospheric agents induces distinct changes in O1s and Ta4f signals. Thus, the intensity of the Ta4f component at 22 eV (metallic Ta) diminishes, while that of the component at 28.2 (Ta2O5) rises. Simultaneously, the signal of O1s, which was single and highly symmetrical before air exposure, is split into two components after it: a main peak at 530.6 eV and a shoulder at 532.4 eV. These binding energy values can be attributed to O−2 and H2O species, respectively. Consequently, these spectral changes in the O1s and Ta4f signals are consistent with a partial oxidation of the residual metallic Ta to Ta2O5 and hydration of the surface. However, as depicted in Fig. 7(b), after air exposure for three months, the N1s photoemission peak keeps its shape and binding energy, while its intensity only decreases very slightly, (as deduced by comparison with the intensity of Ta4p 3/2 peak). This invariableness in the spectral features of nitrogen photoemission signal indicates that the nitride film formed under laser irradiation, though very thin and likely discontinuous, is quite stable.
Figure 7 also shows that the ion etching of the air-exposed film induces, in the O1s region, a strong decrease in the O−2 signal and the full disappearance of H2O. Meanwhile N−3, Ta2O5, and Ta2N3 species practically disappears from the N1s and Ta4f spectra. This spectral evolution indicates that the sputtering treatment removes all the layer thickness where nitrogen was initially incorporated. The estimated sputtered depth after bombardment for this time is ∼2 nm.
D. Changes in surface microstructure
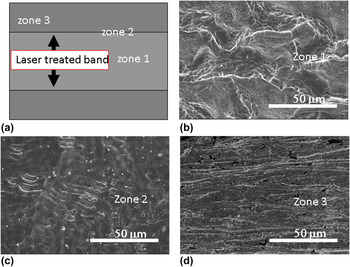
Besides the chemical modifications induced in the upmost surface layers of Ta by the laser irradiation under nitrogen, changes also occur in the morphology of the surface, as revealed by the analysis of the modified surfaces by scanning electron microscopy (SEM). Figures 8(b)–8(d) show SEM micrographs of several zones within a representative laser modified sample. For comparison purposes, Fig. 8(a) shows an explanatory drawing, where the different zones viewed in the electron microscope are specifically identified. These are used to study the effect of the laser irradiation within the area of incidence, in its center and at its edges. In addition, adjacent substrate areas, which have not been directly illuminated by the laser, have also been observed. A micrograph taken on the center region of the laser irradiated band is shown in Fig. 8(b). The microstructure observed is typical of a molten surface, which has resolidified directionally at a high rate. Its surface roughness is periodically waved, a typical morphology expected from pulsed mode irradiation, where intense shock waves suppress the melt into a volcanic-like shape extended along the sample's-treated area. The origin of such a structured surface is related to the ablation process, explained previously for similar in situ work with Ti. Reference Lahoz, Espinós, De la Fuente and González-Elipe14 As expected from the fact that thermal dissipation is minimum at the center and maximum at the edges of the molten zone, the irradiated areas near the limit of the laser treatment evidence a solidified melt build-up, as observed in Fig. 8(c). Long cracks are also visible in several of the areas studied, as well as solidified droplets toward the edges and outside the laser-treated band. These are expelled from the small melt generated during the ns laser ablation regime and are, consequently, absent from the center part of this band. Figure 8(d) shows that, as expected, the part of the substrate that has not been irradiated presents no signs of significant melting but a granular and somewhat porous microstructure. It is thus clear that the laser irradiation affects the surface of the Ta substrate to a significant extent, changing its microstructure and densifying its surface, in addition to inducing the reactions discussed above in the presence of N2 and O2 gases and their mixtures, as well as in vacuum.
(a) Scheme of a laser modified Ta band and SEM micrographs of the three different representative zones: (b) at the center of the band, (c) at the edges of the band, and (d) at adjacent nonlaser illuminated substrate areas.

E. Formation of tantalum oxide and nitride by laser irradiation
The complexity of the Ta–O system has been established for films grown by KrF excimer laser ablation of Ta in the presence of O2. Reference Geretovszky, Szörenyi, Stoquert and Boyd31 According to published work by Maeng et al., Reference Maeng, Axe, Tyson and Jiang32 films obtained on the Ta–O system, by anodic and thermal oxidation, yield Ta2O5 at substrate temperatures approaching 800 °C. At temperatures approaching 400 °C, the resultant films are mainly composed of metastable TaO x (e.g., Ta2O) phase that can remain unmodified for long treatment times. Ta2O5 is obtained here under intense laser irradiation and the presence of oxygen. At room temperature, a TaO x film was obtained by Yano et al. Reference Yano, Ooie, Yoneda, Katsumura, Hino and Araki33 by irradiating Ta in the presence of oxygen using an excimer laser. This substoichiometric layer transformed into polycrystalline Ta2O5 upon annealing at 973 K under vacuum. Our experimental evidence shows that Ta2O5 is already formed by Nd:YAG (nIR) laser irradiation. Since both excimer lasers and the pulsed Nd:YAG (nIR) laser used here have similar pulse width regimes, the difference in wave length might well produce an enhancement in the local temperature with the solid state laser, where photothermal phenomena are predominant due to a more efficient electron phonon interaction. Reference Bäuerle19 This assumption is further supported by the work of Sol and Tilley, Reference Sol and Tilley34 indicating that photochemical changes are usually not induced in Ta oxides.
Our results in the presence of nitrogen and mixtures O2/N2 confirm a high tendency to form tantalum nitride by laser irradiation (i.e., around 50% oxide vs. nitride, see Fig. 6 for a ratio equal or close to one) and that only for relatively high concentration of oxygen in the mixtures, oxide formation competes with the formation of nitride. This evidence contrasts with other studies in literature on the formation of oxynitride phases by nonequilibrium methods, such as magnetron sputtering. Reference Venkataraj, Kittur, Drese and Wuttig15 In this case, the presence of small amounts of oxygen in the plasma gas is sufficient to render tantalum oxide rather than nitride. The results presented here suggest that during laser irradiation, plasma plume effects tend to favor the formation of nitride by preferential activation of nitrogen species. Additional work is being carried out to prove this hypothesis.
IV. CONCLUSIONS
The previous results and discussion indicate that pulsed laser irradiation of Ta with a Nd:YAG (nIR) laser constitutes a convenient method to predominantly obtain stoichiometric tantalum oxide and nitride passivation layers. Our “in situ” XPS study has shown that the composition of the gas phase, the ratio between oxygen and nitrogen, and the laser irradiance are critical factors to control the overall passivation process. It is also found that the photothermal pulsed irradiation phenomena involved in this process lead to the formation of a characteristic nanosecond laser ablation type surface finishing. Contrary to highly crystalline Ta3N5, the nitride phase obtained in our case exhibited a poor stability in air, which is attributed to poor crystallinity arisen from the fast solidification of the transient melted front.
ACKNOWLEDGMENTS
Authors thank the European Union (Project CERAMGLASS, Life-ENV/ES/560), the Spanish Ministry of Science and Innovation (Projects CONSOLIDER CSD2008-00023, MAT2013-42900-P and MAT2013-40852-R), the “Junta de Andalucía” (Projects TEP8067, FQM-6900 and FQM-2265) and the “Diputación General de Aragón” (Research Group T87) for financial support.