

INTRODUCTION
Political violence has devastating consequences that reverberate broadly and structure relationships for years. State repression in particular can rupture the relationship between victims and the government, with repercussions that persist long after violence itself. For some, consequences could include disengagement from political life, especially when it requires interacting with the state and its representatives. However, transitional justice policies—encompassing state-led initiatives to address histories of human rights abuses and political violence—can offer an opportunity to rebuild the connection between citizens and the state. For survivors of state violence, engaging in transitional justice may offer recognition and lead them to contemplate future political involvement based on their experience. However, a negative experience with transitional justice has the potential to further erode relationships and intensify sentiments of injustice.
Material reparations, which refer to monetary compensation administered to victims, are a common transitional justice policy. Figure 1 shows that states have established 79 reparations policies across post-violence contexts between 1970 and 2020 (Dancy et al. Reference Dancy, Pham, Sikkink, Thoms and Vinck2024). Examples of reparations policies include $4,000 payments to the 18,000 victims who testified before South Africa’s Truth and Reconciliation Commission, compensation for nearly 24,000 victims from Argentina’s military dictatorship, and reparations for nearly 10,000 victims of Morocco’s “years of lead.”Footnote 1
Map of Reparations Policies, 1970–2020
Note: Map shading corresponds to number of reparations policies that have been implemented per country from 1970–2020 according to data housed by the Transitional Justice Evaluation Tools (Dancy et al. Reference Dancy, Pham, Sikkink, Thoms and Vinck2024).

Figure 1. Long description
A choropleth world map uses a color gradient from light orange to dark reddish-brown to indicate the number of reparations policies per country. A vertical legend on the East side of the map scales from 1 at the bottom to 4 at the top.
* North America: Canada and the United States are shaded in the lightest orange, indicating 1 policy.
* South America: High concentration of activity. Argentina is shaded dark orange (3 policies). Brazil, Chile, and Colombia are medium orange (2 policies). Peru and Paraguay are light orange (1 policy).
* Europe: Sweden and Romania are shaded light orange (1 policy).
* Africa: Morocco is medium orange (2 policies). Algeria, Tunisia, and South Africa are light orange (1 policy).
* Asia and Oceania: Australia is the most densely shaded region in dark reddish-brown (4 policies). Indonesia is also dark reddish-brown (4 policies). South Korea, Thailand, and Timor-Leste are shaded light orange (1 policy).
Although the explicit purpose of reparations programs may be to rectify material and moral wrongs rather than shape citizens’ political engagement, given that state violence can generate distrust between citizens and the state, can material reparations increase political participation? I argue that they can, primarily through their capacity to recognize past injustice and demonstrate the state’s dependability, illustrating that engaging with the state can yield productive and positive outcomes. Even in situations where surviving victims are dissatisfied with certain aspects of reparations and continue to harbor grievances, their active engagement with the state can restore faith in the political system and set in motion feedback effects that drive additional political involvement.
To gain traction on this question, I examine material reparations in Chile, the site of a 17-year military dictatorship under General Augusto Pinochet. Between 1973 and 1990, the dictatorship was responsible for 3,065 deathsFootnote 2 and the torture of around 40,000 (Comisión Nacional Prisión Política y Tortura 2005; Comisión Asesora Presidencial para la Calificación de Detenidos Desaparecidos, Ejecutados Políticos y Víctimas de Prisión, Política y Tortura 2011), who, as of 2005, are eligible to receive state-administered reparations. As of 2018, nearly 23,000 surviving victims had claimed their reparations under Ley 19.992, consisting of ongoing monthly payments from roughly $250–$290.Footnote 3
These reparations are not distributed randomly. Thus, we might be concerned that people who request compensation are also more likely to participate in politics based on traits not observed by the researcher, a challenge that has limited existing transitional justice scholarship and clouded causal inference. To mitigate this selection issue, I focus on survivors who request reparations and leverage quasi-exogenous variation in timing of their approval for the program. I find that a year after reparations claims are processed, approval for reparations leads to more than a 9 percentage point increase in voter registration compared to those whose claims have not yet been approved. This uptick in registration, coupled with mandatory voting in subsequent elections, suggests continued electoral engagement. This behavioral effect does not imply endorsement of the policy or transitional justice; many survivors criticize the program and transitional justice more broadly in interviews.
While previous studies on transitional justice have primarily concentrated on trials, truth commissions, and memory institutions, reparations have received comparatively less attention. My results suggest that this oversight is consequential. Reparations can shape the post-violence political landscape. I also shed light on distinct pathways through which they make a difference. While rational actor theories might suggest the rise in political engagement stems from recipients’ improved economic circumstances, I find that the increase cannot be explained by reparations’ economic dimension alone. Instead, my results suggest that survivors ascribe symbolic significance to their reparations and policy experience, contributing to a heightened willingness to engage with the state. Quantitative analyses support this notion, and in-depth qualitative interviews and victim testimonies drawn from distinct victim communities demonstrate reparations’ symbolic functions.
These findings highlight the potential for unanticipated and downstream effects on political enfranchisement resulting from transitional justice policies like reparations. While some research suggests that victimization might increase political engagement (Bellows and Miguel Reference Bellows and Miguel2009; Blattman Reference Blattman2009; García-Ponce and Pasquale Reference García-Ponce and Pasquale2015), a number of scholars document a more troubling consequence: a withdrawal effect, where individuals lose trust in the state and retreat from political life, especially after state repression (Wang Reference Wang2021; Bautista Reference Bautista2016; Lupu and Peisakhin Reference Lupu and Peisakhin2017; Young Reference Young2019; Zhukov and Talibova Reference Zhukov and Talibova2018). If this withdrawal effect occurs, implementing transitional justice could be a way to rebuild political trust among survivors of state violence, and ultimately, influence whose voices are heard and represented in new democracies. Aside from being a potentially meaningful form of recognition, actively interacting with the state during the transitional justice processes affords surviving victims the opportunity to learn about the state’s responsiveness and to assess the efficacy of participating in politics (Campbell Reference Campbell2003; Mettler Reference Mettler2005; Soss Reference Soss1999), a dynamic that may lead to increased political activity for years to come. This result underscores the importance of carefully designing and executing policies in the aftermath of violence. Such policies operate not solely as a retrospective intervention to address past harm; they can also expand civic engagement as societies move toward healing and recovery.
Beyond the realms of reparations and transitional justice, this research advances our understanding of political participation. Conventional models of political participation tend to focus on the explanatory power of individuals’ material resources. Although reparations do increase material resources, they also have symbolic dimensions, as they recognize past wrongdoing and, through the policy engagement process, can reshape perceptions of the state. I put forth evidence that survivors recognize reparations’ symbolic significance and suggest that material explanations alone may not fully account for the observed increases in political behavior. This understanding may have broader applicability to political contexts where policies and interactions convey nuanced meanings and where policy engagement can trigger substantial feedback effects. These insights hold implications for the effective design of public policies. Policy-makers can pay additional attention to experiences during policy engagement to generate feedback effects that continue to structure citizen-state relations over time.
REPARATIONS AND POLITICAL PARTICIPATION
Country-level research on transitional justice has documented its capacity to affect macro-outcomes, such as rule of law, human rights protection, and democratic consolidation (Dancy and Thoms Reference Dancy and Thoms2022; Gibson Reference Gibson2004; Olsen, Payne, and Reiter Reference Olsen, Payne and Reiter2010; Sikkink Reference Sikkink2011; Wielbelhaus-Brahm Reference Wielbelhaus-Brahm2010). I join a growing number of scholars examining transitional justice at the micro-level (Aguilar, Balcells, and Cebolla-Boado Reference Aguilar, Balcells and Cebolla-Boado2011; Brounéus Reference Brounéus2010; Cilliers, Dube, and Siddiqi Reference Cilliers, Dube and Siddiqi2016; Gibson Reference Gibson2004; Reference Gibson2006; Kao and Revkin Reference Kao and Revkin2023; Kitagawa Reference Kitagawa2023; Balcells, Palanza, and Voytas Reference Balcells, Palanza and Voytas2022). In the realm of reparations, most work has focused on preferences (David and Choi Reference David and Choi2005; Espinoza Cuevas, Ortiz Rojas, and Rojas Baeza Reference Cuevas, Victor, Rojas and Baeza2003; Laplante and Theidon Reference Laplante and Theidon2007; Viaene Reference Viaene2010) and perceptions (Luzzi Reference Luzzi, Gayol and Kessler2014; Pham et al. Reference Pham, Vinck, Marchesi, Johnson, Dixon and Sikkink2016; Sveaass and Sønneland Reference Sveaass and Sønneland2015). There is limited evidence on the link between reparations and political participation. In this study, I expand this literature by documenting a behavioral impact of reparations—an increase in political participation among nonvoting surviving victims—and suggesting that policies can reengage portions of the population previously sidelined from electoral politics.
Related work on violence exposure and political engagement (typically without accounting for transitional justice) has generated mixed results. Studies in Uganda (Blattman Reference Blattman2009), Zimbabwe (García-Ponce and Pasquale Reference García-Ponce and Pasquale2015), and Sierra Leone (Bellows and Miguel Reference Bellows and Miguel2009) find increased prosociality and political engagement among affected populations, although this research mainly focuses on post-conflict (rather than post-repression) settings. Other work suggests that after exposure to state-led violence, victims and their descendants demonstrate lower state trust and political engagement (Wang Reference Wang2021; Bautista Reference Bautista2016; Lupu and Peisakhin Reference Lupu and Peisakhin2017; Young Reference Young2019; Zhukov and Talibova Reference Zhukov and Talibova2018). Increasingly, scholars have documented diverse reactions to violence exposure (Rozenas and Zhukov Reference Rozenas and Zhukov2019; Voytas and Crisman Reference Voytas and Crisman2023; Young Reference Young2020), underscoring the importance of considering additional factors during and after violence to understand the impact on victims. Participating in transitional justice processes may act as a potential mediating variable between violence exposure and subsequent political engagement.
Engaging in state-run transitional justice means interacting with state institutions. Populations victimized by state entities might have heightened levels of fear, skepticism, and distrust (Young Reference Young2019; Wang Reference Wang2021). As a result, many victims may opt against participating in state-run transitional justice initiatives. This study focuses on the subset of survivors who do participate and can gain knowledge and resources that may be relevant for their future political participation. The experience with state-led transitional justice is particularly relevant for participation that occurs within the bounds of the formal political system, such as registering to vote. How might reparations change voter registration among survivors?
Reparations have a readily apparent economic aspect. They consist of a direct monetary transfer from the state to victims. This economic component might help offset victims’ material losses, potentially reducing the relative cost of political engagement. Political participation is costly, requiring time, effort, and resources that could otherwise be directed elsewhere (Downs Reference Downs1957; Verba, Nie, and Kim Reference Verba, Nie and Kim1978). Canonical accounts of political participation emphasize that individual economic resources predict political engagement (Conway Reference Conway1991). Victimization can deplete material resources; victims might lose employment, face educational interruptions, or suffer property damage. These losses can accumulate, causing reduced political activity as survivors direct their time and resources toward addressing these pressing concerns.
Reparations could potentially offer a “development boost” that increases economic wellbeing and facilitates a return to normal life activities, including those political in nature (De Greiff Reference De Greiff2008). Prior analyses of cash transfer government programs have suggested that they increase voter turnout (De la O Reference De la O2013; Pop-Eleches and Pop-Eleches Reference Pop-Eleches and Pop-Eleches2012), though these programs targeted individuals with low socio-economic statuses rather than victims. Still, if increased incomes drive political engagement, reparations’ economic dimension could increase political activity, and larger sums would have a more pronounced effect than smaller ones. Moreover, this effect could grow over time as recipients accumulate more financial resources.
Simultaneously, state violence can exact social and psychological consequences. Victims report feeling disempowered and disrespected (Bies and Tripp Reference Bies, Tripp, Kramer and Tyler1996; Lind and Tyler Reference Edgar Allan and Tom1988). Injustice can threaten their sense of belonging and moral principles about right and wrong (Lind and Tyler Reference Edgar Allan and Tom1988; Folger Reference Folger and Marshall1998). Scholars suggest that responses to injustice, such as reparations, fulfill a symbolic role that helps address the wounds inflicted by violence (Desmet, De Cremer, and van Dijk Reference Desmet, De Cremer and van Dijk2011; Tyler and Blader Reference Tyler and Blader2003). The symbolic channel is akin to Pierson’s (Reference Pierson1993) “interpretive effects” defined as “the impact of policies on the cognitive processes of social actors” (610).
Although conventional economic approaches view money as an impersonal commodity with a quantitative interpretation, individuals might attach symbolic significance to money beyond its economic value (Belk and Wallendorf Reference Belk and Wallendorf1990; Zelizer Reference Zelizer1994). The symbolic value of reparations may originate from several sources that ultimately work to rebuild trust—a key predictor of formal political engagement (Devine Reference Devine2024)—between citizens and the state. For one, compensation may be perceived as more substantial recognition than verbal acknowledgment, indicating to recipients that their status and identity are acknowledged and valued. Research suggests that acknowledgment, as a form of costly signalling, can cultivate trust between the acknowledger and the acknowledged (Yu, Berg, and Zlatev Reference Yu, Berg and Zlatev2021).
Victims may also ascribe symbolic value to the reparations policy procedure. As policy feedback scholars have noted, policy experiences may shape the desire for future political activity (Campbell Reference Campbell2003; Mettler Reference Mettler2005; Soss Reference Soss1999). The way authorities carry out procedures—and especially the fairness of these procedures—can convey to citizens that they are valued (Bradford, Murphy, and Jackson Reference Bradford, Murphy and Jackson2014; Tyler and Blader Reference Tyler and Blader2003) and can build trust (Kumlin and Rothstein Reference Kumlin and Rothstein2005; Tyler and Huo Reference Tyler and Huo2002). The experiences and lessons learned from engaging with the state can extend beyond the specific policy domain, influencing victims’ perceptions of other government institutions and modes of political participation (Lawless and Fox Reference Lawless and Fox2001). In a post-repression context, survivors’ interactions with state institutions provide opportunities to reassess their perceptions of the state that previously waged violence against them. The reparations process allows surviving victims to gauge the state’s commitment to its promises, evaluate the level of dignity with which they are treated, and consider the wisdom of future political activity.
In suggesting that the nonmaterial aspects of the reparations—such as recognition from the state, along with its reliability and consistency in fulfilling its commitments to surviving victims—diminishes apprehension associated with state interactions, the symbolic channel captures multiple micro-mechanisms. These symbolic dimensions may collectively rebuild trust and lower psychological barriers to electoral engagement, setting in motion feedback effects that contribute to sustained participation. This pathway is non-economic, extending beyond the pure dollar value of compensation.
Economic and symbolic channels have distinct observable implications. The extent to which compensation helps balance the scale of justice might concern its ability to address the salient consequences of the original wrongdoing (Cropanzano et al. Reference Cropanzano, Byrne, Bobocel and Rupp2001; Mullen and Okimoto Reference Mullen, Okimoto, Cropanzano and Ambrose2015). Social psychologists suggest that concerns might be instrumental, when victims lose power or resources, or more symbolic, involving threats to an individual’s identity or deeply held moral convictions. This psychological framework suggests that comprehending the impact of reparations could involve understanding salient concerns triggered by the original injustice and considering whether reparations effectively address those concerns. Whether survivors discuss the harms they suffered in economic or socio-psychological terms prior to the policy’s implementation can shed light on the dominant pathway. Furthermore, post-implementation, survivors’ perceptions of reparations and their behavioral responses can provide additional insights into the presence of these pathways.
Still, that political participation will increase is not a forgone conclusion. Reparations might not increase, or could even decrease, institutional political engagement. If reparations are perceived as inadequate or as “blood money,” insufficient to address victims’ desires and needs (Luzzi Reference Luzzi, Gayol and Kessler2014), they might not meaningfully impact economic well-being. The reparations process could also suggest to victims that the state is unresponsive or incapable of addressing victim needs. These scenarios could create a “self-undermining” policy backlash, exacerbating feelings of injustice, and causing individuals to withdraw further from the political system they see as unjust (Jacobs and Weaver Reference Jacobs and Kent Weaver2014).
I argue, however, that even if survivors object to aspects of the reparations policy, reparations may still serve a symbolic function and increase political participation. In this case, reparations may allow recipients to develop a relationship with the state that suggests that engaging with formal political institutions could be an effective way to channel remaining grievances and achieve more progress for their other goals. Research in other contexts suggests that grievances over unequal treatment can motivate political participation (Oskoii Reference Oskoii2020; Ramírez Reference Ramírez2013). The preceding discussion generates a central hypothesis and distinct observable implications associated with each pathway:
Hypothesis 1: Reparations will increase political participation.
-
– Economic channel observable implication: Victims will discuss the harms they suffered in economic terms. Political participation will increase proportionally to the magnitude of reparations payments.
-
– Symbolic channel observable implication: Victims will discuss the harms they suffered in psychological terms and reference reparations’ symbolic value. Political participation will increase regardless of the relative amount received.
MATERIAL REPARATIONS IN POST-REPRESSION CHILE
To test my expectations, I examine the material reparations policy in post-dictatorship Chile. In 1973, the Pinochet military dictatorship overthrew Salvador Allende’s socialist government and repressed regime opponents, largely those with left-leaning political orientations. Recent studies have shed light on the political context, revealing the strategies of repression and opposition that led to the death of over three thousand individuals and the suffering of more than forty thousand survivors of torture and illegal detention (Amat Reference Amat2023; Bautista et al. Reference Bautista, González, Martínez, Muñoz and Prem2023; Esberg Reference Esberg2021).Footnote 4
Since the democratic transition, the government has initiated reparations programs for family members of those killed and for survivors of torture. Many other countries have established reparations policies (see Figure 1), and although these contexts should be studied in their own right, investigating the Chilean case can help generate hypotheses about behavioral responses to compensation elsewhere.
In Chile today, debates about the past shape contemporary politics and continue to generate mass political movements. In 2019, citizens organized large-scale protests over economic concerns. As protests and grievances expanded, citizens called for replacing the Pinochet-era constitution. In a 2020 referendum, Chileans voted to scrap the old constitution but later rejected proposed replacements in 2022 and 2023, leaving the current constitution in place.Footnote 5 Investigating how transitional justice policies function in atmospheres like this can generate important insights into the legacies of violence.
Collecting Reparations
This paper focuses on surviving victims, who constitute the majority of reparations recipients in Chile (92%), while the remaining recipients are family members of victims.Footnote 6 Several truth commissions have taken place since the democratic transition. The first, the Rettig Commission, reported those who had been killed or permanently disappeared for political reasons. Their family members (spouses, parents, and children) could then receive monthly reparations payments (Lira Reference Lira and Pablo de2006). Torture survivors lobbied for another truth commission to investigate non-lethal crimes. In 2004, President Lagos convened the Valech truth commission. Surviving victims who testified were listed in the commission’s final report and are eligible for reparations.Footnote 7 In 2010, President Bachelet reopened the commission, allowing more survivors and family members to testify and collect compensation.Footnote 8
To be considered a surviving victim, individuals needed to have experienced political detention and torture within one of the nearly 1,200 official detention centers (Comisión Nacional Prisión Política y Tortura 2005). Only those who provided testimony deemed credible and whose names appeared in the final Valech Report can receive reparations. After the report was published in late 2004, survivors listed had to verify their identity with the Instituto de Previsión Social (Social Security Institute, hereafter IPS) office to begin receiving reparations. I identify those 22,736 surviving victims whose claims for reparations had been approved as of 2018 using a micro-level administrative dataset of surviving victims and their compensation timetable.Footnote 9 The payments, administered monthly, initially ranged from roughly 113,000 to 129,000 Chilean pesos (88%–135% of the monthly minimum wage, see Table A1 in the Supplementary Material) and are periodically adjusted for inflation.Footnote 10 The key independent variable in this study is approval for the reparations program.
Registering to Vote
My dependent variable is registering to vote, an example of institutional political participation that occurs within the formal political system. Voter registration was reopened in early 1987 before the 1988 plebiscite where voters indicated whether they supported an end to Pinochet’s rule (Navia Reference Navia2004). Citizens registered in person with SERVEL clerks adding them to the voting registry.Footnote 11 Registering before 2012 was voluntary, but after registering, voting in future elections was mandatory. As a result, registration likely predicts subsequent turnout, since those who didn’t faced fines up to $220 USD.Footnote 12
What did registering to vote mean in this context? The general population had been unable to vote for their leader since 1970. For victims, the dictatorship period coincided not only with their experience of violence but a broader lack of outlets for political expression (political parties were banned). Registering to vote—and voting against Pinochet—could be empowering, as interviewees noted. One respondent shared: “For me, it was an emotional experience. It was so exciting… And when the “No” won, I cried and said “Finally, finally we are going to know what happened to our family.”Footnote 13 It could also feel risky or futile. Even after Pinochet was ousted, he retained a political position and much of his administration remained powerful, creating the perception that the government might be hostile toward victims. Another interviewee noted: “The return to democracy was full of agreements that let Pinochet and the entrepreneurs control everything. In the end, they tricked us.”Footnote 14
For the 1988 plebiscite, 92% of the voting age general population registered to vote and around 90% turned out (Contreras and Navia Reference Contreras and Navia2013). It was different for surviving victims. The top panel of Figure 2 compares the proportion of surviving victims and general public that registered over time (refer to Figure A3 in the Supplementary Material for annotations highlighting key transitional justice developments).Footnote 15 The bottom panel shows the raw numbers of surviving victims registering each year. The gap between victims, whose registration rate increased from 39% in 1988 to 67% in 2010, and the general population narrowed over time.Footnote 16
Surviving Victim Registration Trends
Note: Points correspond to share of surviving victims and general population registered to vote. Y-axis portrays years, from 1987 when registration reopened to 2010. Dashed red line indicates Valech Report release. General population data are from Contreras and Navia (Reference Contreras and Navia2013). Surviving victim data from Comisión Nacional Prisión Política y Tortura (2005) and Comisión Asesora Presidencial para la Calificación de Detenidos, Desaparecidos, Ejecutados Políticos y Víctimas de Prisión, Política y Tortura (2011).

Figure 2. Long description
The image consists of two vertically stacked panels sharing a common x-axis representing years from 1987 to 2010.
Top Panel: Line Graph
* The y-axis is labeled Proportion registered, ranging from 0.0 to 1.0.
* A dashed line represents the Share of general population registered. It starts at approximately 0.9 in 1988 and shows a gradual, steady decline to about 0.7 by 2010.
* A solid line represents the Share of surviving victims registered. It begins at approximately 0.2 in 1987, rises sharply to 0.4 by 1988, and then maintains a steady upward trend, reaching nearly 0.7 by 2010.
* A vertical dashed red line is positioned between 2004 and 2005, labeled Valech Report. At this point, the two lines begin to converge.
Bottom Panel: Bar Chart
* The y-axis is labeled Count of victims registering, ranging from 0 to 8000.
* The x-axis shows individual years from 1987 to 2010.
* Large spikes in registration occur in 1987 (over 6000) and 1988 (over 8000).
* From 1989 to 2003, registration counts remain low, mostly under 1000 per year.
* Following the Valech Report vertical red line, there is a visible increase in annual registrations, with peaks in 2005 and 2009 reaching between 1000 and 2000 victims.
EVIDENCE ON EFFECT OF REPARATIONS
To investigate how material reparations shape political participation, I study two related questions. First, among nonvoting survivors of state violence, do reparations change political activity? Second, why might survivors’ participation change? Utilizing different methods to answer these questions triangulates across different types of data, providing a richer picture of post-repression complexities than is possible with a single-methodology study.
I also draw on evidence from different victim communities to capture a more holistic understanding of the political repercussions of transitional justice. I incorporate experiences of survivors with varying patterns of political participation before encountering transitional justice. My quantitative analyses focus on nonvoting survivors of state violence. These victims remained sidelined from the formal electoral process, perhaps due to the psychological ramifications of the harm they suffered, severe state distrust, and political disaffection. My qualitative evidence is drawn from politically active victim communities, who describe the symbolic dimension of reparations.
Evidence on Registration Rates
To assess the link between reparations and political activity, I first consider quantitative evidence. I constructed an original dataset that includes information on survivors, their inclusion in the reparations policy, and their voter registration status. Fine-grained reparations data from IPS were obtained through Chile’s Transparency Law with information about each of the surviving victims approved for monthly reparations, all of whom provided testimony to the Valech commission and were listed in the Valech Report (IPS 2018b). These data include approval dates, full names, birth dates, genders, and municipalities of residence (IPS 2018c; 2018d). Table 1’s total sample column summarizes these variables. Using survivors’ full names, I linked these data to voter registration files, formerly available on the Electoral Commission’s (SERVEL) website (Servicio Electoral de Chile 2010). The electoral data capture registration dates until late 2010, soon after which automatic registration was introduced.
Summary Statistics for Demographic, Independent, and Dependent Variables

Table 1. Long description
The table contains five main rows of data across two primary groups: Total sample (N = 22,736) and Narrowed sample (N = 5,432). Each group is divided into Mean and Range columns.
* Age: The Total sample has a mean of 54 (range 18 to 88), while the Narrowed sample has a mean of 53 (range 18 to 87).
* Gender: The Total sample is 17.5% Female and 82.2% Male. The Narrowed sample is 18.8% Female and 80.3% Male.
* Provinces: Distribution in the Total sample is 39.1% Santiago, 6.5% Concepción, and 6.0% Valparaíso. In the Narrowed sample, it is 45.5% Santiago, 6.0% Concepción, and 6.6% Valparaíso.
* Reparations approved: The Total sample mean date is July 2007 (range January 2005 to December 2017). The Narrowed sample mean date is July 2005 (range January 2005 to July 2010).
* Voter registration: The Total sample mean date is July 1993 (range February 1987 to September 2010). The Narrowed sample mean date is October 2007 (range April 2005 to September 2010).
Because reparations aren’t randomized in a controlled experiment, examining whether they shape political activity poses a number of identification challenges that must be addressed to approach a causal interpretation. First, I limited my quantitative analysis to individuals who had not yet registered to vote when reparations were introduced in 2005. This group represents the only segment of the survivor population whose registration status could be influenced by reparations. Despite being eligible to register for nearly two decades before the implementation of reparations, these nonvoting survivors had not engaged in the formal electoral process, meaning that their voices were absent from these political channels. They thus constitute an important group when it comes to democratic representation and enfranchisement.
A core challenge in assessing the impact of reparations lies in identifying an appropriate counterfactual group whose behaviors might mirror those approved for reparations in a hypothetical scenario where they were not enrolled in a reparations program. A potential approach is to compare, among those unregistered to vote when reparations began, survivors who claimed reparations to those who did not. Figure A2 in the Supplementary Material illustrates that survivors who claimed reparations registered at higher rates after compensation began (IPS 2018b, IPS 2018e, Servicio Electoral de Chile 2010). However, potential systematic differences—such as socioeconomic status or level of awareness—between survivors who claimed reparations in person at IPS and those who did not would render them unsuitable counterfactuals (IPS 2018b; 2018e; Servicio Electoral de Chile 2010). One interviewee, for example, noted that survivors who did not claim reparations tended to be poorer and less informed.Footnote 17 Survivors claiming reparations may have higher levels of civic trust or political activity, which could drive both their motivation to seek compensation and their subsequent voter registration. The opportunity and decision to claim reparations may be influenced by various factors, including the desire for recognition, and should be explored in future research. I focus solely on those who have chosen to claim reparations to address concerns of self-selection.
In narrowing my sample to only unregistered survivors who eventually claimed reparations, I focus on the time period in grey in Figure 3 and the corresponding white cell in Table A2 in the Supplementary Material. Table 1 suggests that this subset of 5,432 surviving victims are similar in age, gender, and geographic representation to the overall population of survivors claiming reparations.Footnote 18 Despite their demographic similarities to voting survivors, this group of nonvoting survivors possess two important characteristics: they were unregistered when reparations began, making them a crucial group to study; and they eventually received reparations, enabling an analysis of the impact of reparations while minimizing concerns of self-selection.
Timeline

Within the group of nonvoting surviving victims who claimed and were eventually approved for reparations, I focus on variation in the timing of their approval to examine reparations’ effect on the probability of registering to vote. A key identification assumption is parallel trends: that the change in behavior of those approved for reparations in a given month (had they not been approved that month) can be approximated using the behavior of individuals approved in a later month. However, causal identification might still be threatened if individuals approved earlier or later differed systematically. To mitigate this possibility, I use plausibly exogenous, staggered approval timing from the bureaucratic process.
First, it is worth noting that when surviving victims verify their identity with IPS, they have already testified before the Valech Commission and had their account verified. IPS then takes over the process and initiates a technical multi-step approval procedure to grant surviving victims access to the reparations program. This approval process includes validation at multiple stages, likely enhancing its integrity and preventing potential misuse.
IPS’s procedures introduce plausibly exogenous variation in the process, specifically in the month when a claim is processed and a surviving victim is approved for the program. According to conversations with IPS employees, approval timing varies across cases and is determined by internal, multi-step IPS procedures. Internal workflows are unobserved. I treat approval timing as plausibly exogenous to other individual-level determinants of voter registration, an assumption which is untestable but supported by diagnostics described below. Although individuals choose when to claim their reparations, I treat the plausibly exogenous bureaucratic timing of approval as a starting point to estimate the likelihood of registering to vote in the months thereafter.
Once approved, survivors are notified, and payments begin soon after, continuing indefinitely.Footnote 19 While I lack data on the timeline between requests and approval for each survivor, the process often spans month but exact durations vary.Footnote 20 Once an individual is approved, I consider them “treated,” and this status is irreversible.
To estimate the effects of reparations, I constructed a monthly panel dataset of individuals who were approved between 2005 (when payments began) and late 2010 (when the voting data end, soon before voluntary registration ended) (see Figure A1 for the monthly distribution of approvals). Since the second Valech Report was not released until 2011, I focus on individuals listed in the first report. Survivors’ approvals are staggered across individuals and across time.
Given these complexities, a two-way fixed effects model estimated with ordinary least squares would be poorly suited for uncovering the average treatment effect on the treated (ATT) and decomposing it over time. Recent econometric literature has highlighted that these estimators return biased results when treatment effects are heterogeneous and occur over multiple time periods. This is partly because they use already-treated units as the comparison group for newly-treated units (de Chaisemartin and D’Haultfoeuille Reference de Chaisemartin and D’Haultfœuille2020; Goodman-Bacon Reference Goodman-Bacon2021; Sun and Abraham Reference Liyang and Abraham2021). Indeed, in my case, decomposing the weights reveals that 92.11% of the OLS estimate in a two-way fixed effects model would be calculated from contrasts that use already-treated units as controls, posing a significant problem for uncovering the treatment effect (Flack and Jee Reference Flack and Jee2022).
Fortunately, several newly proposed estimators avoid this problem. I utilize the estimator proposed in Callaway and Sant’Anna (Reference Callaway and Sant’Anna2021) using the did R package (Callaway and Sant’Anna Reference Callaway and Sant’Anna2022). This estimator computes group-time ATTs by comparing voter registration rates of surviving victims unregistered at the program start approved in a given month to those who had not yet been approved but eventually would be. Aggregating the group-time ATTs into an event study allows me to consider the dynamic effects of reparations and to assess whether the monthly effects following approval can help identify the mechanisms driving the results.
Generally, this empirical approach provides reliable causal estimates, assuming that, absent approval, those approved for reparations in any given month would have followed the same voter registration trajectory as those approved in a later month, allowing differences in voter registration patterns to be attributed to the reparations approval itself. However, the Callaway and Sant’Anna’s (Reference Callaway and Sant’Anna2021) estimator permits the incorporation of covariates, which allows for a weaker, conditional parallel trends assumption: we only need assume that survivors with the same observable characteristics would follow the same voter registration patterns in the absence of reparations approval. I argue that this assumption is reasonable due to my focus on a specific subgroup of unregistered survivors and the plausibly exogenous variation in approving reparations claims. Those approved before and after the median approval date are substantively similar in age, gender, and the urban/rural classification of their community, although some of the differences are statistically significant (see Table A5 in the Supplementary Material). To probe the credibility of this identifying assumption, I present estimates before treatment to check for systematic differences in voter registration patterns across groups before reparations.
In my analysis, I include gender and age covariatesFootnote 21 and employ the doubly robust procedure suggested by Callaway and Sant’Anna (Reference Callaway and Sant’Anna2021). This procedure involves first estimating a propensity score based on the covariates. The second component uses a weighted regression framework to compute ATTs that compare registration trends between surviving victims with similar observable characteristics who have been approved and those who have yet to be approved for the reparations program. The former group can be thought of as the treatment group, while the latter acts as a control. The inclusion of a control group helps to account for and mitigate the influence of trends in voter registration unrelated to reparations. This design ensures that observed changes in voter registration can be more confidently attributed to the impact of reparations approval rather than other external factors.
I estimate a set of event-study treatment effects which capture the monthly treatment effect of reparations on registering to vote. Formally, the Callaway and Sant’Anna method estimates a set of building block parameters that compare individuals approved in any given month to those approved in a later month, conditional on gender and age covariates. Then, effects can be aggregated across treated units using the following formula:

Here, e represents the event-time in months to or from reparations approval.Footnote
22 G corresponds to the time period an individual is first treated, ranging from g = 2,...τ—the total time periods in the panel. This estimates the average treatment effect of reparations at different durations of involvement in the policy. Specifically, the quantity
$ \theta (e) $
 captures the monthly treatment effect of reparations on voter registration by calculating the weighted average of the corresponding monthly ATTs in any given month e relative to the period before treatment.Footnote
23
Results are presented in Figure 4 which plots the
$ \widehat{\theta}(e) $
 estimates for each month e. Most individuals are approved early in the study window (see Figure A1); consequently, post-treatment estimates primarily reflect surviving victims enrolled in the initial months. Standard errors are bootstrapped and clustered at the individual-level. Post-treatment estimates can be interpreted as the difference in registration rates after e months among those approved for reparations compared to those who had not yet received reparations.Footnote
24 Full results can be found in Table A7 (Column 1) in the Supplementary Material with aggregated results in Table A6 in the Supplementary Material. At month 0 (first treated month), I estimate a 0.4 percentage point increase in registration. In the months that follow, the dynamic effects estimated demonstrate a consistent average increase in the propensity to register to vote. After two months, the estimated registration rate is 2.01 percentage points higher on average. The monthly effects continue to grow in magnitude until nine months after compensation, when the effect reaches an 8.71 percentage point increase in registering to vote. From month 9 to month 12, the monthly effect is similar in size, reaching a 9.16 percentage point increase a year after approval. Compared to other interventions that measure downstream voter turnout and registration, these results are quite large. Conditional cash transfers in Mexico and face-to-face canvassing in the United States, for example, both generate a 7 percentage point effect on turnout (De la O Reference De la O2013; Green, Gerber, and Nickerson Reference Green, Gerber and Nickerson2003), while registration drives have yielded a 4.4% increase (Nickerson Reference Nickerson2015).
Estimates of Reparations on Voter Registration for Surviving Victims Approved for Reparations
Note: Coefficient Plot. Red points correspond to
$ \widehat{\theta}(e) $
 from Equation 1. Grey points correspond to pre-treatment values (estimated relative to immediately preceding period). Plot with pre-treatment values estimated relative to the period before treatment in Figure A4. Standard Errors are clustered at the individual level. Lines indicate 95% confidence intervals. Full results are in Table A7.

Figure 4. Long description
The horizontal X axis is labeled Months to approval, ranging from minus 12 to 12. The vertical Y axis is labeled Change in registration, ranging from 0.00 to 0.10. A dashed horizontal baseline is set at 0.00.
* Pre-treatment data (Before): Grey points from month minus 12 to minus 1. These points hover closely around the 0.00 baseline with small vertical error bars, indicating no significant change in registration prior to approval.
* Post-treatment data (After): Red points starting at month 0 and continuing to month 12.
* Trend: From month 0, there is a sharp, positive linear increase in registration. The values rise from approximately 0.005 at month 0 to nearly 0.09 by month 10, where the curve begins to plateau.
* Confidence Intervals: Each red point is bisected by a vertical line representing a 95 percent confidence interval. These intervals widen slightly as time progresses but remain entirely above the zero baseline from month 1 onwards.
The observed temporal trend in Figure 4 could support an economic and symbolic channel. While the rate of increase slows around month 8, the effect remains substantial, indicating a lasting impact. Recipients’ continued engagement with the reparations process could foster growing faith in the political system, motivating further political engagement. Simultaneously, the patterns could align with the economic channel, if the increase in registration were tied to individuals’ socioeconomic statuses.
To probe the plausibility of parallel trends, Figure 4 plots pre-treatment estimates for the 12 months prior to approval. I adopt the default approach in Callaway and Sant’Anna (Reference Callaway and Sant’Anna2021) and use the immediately preceding period as the base period in pre-treatment periods, meaning the coefficients correspond to the average differences in registration rates between consecutive periods. Results with a universal base period (where pre-treatment coefficients correspond to differences relative to the month just prior to approval) can be found in Figure A4 and Columns 3–4 in Table A7 in the Supplementary Material.Footnote 25 In both presentations, the pre-treatment estimates (presented in grey) suggest some evidence of differential pre-trends, but reassuringly, differences are small in magnitude, relatively distant from treatment onset, and are not indicative of longer-term differences (see Figure A7 in the Supplementary Material). To examine how the differential pre-trends impact the main conclusions, Figures A11–A13 in the Supplementary Material implement the sensitivity analysis procedure from Rambachan and Roth (Reference Rambachan and Roth2023; Reference Rambachan and Roth2024) and consider the results under different potential magnitudes of violations in parallel trends. The findings remain robust even when the violations are significantly larger than those observed in the periods just before the treatment but are sensitive to hypothetical violations of a similar magnitude to those occurring over a longer pre-treatment period.
These results are robust to a number of alternative strategies and specifications. First, one might question whether those granted access to the reparations program later in the panel period serve as adequate counterfactuals for those granted access earlier. I narrow the panel period to the first year only and find consistent results (Figure A9 in the Supplementary Material). I next estimate the treatment effects with a control group not treated during the study period; Figure A6 in the Supplementary Material suggests that results are smaller in magnitude but remain positive and significant. Third, a potential downside of event-study-type estimators is that the composition of groups used to compute effects might vary since some groups have been exposed to treatment longer than others. I thus consider only groups exposed to treatment for 12 months and estimate effects over a 12 month period (Figure A5 in the Supplementary Material). The results in Figure 4 do not account for how the effect might vary across calendar time. While there is indeed variation, as Figure A10 in the Supplementary Material suggests, the treatment effect is positive during the vast majority of months considered. In addition, I find similar results to Figure 4 when re-estimating the specification without covariates (Table A7, Column 2 in the Supplementary Material), using Callaway and Sant’Anna’s outcome regression procedure instead of doubly robust (Figure A15 in the Supplementary Material), and with a matching method (Imai, Kim, and Wang Reference Imai, Kim and Wang2023; Kim et al. Reference Kim, Rauh, Wang and Imai2024) (Figure A16 in the Supplementary Material).
I took several steps to mitigate the possibility that politically active victims who are more likely to both claim reparations and register to vote drive the results. All those in the sample testified before a truth commission, claimed reparations, and were eventually approved. I isolate the effect of reparations approval by leveraging plausibly exogenous variation in the timing of approval. Including only those claiming and eventually approved for the reparations program eliminates the possibility that the results are driven by differences between those who pursued reparations and those who did not. I also restricted my analysis to survivors who were unregistered to vote when reparations began, excluding individuals who registered between 1987 and 2005 and may have been especially politically active, resulting in a more comparable sample, though unobserved traits (e.g., latent political interest) could still correlate with approval timing and registration.
Heterogeneous Patterns
I consider possible alternative interpretations of the main results presented in Figure 4. While the quasi-experimental design and inclusion of covariates in the main analysis improve comparability between groups, one might be concerned about selection effects, particularly differences between individuals who claimed reparations earlier versus later. Such differences could threaten the causal interpretation of the findings by introducing omitted variable bias. To alleviate these concerns, I first consider effects by age group, as older or younger individuals might be more inclined to claim reparations and register to vote. I bin my sample into three different age groups and estimate Equation 1 separately for each. If the coefficients differed substantially, it would indicate support for an alternative interpretation where age confounds the results. As depicted in Figure 5, the effect of reparations is positive and significant for all three groups.
Estimates of Reparations on Voter Registration by Age Group
Note: Coefficient plot. Points correspond to
$ \widehat{\theta}(e) $
 from Equation 1 estimated on subsets of total sample. Standard Errors are clustered at the individual level. Lines indicate 95% confidence intervals. Grey points correspond to pre-treatment values (estimated relative to immediately preceding period) while colors correspond to treatment effects for each age bracket. Full results are in Table A9 in the Supplementary Material.

Figure 5. Long description
A coefficient plot with a Y-axis labeled Change in registration ranging from -0.02 to 0.12 and an X-axis labeled Months to approval ranging from -12 to 12. A horizontal reference line is at 0. A legend on the right identifies three groups: Older (purple circles), Middle (black triangles), and Younger (teal squares).
* Pre-treatment (Months -12 to -1): All data points are light grey and hover near the 0 line, indicating no significant pre-existing trend.
* Treatment (Month 0): The data points transition to colors. The Older group shows a slight positive change, while Middle and Younger groups remain near 0.
* Post-treatment (Months 1 to 12): All three groups show a steady, linear increase in voter registration. The Younger group (teal squares) shows the highest magnitude of change, reaching approximately 0.10 by month 12. The Middle group (black triangles) follows with a peak near 0.09. The Older group (purple circles) shows the lowest relative increase, ending near 0.08.
* Error Bars: Vertical lines through each point represent 95% confidence intervals, which widen slightly as time progresses from the treatment month.
Another alternative interpretation might suggest that the results reflect the urban/rural divide. IPS offices and voter registration sites may be more accessible in urban areas, facilitating both requesting reparations and registering to vote. I utilize municipality-level data from the 2002 Chile census and consider a municipality “urban” if the percentage of inhabitants living in urban environments is greater than the national average (86.6%).Footnote 26 As above, I consider these populations separately and plot the results in Figure 6.
Estimates of Reparations on Voter Registration by Geography
Note: Coefficient plot. Points correspond to
$ \widehat{\theta}(e) $
 from Equation 1 estimated on subsets of total sample. Standard Errors are clustered at the individual level. Lines indicate 95% confidence intervals. Grey points correspond to pre-treatment values (estimated relative to immediately preceding period) while colors correspond to treatment effects for each type of municipality. Full results are in Table A10 in the Supplementary Material.

Figure 6. Long description
The Y-axis represents the Change in registration, ranging from negative 0.02 to 0.18. The X-axis represents Months to approval, ranging from negative 12 to positive 12. A horizontal baseline is set at 0.00.
* Pre-treatment phase (Months negative 12 to negative 1): Data points for both groups are grey and cluster closely around the 0.00 baseline with overlapping confidence intervals, indicating no significant difference prior to approval.
* Post-treatment phase (Months 0 to 12): Both groups show a positive linear increase in voter registration, but they diverge significantly.
* Rural series (Black triangles): Shows a steeper upward trend, starting near 0.01 at month 0 and rising to approximately 0.15 by month 12. The vertical confidence interval lines for rural data are longer, indicating higher variance.
* Urban series (Purple circles): Shows a more gradual upward trend, starting near 0.00 at month 0 and rising to approximately 0.09 by month 12. The confidence intervals are tighter than the rural series.
* Comparison: By month 12, the effect on rural voter registration is nearly double that of urban registration.
Both groups respond to reparations; the positive coefficient is consistent across urban and rural settings. The possibility that reparations are particularly mobilizing for those in rural areas warrants further research, as it could shed light on the legacy of violence across different settings and how this shapes responses to transitional justice.
Finally, while I study surviving victims who have all experienced non-lethal violence, the specific abuses they suffered vary in type and severity, potentially influencing both survivors’ engagement with reparations and politics. Data on the nature of violence suffered have not been released by the Valech commission. However, the Valech Report (Comisión Nacional Prisión Política y Tortura 2005) mentioned that “almost all” (252) of the women who testified were victims of sexual violence, suggesting a correlation between a survivor’s gender and the type of violence suffered. Figure 7 suggests that the effects are similar (though somewhat smaller in magnitude) for women compared to men.
Estimates of Reparations on Voter Registration by Gender
Note: Coefficient plot. Points correspond to
$ \widehat{\theta}(e) $
 estimated on subsets of total sample. Standard Errors are clustered at the individual level. Lines indicate 95% confidence intervals. Grey points correspond to pre-treatment values (estimated relative to immediately preceding period) while colors correspond to treatment effects for each gender. Full results are in Table A11 in the Supplementary Material.

Figure 7. Long description
The Y-axis is labeled Change in registration, ranging from -0.02 to 0.12. The X-axis is labeled Months to approval, ranging from -12 to 12. A horizontal reference line is set at 0.00.
* Pre-treatment phase (Months -12 to -1): Data points for both groups are light grey and hover near the 0.00 baseline with small confidence intervals, indicating no significant prior trend.
* Treatment phase (Months 0 to 12): At month 0, effects begin to rise.
* Men (purple circles): Show a steep, linear increase in registration, starting near 0.00 at month 0 and rising steadily to approximately 0.10 by month 12.
* Women (black triangles): Show a similar upward trend but at a lower magnitude than men, reaching approximately 0.07 by month 12.
* Confidence Intervals: Vertical lines through each point represent 95 percent confidence intervals. These intervals widen as time progresses from the treatment point, particularly for the women's data group.
* Legend: Located on the right, purple circles represent Men and black triangles represent Women.
Evidence of Symbolic and Economic Mechanisms
Quantitative evidence My findings indicate that individuals register to vote at higher rates after being approved for reparations. I suggested earlier that increased participation could be attributed to both economic and symbolic factors, and the temporal pattern of the findings were consistent with both. To further consider the empirical implications linked to the economic and symbolic channels, I first incorporate economic data. If registration rates rise proportionally to the amount of money received, it would support the idea that the increase in voter registration is due to reparations’ economic dimension.
Because the standard of living and average income differ significantly in various Chilean municipalities, the purchasing power of a reparation payment varies. Reparations payments of the same dollar would be relatively more valuable in lower-income municipalities and relatively less in higher-income areas.Footnote 27 If reparations’ effect is driven by providing an economic boost, then individuals in low-income communities might increase registration rates at a higher clip than those in high-income communities. I use data from Chile’s 2003 Encuesta de Caracterización Socioeconómica Nacional (CASEN) to classify municipalities based on average income (Vargas Reference Vargas2022).Footnote 28 Specifically, I divide the sample into terciles—low, middle, and high income—based on the distribution of municipality-level income. I estimate Equation 1 separately for each group. The results, which are presented in Figure 8 (full results in Table A8 in the Supplementary Material), report similar trends across all groups. Individuals in lower-income municipalities do not register at higher rates than those in middle- or higher-income areas, suggesting that the effect of reparations is not concentrated among those for whom the payment has greater relative value.Footnote 29
Estimates of Relative Reparations Amount on Voter Registration
Note: Coefficient plot. Points correspond to
$ \widehat{\theta}(e) $
 for from Equation 1 estimated separately for each income level. Standard Errors are clustered at the individual level. Lines indicate 95% confidence intervals. Grey points correspond to pre-treatment values (estimated relative to immediately preceding period) while colors correspond to treatment effects for each municipal income level. Full results are in Table A8 in the Supplementary Material.

Figure 8. Long description
The x-axis is labeled Months to approval, ranging from minus 12 to 12. The y-axis is labeled Change in registration, ranging from minus 0.10 to 0.22 in increments of 0.02. A horizontal zero line serves as the baseline. A legend on the right identifies three groups: Low income represented by purple circles, Middle income by black triangles, and High income by teal squares.
* From months minus 12 to minus 1, all data points are light grey and cluster closely around the zero baseline, indicating no significant pre-treatment effect.
* At month 0, the treatment begins.
* From months 1 to 12, all three income groups show a positive upward trend in registration.
* The Middle income group (black triangles) shows the steepest increase, reaching a coefficient of approximately 0.11 by month 12.
* The Low income group (purple circles) follows with an increase to approximately 0.08.
* The High income group (teal squares) shows the smallest relative increase, plateauing around 0.07.
* Vertical lines through each point represent 95% confidence intervals, which generally widen as time from approval increases.
Importantly, the lack of a relationship between registration rates and purchasing power might mean that the economic pathway is less influential than the symbolic, but it may also be that the amount of reparations payments is insufficient to alter the cost of political participation.
Qualitative evidence To further examine the economic and symbolic channels, I incorporate two sources of qualitative data: survivor testimonies and interviews. To understand surviving victim concerns prior to reparations and the ways they discussed the harms they suffered, I turned to testimonies gathered in the years immediately preceding the Valech commission.
In the early 2000s, an NGO called Corporación de Promoción y Defensa de los Derechos del Pueblo (The Corporation for the Promotion and Defense of People’s Rights, hereafter CODEPU), collected over one thousand testimonies to “illustrate the gravity and magnitude” of torture committed during the Pinochet era and persuade the government to convene a truth commission (Rojas et al. Reference Rojas, Uribe, Méndez, Díaz and Espinoza2002; Reference Cuevas, Victor, Rojas and Baeza2003). CODEPU asked survivors to provide personal information (name, national identification number, age, and profession) and recount their torture experiences. Specifically, they were asked:
-
• Who detained you?
-
• Where did they take you?
-
• What type of torture were you subjected to?
-
• Who conducted the torture? For how long?
-
• Who was detained with you?
-
• Were you subjected to a trial? What charges were made against you?
-
• What type of consequences has the torture had?Footnote 30
CODEPU delivered these testimonies in a series of reports: the first, containing roughly 500 testimonies was published in December 2002; the second, with an additional 600+ testimonies was published in December 2003; and the third, which included denunciations of perpetrators, was published in May 2004. Of the 1,222 total testimonies, I analyzed 1,004 testimonies from the first two collections. These testimonies, released before the implementation of the reparations policy, can be considered a “pre-treatment” expression of survivors’ thoughts about the harm they suffered and its consequences. This exercise serves two descriptive purposes. First, it sheds light on survivors’ salient concerns. Second, it enables me to identify different consequences of torture in the survivors’ own words, providing insights about why reparations have an impact. In particular, I can explore the prevalence of references to economic losses, which might suggest that reparations would assist in addressing lost resources and support individuals in moving forward. Additionally, I examine references to psychological harm, which might translate into distrust toward the institutions responsible for abuses and suggest that recognition from the state would hold particular significance.
I analyzed victim testimonies using both automated methods and hand coding (Roberts, Stewart, and Tingley Reference Roberts, Stewart and Tingley2015). Figures S1, S2, and S3 in the Supplementary Material present the output of automated methods and indicate that testimonies mainly recount individuals’ arrest and detention, describing where they were taken and the violence suffered. However, many testimonies also describe the consequences of torture. To categorize these references, I read through each testimony and manually coded mentions of (1) economic, (2) psychological, and (3) physical harm, with representative examples in Table 2. I then tallied the total number of testimonies in each category.
Excerpts from Testimonies Corresponding to Each Category

Table 2. Long description
The table consists of two columns titled Category and Example text.
* Economic category includes two excerpts. The first describes children left homeless and without medical assistance, and a wife selling furniture for food. The second describes the loss of a job leading to odd jobs and the loss of a full pension.
* Psychological category includes two excerpts. The first lists symptoms of pent-up rage, fear of police, feelings of persecution, and insecurity. The second mentions constant anxiety, depression, and nightmares.
* Physical category includes two excerpts. The first details permanent pain in the neck, hands, knees, and feet. The second describes a permanent scar in the left dorsal region resulting from blows received during detention.
Source: Rojas et al. Reference Rojas, Uribe, Méndez, Díaz and Espinoza2002; Reference Cuevas, Victor, Rojas and Baeza2003 accessed in the Museo de la Memoria y los Derechos Humanos Centro de Documentación (CEDOC), Santiago, Chile.
Figure 9 presents a Venn diagram illustrating how individuals discussed their victimization. The figure illustrates that survivors were most likely to describe the physical consequences of torture, followed by the psychological impacts. While 173 surviving victims (roughly 17% of testimonies) mentioned economic hardships resulting from torture, other salient concerns overshadowed economic factors.Footnote 31 Notably, 485 victims (48% of the total) didn’t discuss their victimization in economic, physical, or psychological terms, focusing solely on the details of their detention and torture.
Contents of Victim Testimonies
Note: Categorization of 1,004 testimonies from Rojas et al. Reference Rojas, Uribe, Méndez, Díaz and Espinoza2002; Reference Cuevas, Victor, Rojas and Baeza2003 accessed in the Museo de la Memoria y los Derechos Humanos Centro de Documentación (CEDOC), Santiago, Chile.

Figure 9. Long description
A Venn diagram with three overlapping circles representing different categories of testimonies.
* At the center intersection of all three circles is the value 67 (7 percent).
* The intersection between Psychological (top blue circle) and Physical (right grey circle) contains 116 (12 percent).
* The intersection between Psychological (top blue circle) and Economic (left white circle) contains 20 (2 percent).
* The intersection between Economic (left white circle) and Physical (right grey circle) contains 36 (4 percent).
* The non-overlapping portion of the Psychological circle contains 39 (4 percent).
* The non-overlapping portion of the Economic circle contains 50 (5 percent).
* The non-overlapping portion of the Physical circle contains 191 (19 percent).
* Outside of the Venn diagram, a label in the bottom right corner reads No mention: 485 (48 percent).
Analyzing these testimonies provides insights from over 1,000 surviving victims, most of whom do not appear in the quantitative analyses because they were already registered to vote when reparations began. This broadens the perspectives included in my analysis, but one might be concerned that the survivors who testified to CODEPU expressed consequences that differ from those experienced by the surviving victims featured in the central quantitative analyses. To address this, I searched the testimonies for the names of those included in the quantitative analysis. Among the 44 testimonies from these survivors, 16% (7) of them reference economic consequences, similar to the 17% (173) in the overall corpus, while more focus on the psychological and physical consequences of torture (see Figure S4 in the Supplementary Material).
The text data suggest that only a minority of surviving victims focus on economic losses prior to the implementation of reparations. However, it is possible that once established, survivors find them capable of addressing their economic needs. 51 in-depth interviews from August 2018 to May 2022 were conducted by the author, the research firm Ekhos, or research assistants. Thirty-six of these interviews were with family members, while 15 were conducted with surviving victims. The majority of interviewees were recruited through collaborations with three victims’ organizations and human rights lawyers who represented victims.Footnote 32 I discuss the ethics of this research in the Dataverse supplement.
Here, I incorporate evidence from the 15 interviews with surviving victims. It is important to caveat that my convenience sample represents a small fraction of surviving victims, namely those who actively engage with victims’ organizations, and, like the majority of surviving victims, had mostly registered to vote prior to the implementation of reparations (see Voytas Reference Voytas2025 for more information on those interviewed). The quantitative and text analyses help provide insight into behaviors among other survivors, such as those not registered to vote before 2005. Ideally, I would have interviewed members of this group; however, they are a challenging group to reach and interview. Despite this obstacle, I made efforts to speak with a diverse set of surviving victims. Interviews were conducted with residents of major metropolitan areas of Santiago, Valparaíso, and Valdivia, as well as with those from more rural areas of Paine and Buin, where many participants lived in poverty. Given the prevalence of common themes among this diverse group, I anticipate that their views have broad applicability to other types of victims, though considering their generalizability with additional interviews remains a task for future research.
Through in-depth interviews, I sought to obtain a fuller picture of how victims view the state’s response to violence and its influence on their attitudes and political engagement. Participants were asked about their experiences with transitional justice policies, both in a general sense and as recipients of reparations. Concerning transitional justice policies, surviving victims were asked what they considered the most important policy features. Their responses provide valuable insights, highlighting the importance of policies that provide symbolic reparation, as the excerpt below suggests:
There are very few measures of symbolic reparation in the country, and there should be more… There are memory sites, but their funding is at risk every year… and there is no public policy regarding education.Footnote 33
Additionally, in discussing their experiences with other transitional justice policies, particularly trials, survivors express disappointment with procedural aspects of the process. Interviewees note that the process is “slow, late, and tremendously unjust”Footnote 34 and that “sometimes I get the feeling that they are only bureaucratic procedures that very rarely do actually lead to trials and real judgments.”Footnote 35 These attitudes contrast with their perceptions of the procedural dimensions of reparations, which they view as reliable. Some also note that they were treated well by IPS employees, suggesting that they had a positive experience interfacing with the state, which could help lower the psychological cost of future political engagement, contributing to a feedback dynamic that might spur continued political activity.
Among all interviewees, the reparations process was well-known and well-understood. Respondents knew precisely how much money they received each month and on which day. When asked about their satisfaction with reparations, many individuals highlighted the economic dimension of reparations to express the policy’s inadequacy:
Look, the harm that was caused—it doesn’t have a price. I’ll never be able to recover what they took from me.Footnote 36
The reality of survivors from the dictatorship period is regrettable. Former prisoners are relatively elderly and many have disabilities resulting from their imprisonment and torture. And the amount of reparations is miserable, unlike other countries that have provided larger payments, like Argentina and Uruguay.Footnote 37
Surviving victims recognize that reparations fall short of providing a complete response to the crimes committed against them. Yet, some highlight the symbolic value they hold:
Before, I thought that there would be no sum of money that can repair this. And while there might not be, everything helps, especially for people who were from poor backgrounds. But the value isn’t just economic; it is symbolic.Footnote 38
The fact that there is a recognition from the state that this extermination policy existed [during the Pinochet era] and that it is symbolized by the benefits of the Rettig and Valech Commission, I think that is important.Footnote 39
As Figure 10 suggests, the surviving victims interviewed see reparations as a positive but flawed step. When it comes to the economic dimension of reparations, two key themes emerge: (1) surviving victims see money as incapable of addressing the injustice they suffered; and (2) they believe the monetary amount is insufficient. Therefore, while survivors have economic concerns and many describe the consequences of their victimization in economic terms, their discussions about reparations do not suggest that their monetary value can significantly impact levels of political engagement.
Bar Plot of Qualitative Interview Themes
Note: The X-axis corresponds to the percentage of surviving victims that referenced each theme along the Y-axis during 15 in-depth qualitative interviews. Interviews can discuss multiple themes.

Figure 10. Long description
The X-axis is labeled Percentage and ranges from 0 to 60 with increments of 20. The Y-axis lists five qualitative themes. From top to bottom, the data points are as follows.
* Money unable to address injustice: 60%.
* Reparations reliable or consistent: 53.33%.
* Provide recognition from state: 46.67%.
* Dollar amount inadequate: 46.67%.
* Wrong policy – goal should be justice for crimes committed: 26.67%.
All bars are light green with black outlines and the percentage values are printed inside the right edge of each bar.
The negative discourse surrounding the economic dimension of reparations suggests that the increase in voter registration occurs even despite dissatisfaction with low monetary payments. Although I do not mean to suggest that reparations have no economic value, I do not find support for the economic mechanism in this analysis. Still, this topic warrants further research, as it is unclear whether the lack of significant findings is a result of insufficient payments or the absence of an economic pathway.
Instead, the evidence points toward a symbolic channel. The qualitative results indicate that many victims express the losses they suffered in non-economic language. As noted in the theory section, the symbolic channel could involve lowering barriers to electoral engagement through participating in the reparations process and valuing the acknowledgment reparations provide. In interviews, some surviving victims explicitly note the symbolic significance embedded in compensation, the fair treatment they received in the reparations process, and the consistency, reliability, and dependability of payments. All of these could foster trust in the political system and motivate voter registration. Ultimately, future research can help to unpack the link between these symbolic micro-mechanisms, trust, and voter registration.
In addition, it is important to note that registering to vote does not necessarily indicate total endorsement of the reparations policy or the transitional justice framework as a whole. It could, in part, reflect a desire to voice discontent. As one interviewee put it when asked if she was satisfied with reparations: “The restoration of civic dignity, abilities, and the capacity to engage in society—that’s what we were asking for. The rights to seek truth and justice in the courts were not offered by the commission, none of that. Therefore, I am not satisfied, and I continue to demand… we continue to demand.”Footnote 40 Though survivors likely still have grievances, the reparations process might suggest that formal political institutions can be an avenue to address these concerns. In sum, registering to vote could signal satisfaction or disappointment with the reparations policy, and while the current work cannot shed light on the prevalence of one sentiment over the other, future research may provide more clarity.
CONCLUSIONS
In this paper, I suggest that a specific transitional justice policy—material reparations—is associated with increased voter registration among surviving victims. Most reparations recipients had registered to vote before enrolling in the program, meaning this increase is concentrated among previously nonvoting survivors. I highlight evidence consistent with reparations carrying symbolic significance beyond their economic value. For survivors, the reparations process can offer compelling evidence that formal political institutions can be venues to achieve advancements for victims.
From a participation perspective, these results are encouraging. While addressing past injustices requires comprehensive and multifunctional policy frameworks, these findings suggest that even small-scale financial support is associated with increased voter registration among previously unregistered surviving victims. After being granted access to the program, individuals wronged by the government and disengaged from electoral politics became more likely to participate in electoral politics. This, in turn, could contribute to a more inclusive and representative democracy.
These findings have policy implications for societies aiming to expand political participation and strengthen citizen-state relationships. Transitional justice policies like reparations can generate feedback effects, where surviving victims learn from their interactions and experiences, influencing their subsequent political involvement and choices. Policymakers should aim to create an environment that instills confidence and diminishes anxieties among survivors. By demonstrating transparency, predictability, and sensitivity in policy implementation, these barriers can be mitigated, encouraging greater civic involvement. This is easier said than done: effective execution of policies like reparations requires substantial investments, both in financial resources and institutional capacity (González-Ocantos Reference González-Ocantos2020). Policymakers can benefit from recognizing that the success of these policies relies on a well-equipped bureaucracy that can administer them fairly, reliably, and consistently.
What implications does this have for societies striving to promote reconciliation and stability? Conventional accounts of democratic participation suggest that it provides a way to channel grievances in a non-violent manner (Almond and Verba Reference Almond and Verba1963; Verba, Schlozman, and Brady Reference Verba, Schlozman and Brady1995), so we might expect increased electoral engagement to accompany democratic stability and reduced violence. This is especially critical in societies with histories of repression and a lack of outlets for dissent, where voting can provide a structured and non-violent avenue for groups to express grievances and work toward resolution. Research in post-conflict contexts suggests that these desirable outcomes are most likely when elections are high-quality and trustworthy (Donno, Morrison, and Savun Reference Donno, Morrison and Savun2022; Maldonado and Seligson Reference Maldonado, Seligson, Norris, Frank and Martinez2014). Future research should continue identifying the conditions under which increased democratic participation might promote lasting democratic stability and prevent repeated violence, especially in post-repression contexts.
How might these results generalize? A unique aspect of the Chilean case is the importance of the 1988 plebiscite. Voting “Yes” or “No” on Pinochet’s rule required voter registration, and 92% of the population registered. Consequently, the population whose voter registration could be affected by reparations is relatively small. While future research should carefully explore additional settings, positive effects among this group could imply similar or even stronger responses in other contexts. The surviving victims in my quantitative analyses are those who remained electorally disengaged for many years after the transition, perhaps due to the psychological consequences of torture and enduring distrust of political institutions, and approval is associated with increased voter registration among them. This suggests that the catalytic potential of reparations can overcome barriers to political engagement. Similar patterns could emerge in different contexts, perhaps even more prominently, among populations more inclined toward formal political involvement.
Another feature of the Chilean case worth noting is its high degree of state capacity. This research relies on bureaucratic collection of individual-level systematic data that allows me to explore micro-dynamics between receiving reparations and registering to vote. The feature that makes this research possible also might limit this study’s generalizability. In the Chilean case, though there are delays between soliciting reparations and approval, they tend to be a few months. Once this period has passed, payments are dependable and consistent. The same cannot be said for cases like Colombia, where as of 2023 most registered victims have yet to receive their owed reparations.Footnote 41 As mentioned in the theory section, reparations could increase the sense of injustice; this could be more likely in a case like Colombia than in Chile.
The work presented here contributes to literature examining the determinants of political participation broadly and after incidents of violence specifically: participation in transitional justice initiatives can affect political behavior, perhaps extending beyond the immediate objectives of the policies themselves. This work suggests that the creation of public policies—and participation in these policies—can also have meaningful impacts on individuals’ political participation. This oft-overlooked driver of political participation is relevant not just in post-violence contexts but in many situations where individuals and groups are targeted by and engaging with public policies. These results suggest that reparations can be a way to increase electoral participation, and that a modest monthly transfer can give voice to citizens who were previously unheard.
SUPPLEMENTARY MATERIAL
To view supplementary material for this article, please visit https://doi.org/10.1017/S0003055425100865.
DATA AVAILABILITY STATEMENT
Research documentation and data that support the findings of this study are available at the American Political Science Review Dataverse: https://doi.org/10.7910/DVN/TLLZUI. Limitations on data availability are discussed in the Dataverse.
ACKNOWLEDGMENTS
I am grateful to Lisa Baldez, Carrie Barnett, Michael Becher, Olivier Bergeron Boutin, Kyle Butts, Alicia Cooperman, Benjamin Crisman, Danielle Gilbert, Andy Guess, Alisha Holland, Will Horne, Gaileu Kim, Dean Knox, Jason Lyall, James Mao, Paul Novosad, Brendan Nyhan, Diego Ramos-Toro, Blair Read, José María Rodríguez-Valadez, Jake Shapiro, Manu Singh, Brandon Stewart, John Marshall, Deborah Yashar, Omer Zarpli, participants at PELA 2020, and three anonymous reviewers and the editors at the American Political Science Review for their feedback on this project. Thank you to Gabriela Atal, Nicolás Flores Bustos, Denisse Muñoz, and Enrique Gatica for their invaluable research assistance. I used OpenAI’s ChatGPT (GPT-4 and GPT-5) to assist with copy editing and preparation of replication materials. All analyses and interpretation are my own.
FUNDING STATEMENT
This research was funded by Princeton’s Bobst Center for Peace and Justice and Project in Latin American Studies, Innovations for Poverty Action’s Peace and Recovery Initiative, and a Peace Scholar Award from the United States Institute of Peace.
CONFLICT OF INTEREST
The author declares no ethical issues or conflicts of interest in this research.
ETHICAL STANDARDS
The author declares the human subjects research in this article was reviewed and approved by Princeton University and Dartmouth College and certificate numbers are provided in the text or Supplementary Material. The author affirms that this article adheres to the principles concerning research with human participants laid out in APSA’s Principles and Guidance on Human Subject Research (2020).
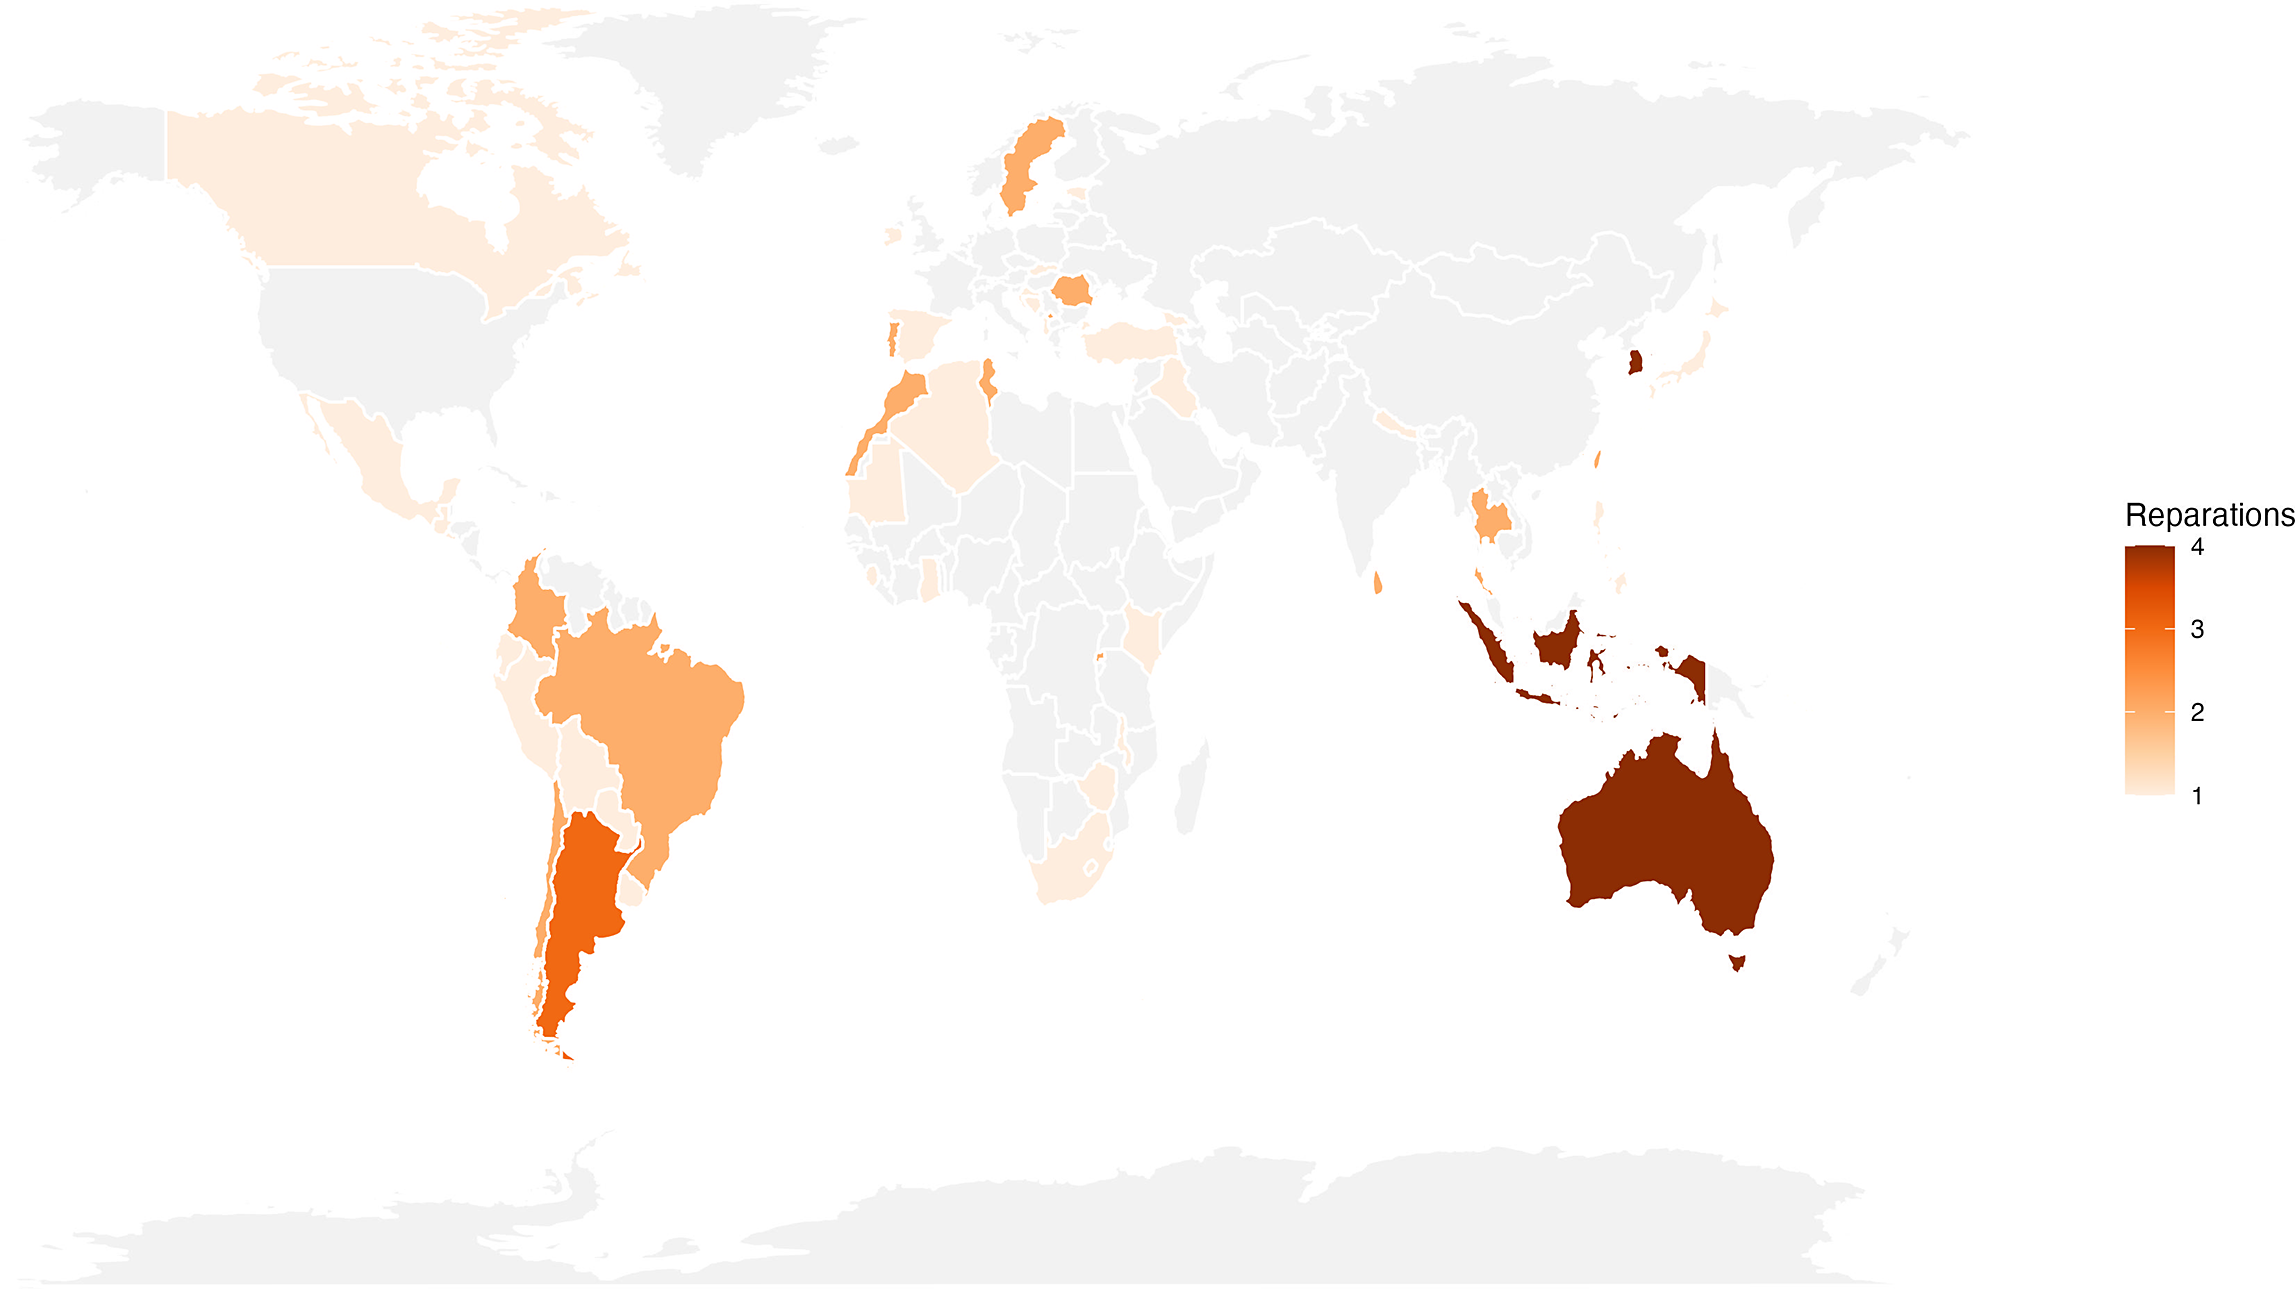
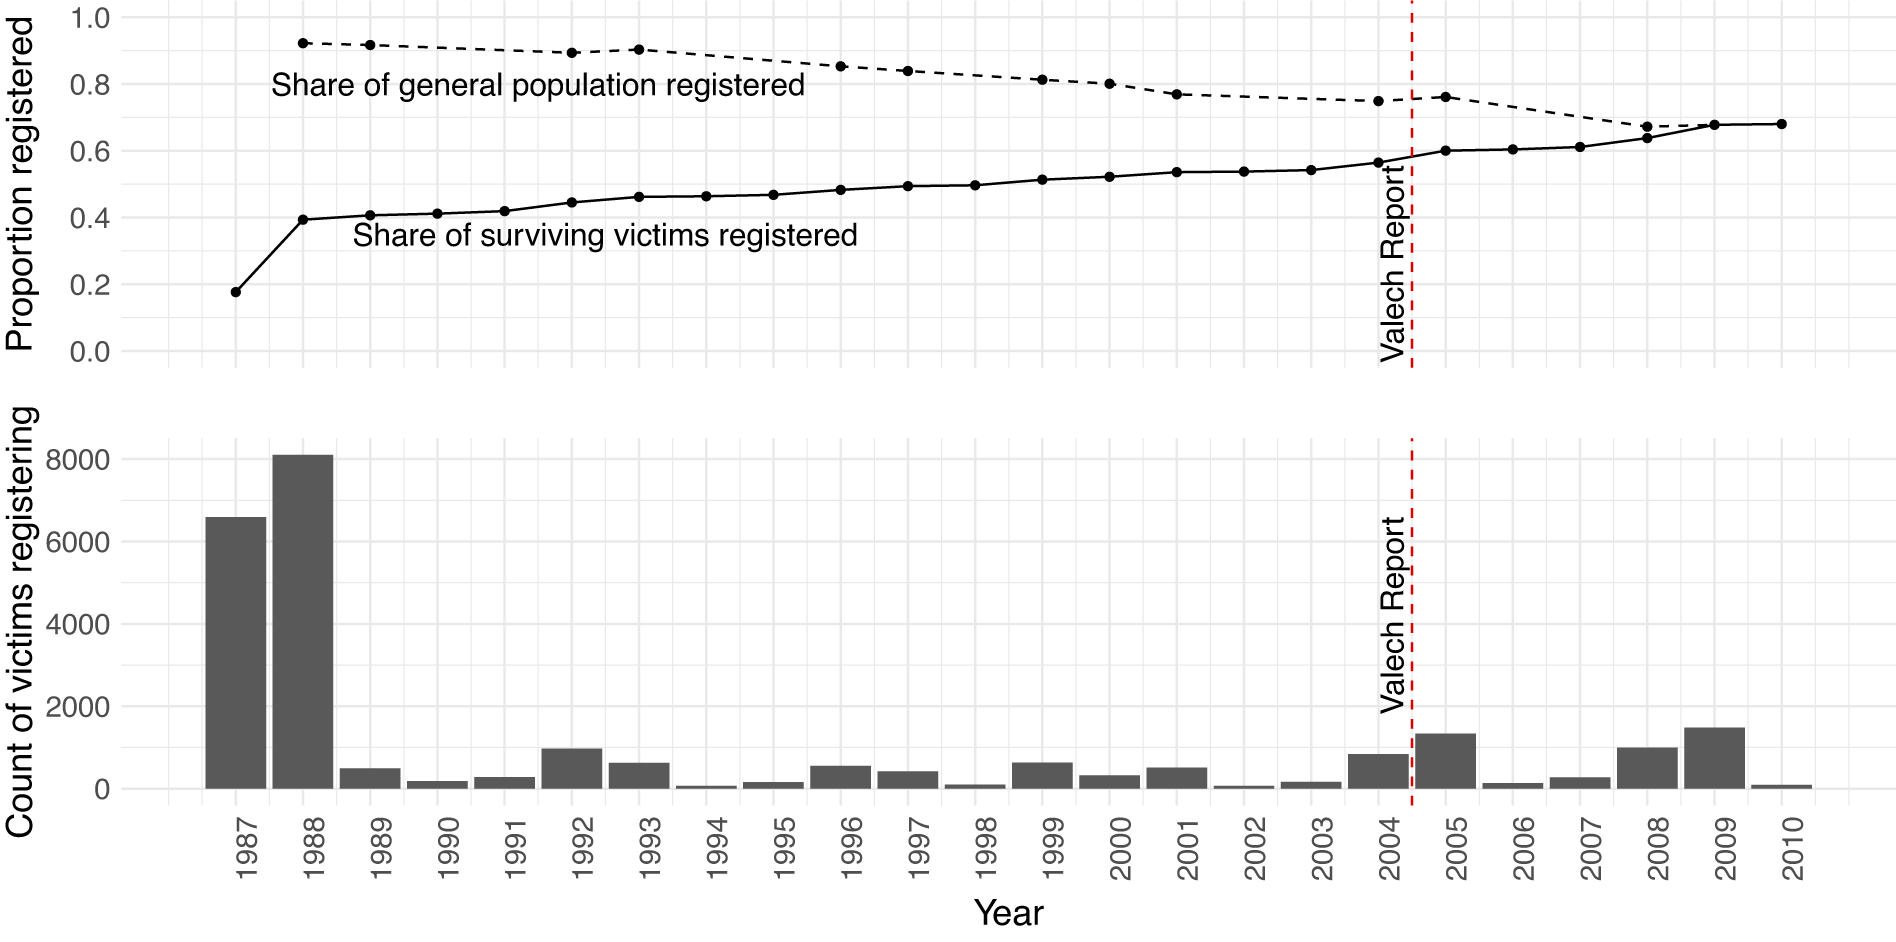
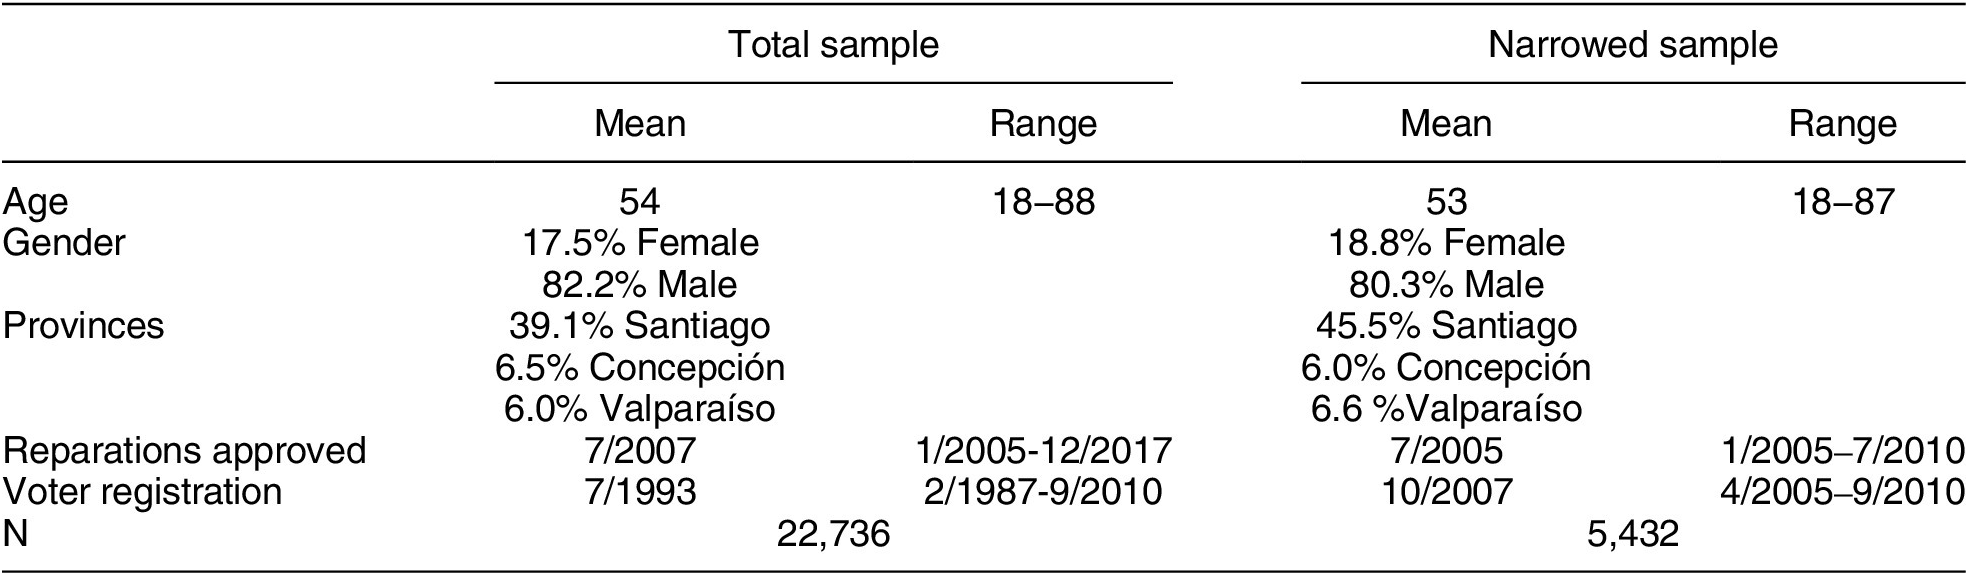
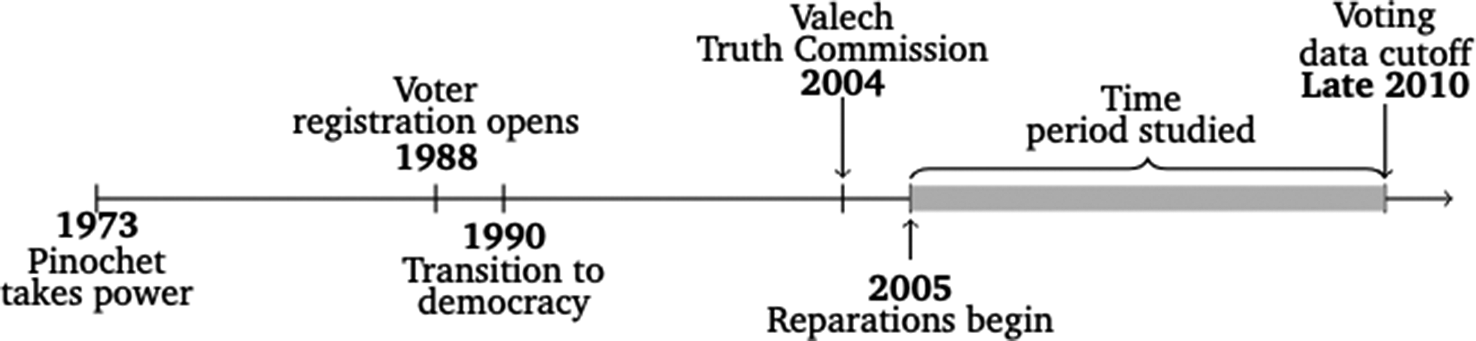
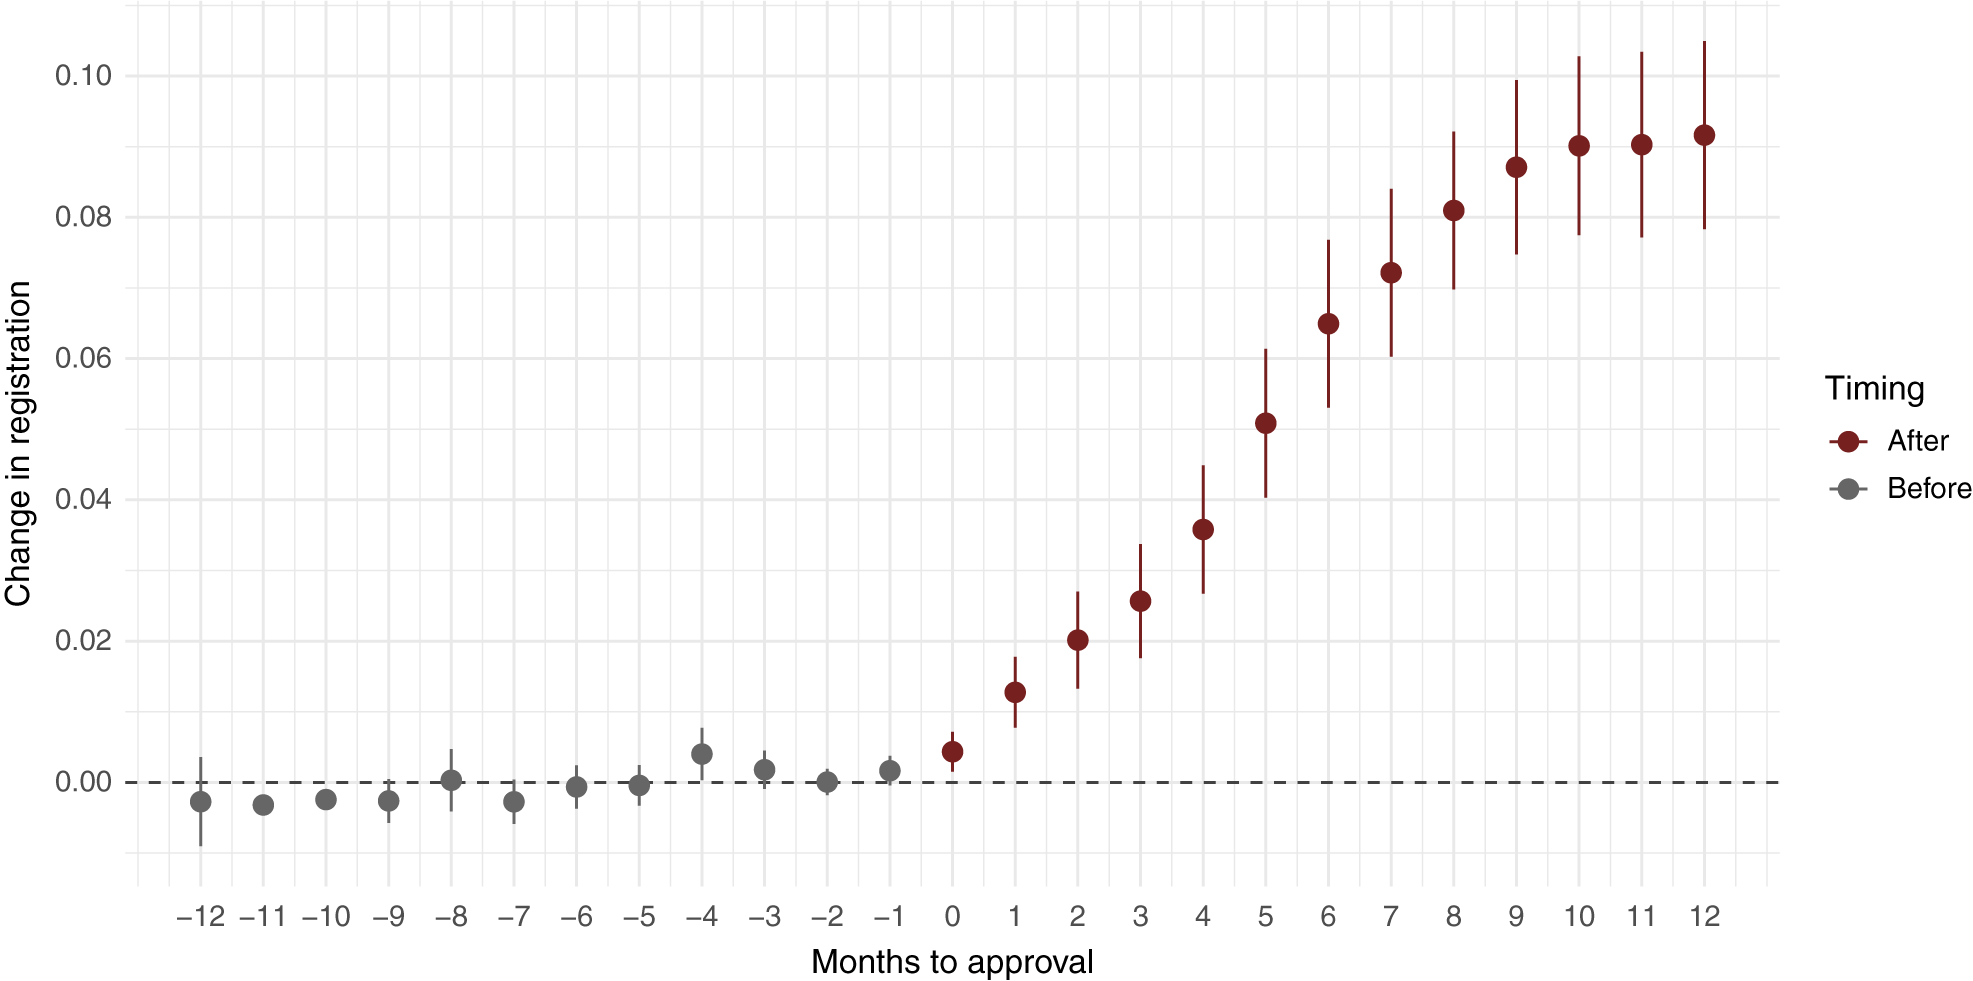

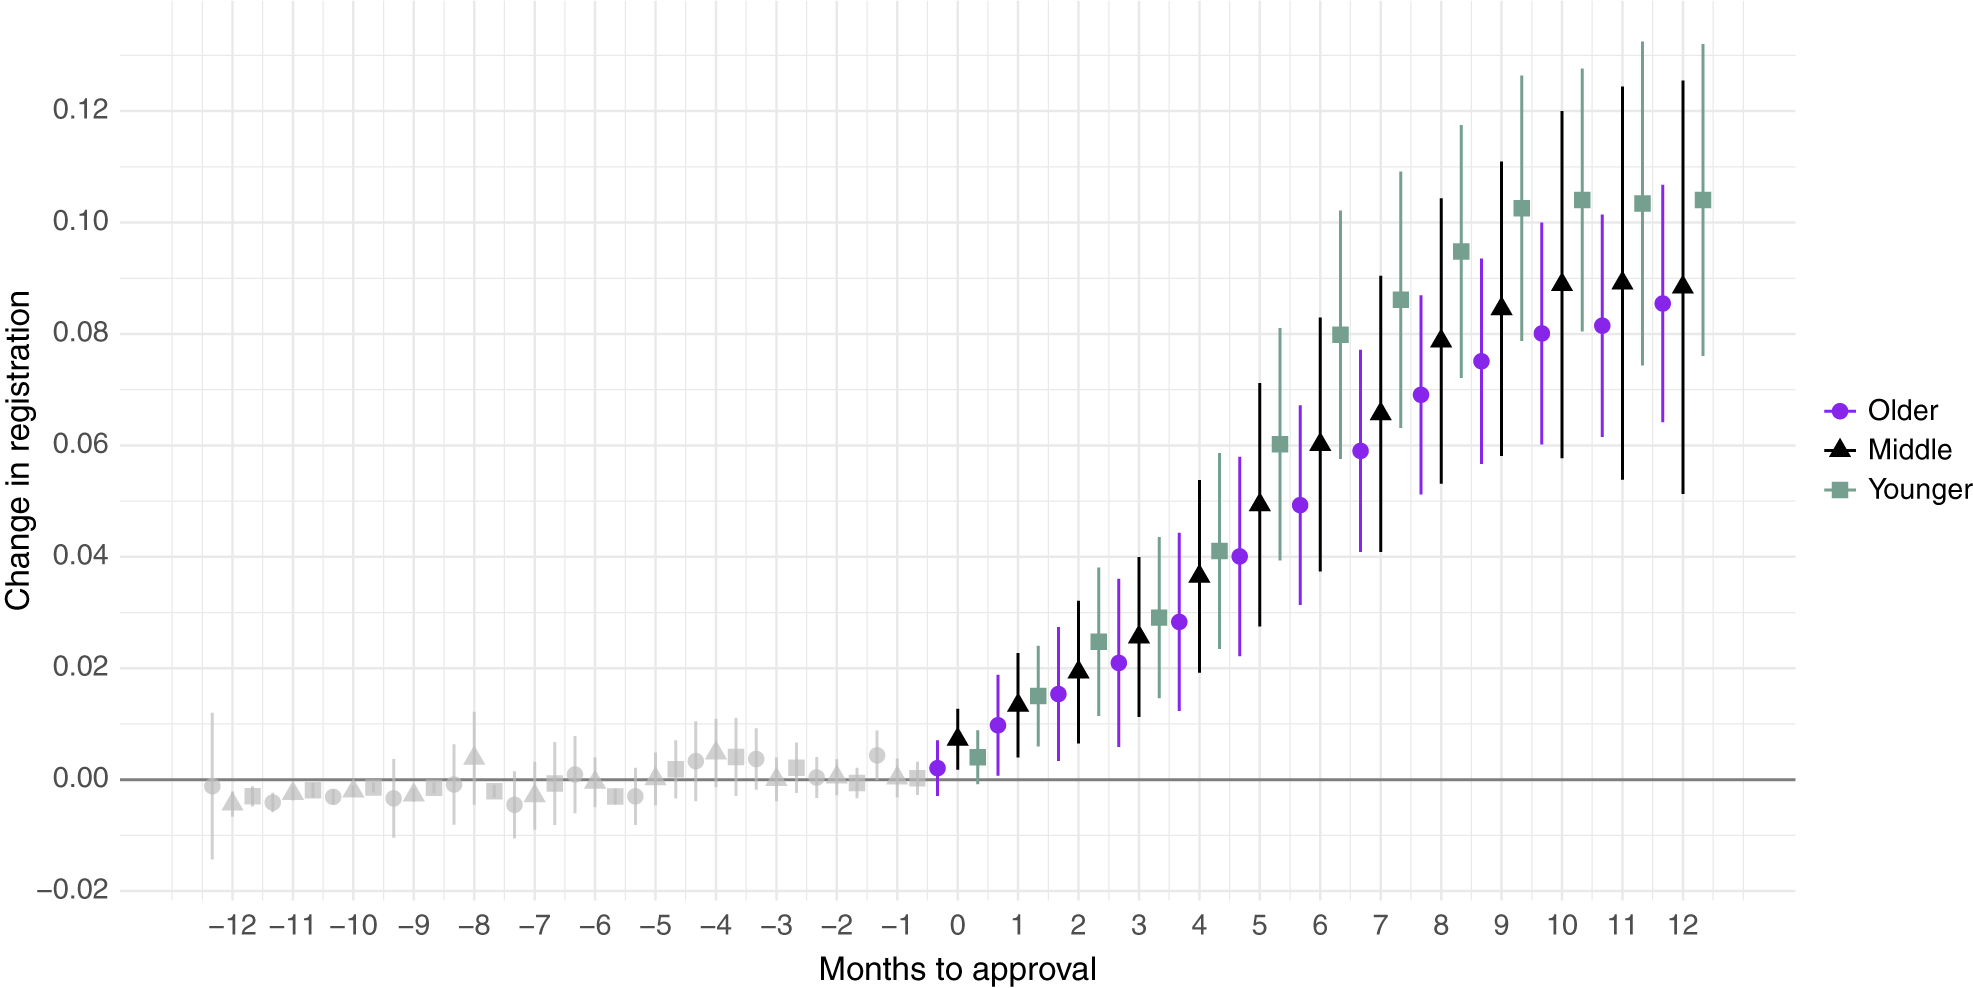

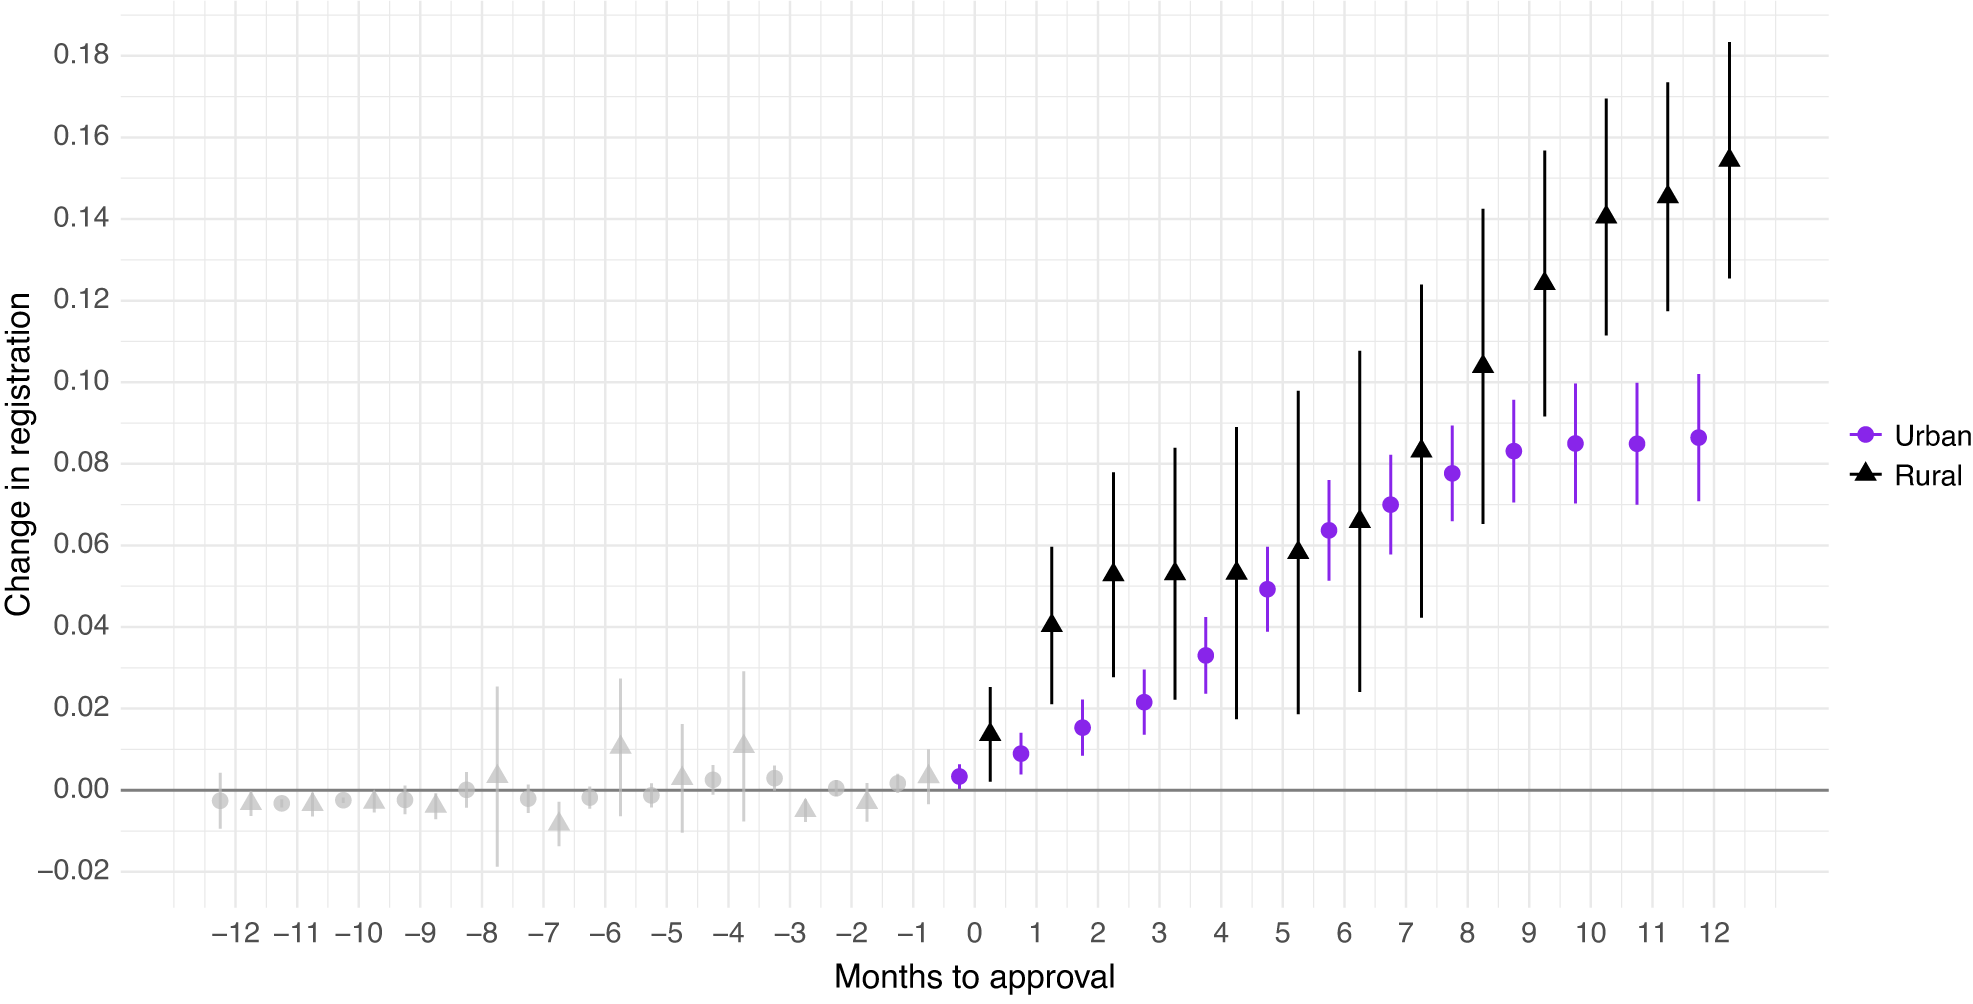

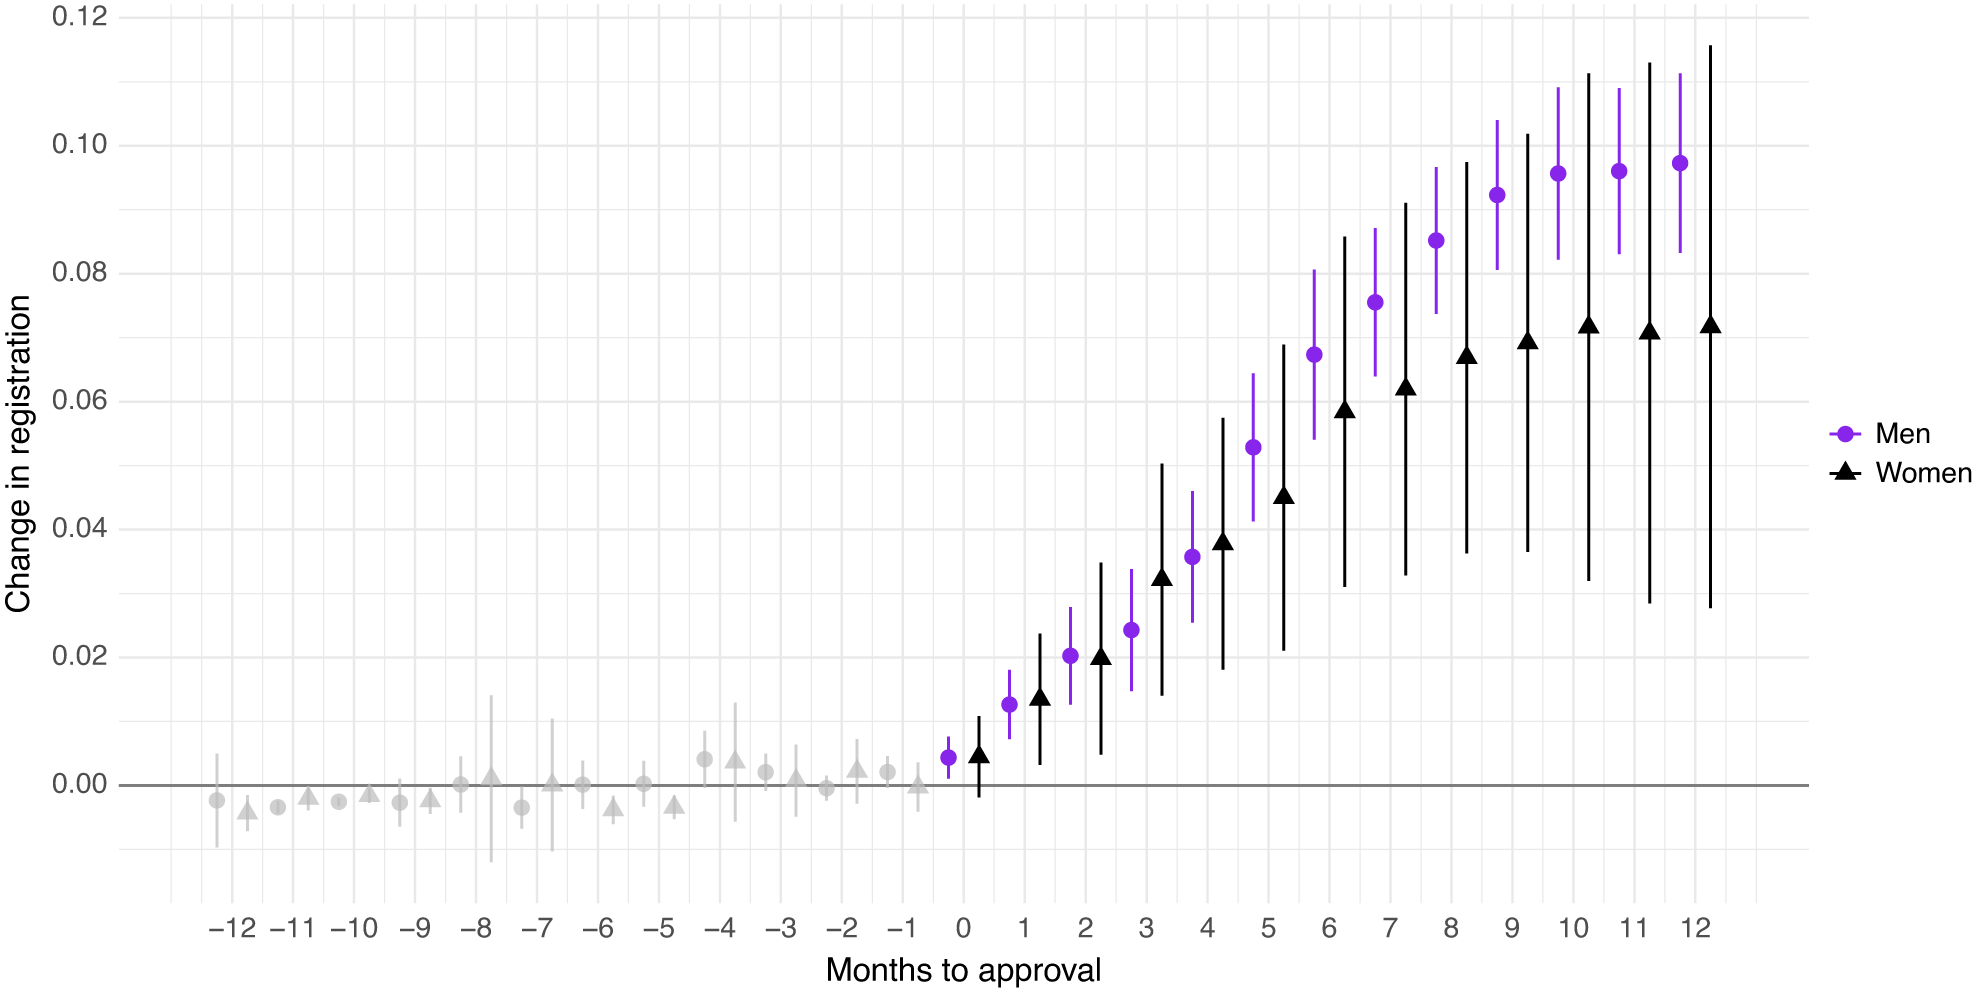

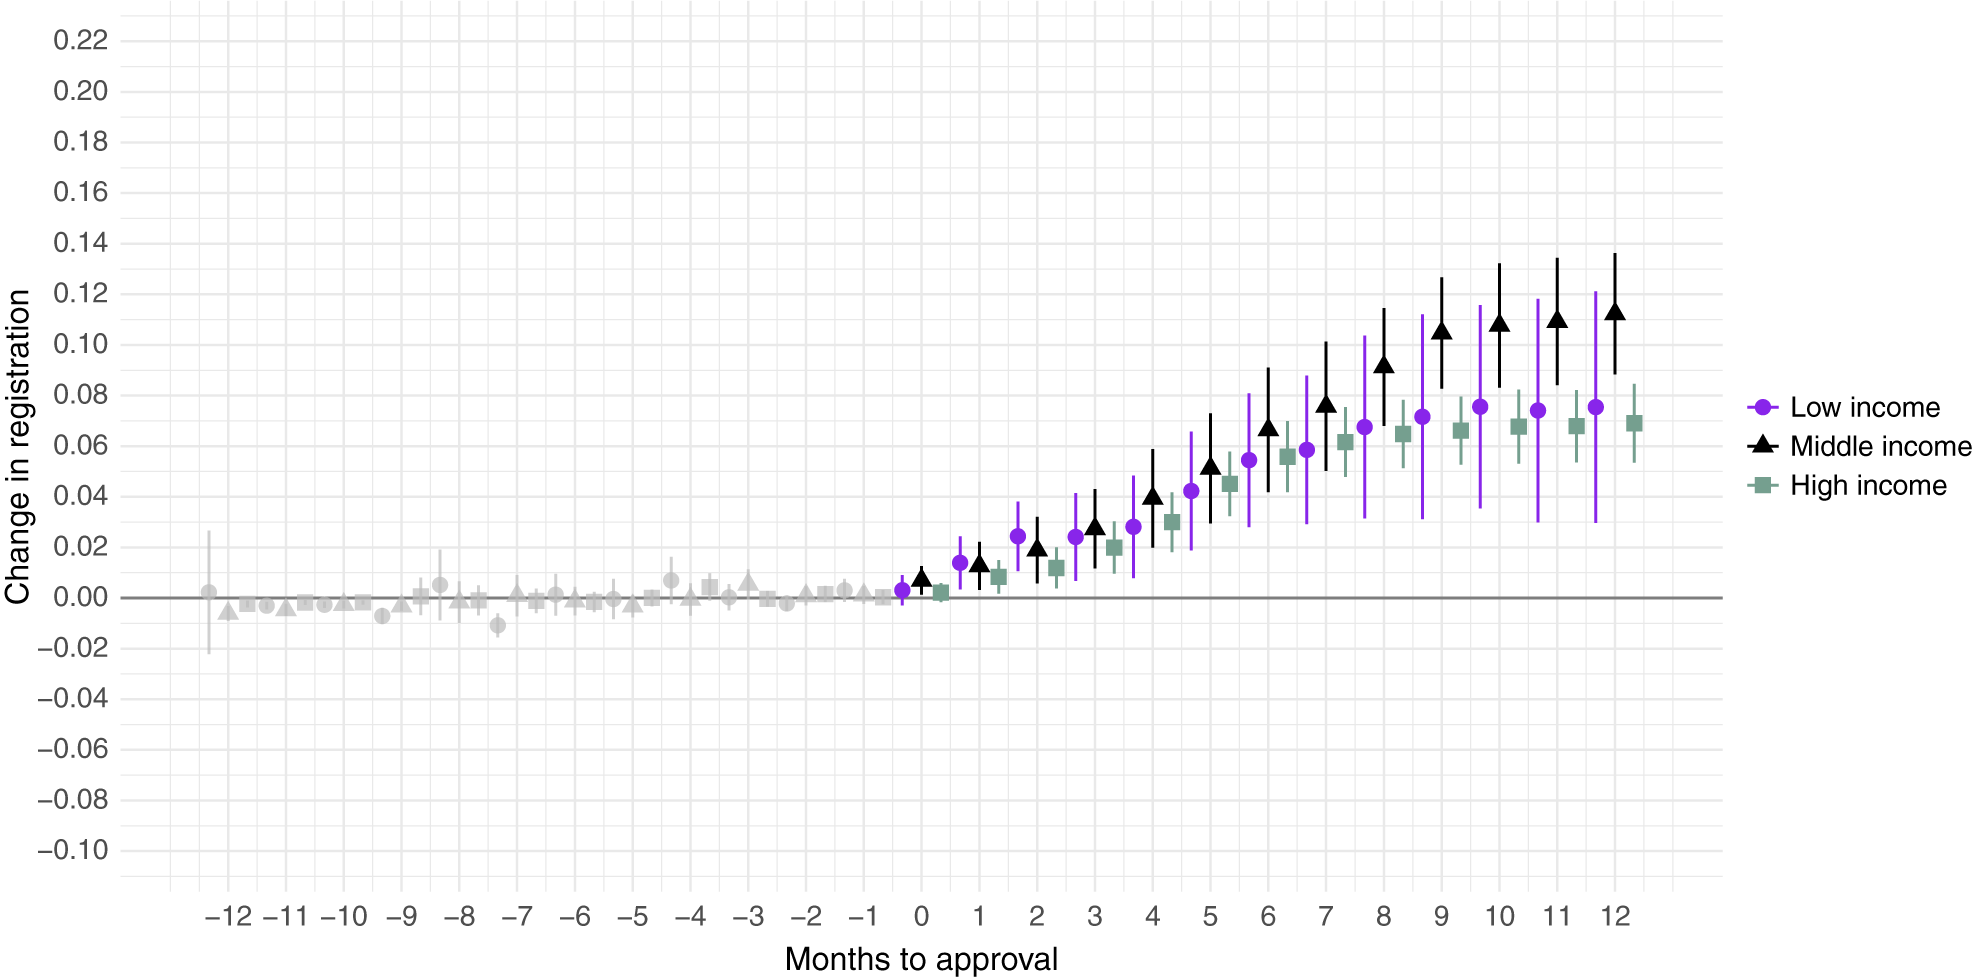

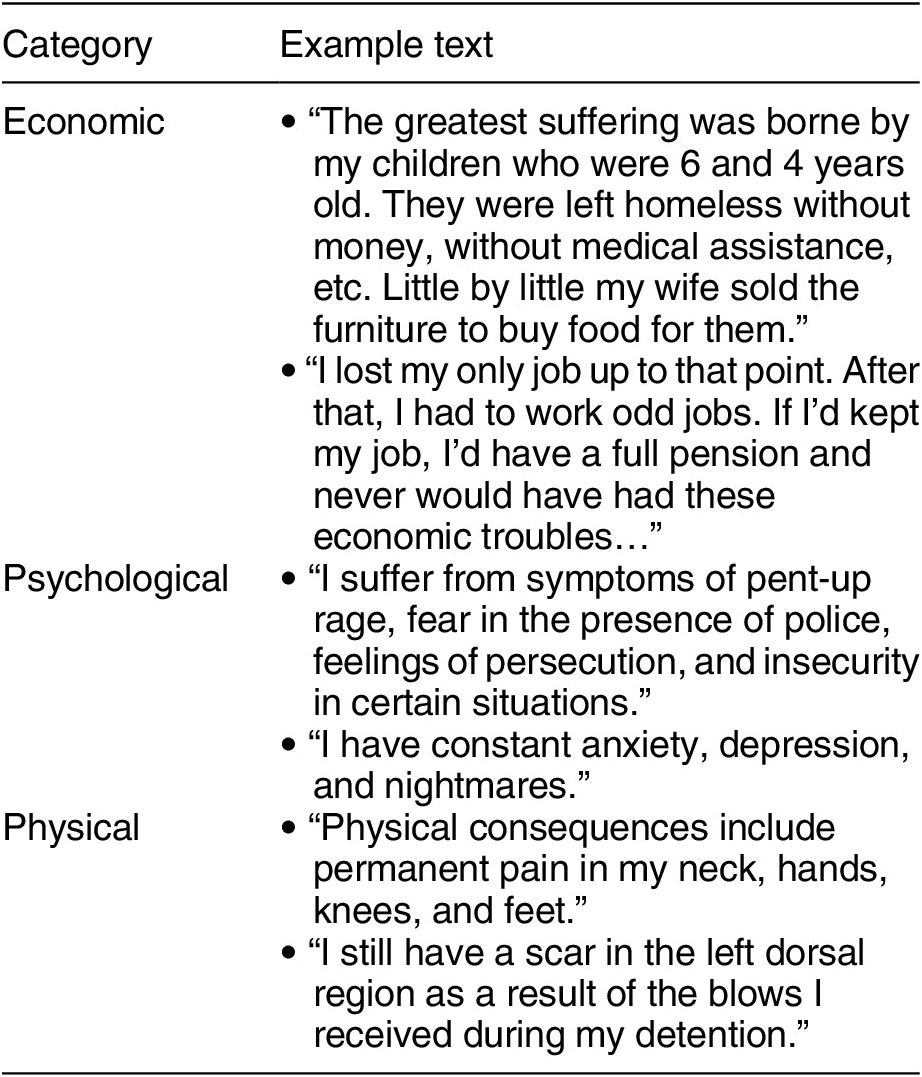
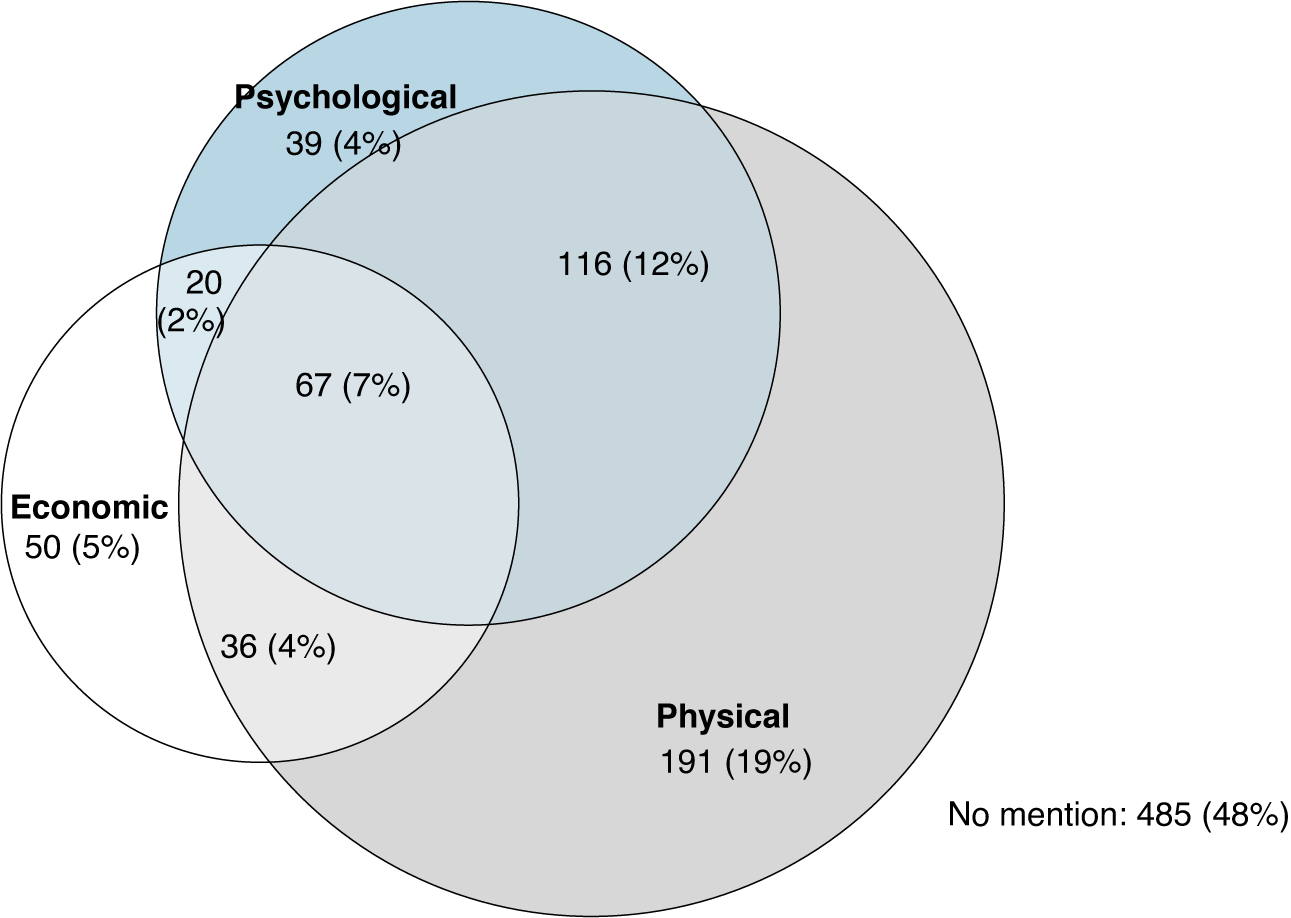
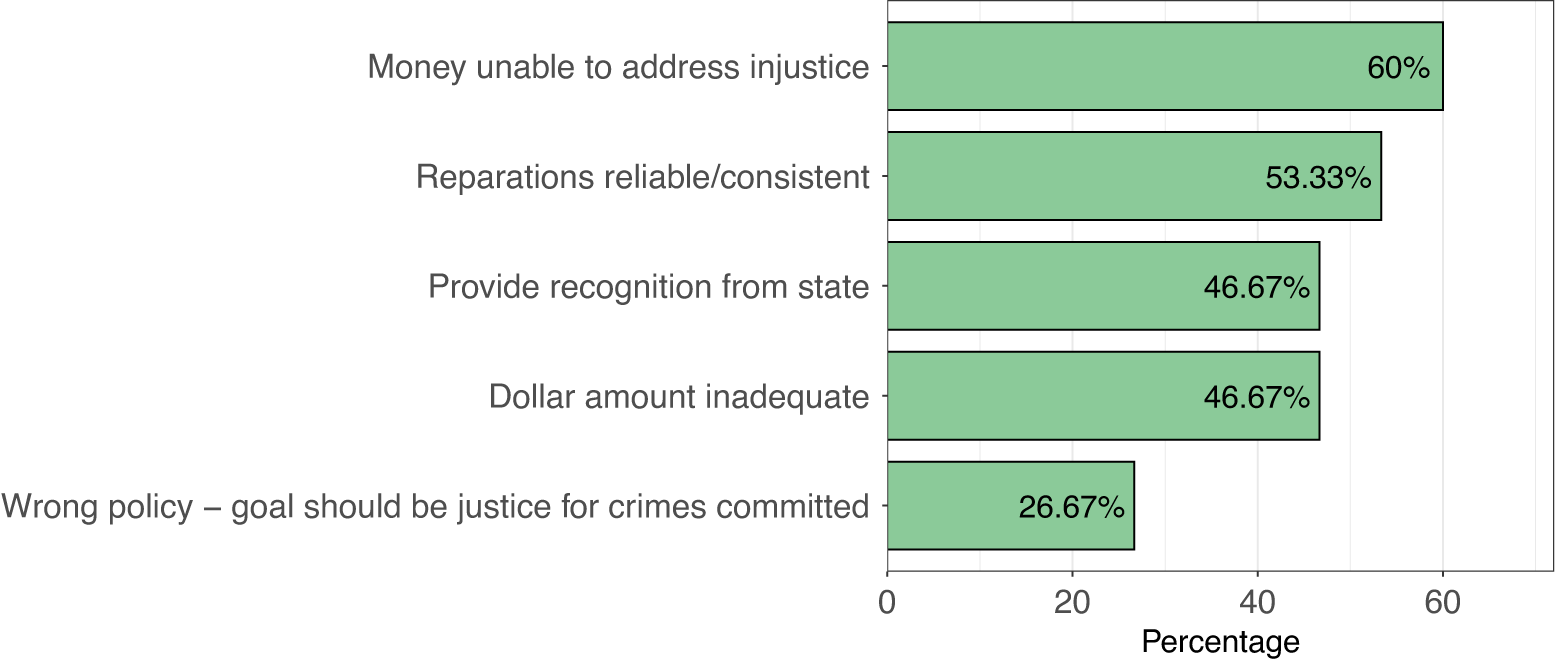




Comments
No Comments have been published for this article.