1. Introduction
The Rayleigh–Taylor instability (RTI) (Rayleigh Reference Rayleigh1883; Taylor Reference Taylor1950; Zhou Reference Zhou2017) occurs at the interface between two fluids when the density gradient is opposite to the pressure one. The classical framework commonly found in the literature is a heavy fluid of density
 $\rho _1$
placed on top of a lighter one of density
 $\rho _2$
in a downward gravity field of intensity
 $g$
. Baroclinic production of vorticity amplifies perturbations at the interface, which can be mitigated by effects of viscosity, diffusion, surface tension and density contrast (Chandrasekhar Reference Chandrasekhar1961). When the amplitudes of the perturbations are large enough, the interplay between nonlinear interactions and buoyancy produces larger and larger structures which form a mixing layer that eventually becomes fully turbulent. At asymptotically large times, this mixing zone of width
 $L$
grows self-similarly as (Youngs Reference Youngs1994)
 \begin{equation} L(t) = 2 \alpha \mathcal{A} g t^2, \end{equation}
where
 $\mathcal{A} = (\rho _1-\rho _2)/(\rho _1+\rho _2)$
is the Atwood number and
 $\alpha$
the growth rate, whose determination is of primary importance (Dimonte et al. Reference Dimonte2004). The self-similar expression (1.1) is valid within the Boussinesq approximation since it implies symmetry between the light and heavy fluids. In the following, we consider only miscible fluids with small density contrast, so that the Boussinesq approximation applies.
The self-similar state of the RTI is mainly characterized by its growth rate. As such,
 $\alpha$
has been the topic of many discussions and some controversies, with the central question of its universality. It has been reported to be dependent upon initial conditions, with notably a great scatter between experiments and numerical simulations (Dimonte et al. Reference Dimonte2004). In Thévenin et al. (Reference Thévenin, Gréa, Kluth and Nadiga2025b
), a physically informed surrogate model was built upon a database of more than 500 high-resolution direct numerical simulations (DNS) of the Navier–Stokes–Boussinesq equations with the STRATOSPEC code (Briard et al. Reference Briard, Gréa and Nguyen2024b
, Reference Briard, Gréa, Oteski, Soulard, Griffond, Thévenin and Danaila2025). One of the outcomes of this work, by measuring the sensitivity of one-point statistics upon initial conditions, is that the most probable value of the growth rate is
 $\alpha \simeq 0.020$
, in agreement with theoretical predictions (Soulard, Griffond & Gréa Reference Soulard, Griffond and Gréa2015). Moreover, Thévenin et al. (Reference Thévenin, Gréa, Kluth and Nadiga2025b
) showed with their surrogate model that effects of initial conditions are imprinted in a characteristic time that is related to transition to turbulence and the onset of the self-similar state.
Beyond the initial conditions that may transiently affect the growth rate, there are many mechanisms able to modify the RTI. Among them, periodic gravity reversals can suppress the instability (Wolf Reference Wolf1969; Boffetta, Magnani & Musacchio Reference Boffetta, Magnani and Musacchio2019), mean body rotation decreases significantly the growth rate (Baldwin, Scase & Hill Reference Baldwin, Scase and Hill2015; Boffetta, Mazzino & Musacchio Reference Boffetta, Mazzino and Musacchio2016; Scase, Baldwin & Hill Reference Scase, Baldwin and Hill2017) while autocatalytic chemical reactions increase it (Ley et al. Reference Ley, Soulard, Griffond, Briard and Simoëns2024). As for porous media, the growth of the mixing layer is not quadratic in time anymore (Boffetta, Borgnino & Musacchio Reference Boffetta, Borgnino and Musacchio2020).
When considering the magnetohydrodynamics (MHD) approximation (Biskamp Reference Biskamp2003), induced magnetic fields can also strongly modify the growth rate of the instability, the mixing properties and the overall anisotropy. To illustrate this, the classical (non-magnetic) RTI configuration is shown in figure 1(a): structures of various sizes and densities compose the turbulent mixing layer of extent
 $L$
.
Vertical slices in the
 $(x_1, x_3)$
plane of the density field, at a time where
 $L$
is roughly of the same extent, extracted from different three-dimensional (3-D) DNS of the Navier–Stokes–Boussinesq MHD equations. (a) Classical hydrodynamic RTI. (b) Horizontal MRTI, with
 $B_0$
parallel to the interface. (c) Vertical MRTI (from Briard et al. Reference Briard, Gréa and Nguyen2024b
) with
 $B_0$
parallel to the gravity. The colourbar is the same as figure 3, with blue for the light fluid
 $\rho _2$
, red for the heavy one
 $\rho _1$
and yellow in between.

When a background static and constant magnetic field
 $B_0$
is imposed, the dynamics of the magnetic Rayleigh–Taylor instability (MRTI) is profoundly modified. For the vertical MRTI, where
 $B_0$
is perpendicular to the interface, transition to turbulence is delayed, but eventually mixing properties are comparable to hydrodynamics. However, anisotropy is more pronounced: structures are thinner and more vertically stretched in figure 1(c). In this context, we derived, in previous studies, a theoretical prediction that shows that the growth rate is decreased compared with the hydrodynamic case (Briard, Gréa & Nguyen Reference Briard, Gréa and Nguyen2022, Reference Briard, Gréa and Nguyen2024b
). We also showed that in the transient potential regime, the imposed magnetic field enhances the terminal bubble/spike velocity: as a consequence, structures grow faster than in hydrodynamics and exceed the Alfvèn velocity (Gréa & Briard Reference Gréa and Briard2023).
However, for the horizontal MRTI, where
 $B_0$
is parallel to the interface, mixing between the falling and ascending structures is significantly reduced: there is less yellow colour in figure 1(b). Also, the structures are bigger, and hence they have a capability of growing faster than in hydrodynamics: this was notably observed in Stone & Gardiner (Reference Stone and Gardiner2007a
,
Reference Stone and Gardinerb
). A strengthening of the bubble/spike asymmetry was also reported in Carlyle & Hillier (Reference Carlyle and Hillier2017). The question of self-similarity of the asymptotic state was also addressed in Kalluri & Hillier (Reference Kalluri and Hillier2025). The configuration of the horizontal MRTI is the focus of the present work.
At the core of this complex phenomenology lies an intimate link between the growth rate
 $\alpha$
and the mixing, quantified by
 $\varTheta$
and defined later in (3.4). Under some assumptions that are relevant to describe the dynamics of the large scales that eventually become self-similar, Gréa (Reference Gréa2013) derived an analytical relationship between
 $\alpha$
and
 $\varTheta$
, showing that the growth rate increases when there is less mixing. This framework was extended to the vertical MRTI case in Briard et al. (Reference Briard, Gréa and Nguyen2022, Reference Briard, Gréa and Nguyen2024b
), and we wish to proceed similarly for the horizontal MRTI here.
The MRTI framework is of importance in a variety of topics, like in inertial confinement fusion (Zhou, Sadler & Hurricane Reference Zhou, Sadler and Hurricane2025), where hydrodynamic instabilities at the interface between the ablator and the fuel can be harmful in decreasing the hot-spot temperature (Remington et al. Reference Remington2019). In particular, induced magnetic fields may have significant effects on the hot-spot and transport coefficients (Fryxell et al. Reference Fryxell, Kuranz, Drake, Grosskopf, Budde, Plewa, Hearn, Hansen, Miles and Knauer2010; Walsh et al. Reference Walsh, Chittenden, McGlinchey, Niasse and Appelbe2017). The MRTI also occurs in Z-pinch experiments designed to efficiently compress matter (Sinars Reference Sinars2010, Reference Sinars2020).
The MRTI can also be found in numerous astrophysical systems, like quiescent solar prominences (Ryutova et al. Reference Ryutova, Berger, Frank, Tarbell and Title2010; Hillier Reference Hillier2018), emerging magnetic fluxes at the solar surface (Isobe et al. Reference Isobe, Miyagoshi, Shibata and Yokoyama2005), expanding young supernova remnants (Jun, Norman & Stone Reference Jun, Norman and Stone1995; Jun & Norman Reference Jun and Norman1996), with for example the Crab nebula (Porth, Komissarov & Keppens Reference Porth, Komissarov and Keppens2014) and in various star–planet interactions (Matsakos, Uribe & Königl Reference Matsakos, Uribe and Königl2015). More precisely regarding solar filaments: quiescent prominences may last for weeks in the solar corona, and consist of cool dense chromospheric plasma supported against gravity by magnetic tension. There is a general consensus that the MRTI is responsible for (i) the dynamics of the plumes, which rise from the cavity interface below the prominence and fall from the arch filament, and (ii) the amplification of magnetic fields through turbulent stretching (Keppens, Xia & Porth Reference Keppens, Xia and Porth2015; Jenkins & Keppens Reference Jenkins and Keppens2022; Popescu Braileanu, Lukin & Khomenko Reference Popescu Braileanu, Lukin and Khomenko2023).
Measurements indicate that the magnetic field is rather tangential to the solar limb (Leroy Reference Leroy1989), even though normal components cannot be ruled out (Vickers, Ballai & Erdélyi Reference Vickers, Ballai and Erdélyi2020). Still, the horizontal MRTI appears naturally as a relevant candidate to make predictions about the magnetic field intensity from the observed growth of plumes in quiescent prominences. For example, Ryutova et al. (Reference Ryutova, Berger, Frank, Tarbell and Title2010) inferred the ambient magnetic field intensity from the measure of the exponential growth rate
 $\sigma$
of plumes using the inviscid linear stability for ideal MHD (Chandrasekhar Reference Chandrasekhar1961),
 \begin{equation} \sigma = \sqrt { \mathcal{A}gk_\perp - ({\boldsymbol k_\perp } \boldsymbol{\cdot }{\boldsymbol B_0})^2 }, \end{equation}
with
 $\boldsymbol k_\perp$
the horizontal wavevector of modulus
 $k_\perp$
, and
 $B_0 = |{\boldsymbol B_0}|$
the mean magnetic field intensity scaled as the Alfvén velocity. This prediction was notably assessed in the two-dimensional (2-D) DNS of Jun et al. (Reference Jun, Norman and Stone1995), along with the related cutoff wavelength,
 \begin{equation} \lambda _c = \frac {2\pi B_0^2}{\mathcal{A}g}, \end{equation}
below which perturbations are stabilized by magnetic tension. The linear stability of different configurations was also considered in the literature, like a slab of heavy fluid (Terradas, Oliver & Ballester Reference Terradas, Oliver and Ballester2012), oblique static magnetic fields (Vickers et al. Reference Vickers, Ballai and Erdélyi2020), magnetic field parallel to the interface but normal to the perturbation (Gupta et al. Reference Gupta, Mandal, Roy and Khan2010), sheared magnetic fields (Ruderman, Terradas & Ballester Reference Ruderman, Terradas and Ballester2014; Ruderman Reference Ruderman2017) and considerations about the effects of compressibility, combination with the Kelvin–Helmholtz instability, and background smooth density profiles (Hillier Reference Hillier2020).
Whatever the complexity of the configuration, one may wonder to what extent linear stability is relevant to describe the growth of turbulent structures in astrophysical systems: indeed, for quiescent prominences, the plume’s height greatly exceeds its wavelength, indicating the dominance of nonlinearities (Sharp Reference Sharp1984).
Hence, there is a need for quantitative predictions of turbulent statistics in the MRTI, whose fate in the self-similar regime remains unclear in the case of a mean magnetic field applied parallel to the interface. In previous works (Briard et al. Reference Briard, Gréa and Nguyen2022, Reference Briard, Gréa and Nguyen2024b ), we derived an analytical relation between anisotropy, mixing, induced magnetic fields and the growth rate for the vertical MRTI. Here, we extend our approach to the horizontal MRTI, which we believe is more relevant for astrophysical systems.
A challenging difficulty in the MRTI is that when changing the orientation of
 $B_0$
, either parallel or perpendicular to the interface, the whole dynamics is profoundly modified. Hence the horizontal MRTI is completely different from the vertical MRTI. As we will see, growth is enhanced, mixing is depleted and the dynamics depends on a critical wavelength. New theoretical tools must be developed; this is the aim of this work.
The paper is organized as follows. Equations and the numerical set-up are provided in § 2. Afterwards, we analyse the effects of increasing the intensity
 $B_0$
upon the overall dynamics in § 3: therein, the phenomenology and the key mechanisms are first presented in § 3.1. Then, the time evolution of the structures is described in § 3.2. Detailed statistics regarding mixing, anisotropy and induced magnetic energy are exposed in § 3.3, along with some considerations about irreversible mixing and the energy budget in §§ 3.4 and 3.5. Horizontally averaged profiles in § 3.6 complete the analysis, and eventually differences with the phenomenology of an imposed vertical
 $B_0$
are gathered in § 3.7. The main outcomes of this work are contained in § 4, where we develop our theory to predict the mixing layer growth rate in the horizontal MRTI. Observations about the large-scale dynamics are first presented in § 4.1. As a consequence, we introduce the concept of quasi-self-similarity in § 4.2. Some background about buoyancy–drag equations and large-scale (LS) analysis is given in § 4.3. A first prediction is derived in § 4.4 and provides an upper bound for the growth rate. Then the buoyancy–drag equation for the horizontal MRTI is obtained in § 4.5 and a quantitative prediction for the growth rate follows in § 4.6. Assumptions and physical interpretations are discussed in § 4.7, before the concluding § 5. For completeness, details about the evolution equations are gathered in Appendix A, and comparisons with the vertical MRTI are grouped in Appendix B.
2. Main equations and numerical set-up
2.1. Evolution equations
In the following, we consider two fluids initially separated by a horizontal perturbed interface, with the heavier fluid on top of the lighter one in a downward gravity field
 ${\boldsymbol{g}} = - g {\boldsymbol n_3}$
, with
 $\boldsymbol n_3$
the vertical unit vector. The incompressible Navier–Stokes equations within the Boussinesq and MHD approximations read
 \begin{align} \frac {\partial {\boldsymbol{U}}}{\partial t} + ({\boldsymbol{U}} \boldsymbol{\cdot }{\boldsymbol{\boldsymbol{\nabla }}}) {\boldsymbol{U}} & = - {\boldsymbol{\boldsymbol{\nabla }}} \bigl( P + B^2/2\bigr) - 2 \mathcal{A} g C {\boldsymbol n_3} + ({\boldsymbol{B}} \boldsymbol{\cdot }{\boldsymbol{\boldsymbol{\nabla }}}) {\boldsymbol{B}} + \nu {\nabla} ^2 {\boldsymbol{U}}, \end{align}
 \begin{align} \frac {\partial {\boldsymbol{B}}}{\partial t} + ({\boldsymbol{U}} \boldsymbol{\cdot }{\boldsymbol{\boldsymbol{\nabla }}}) {\boldsymbol{B}} & = ({\boldsymbol{B}} \boldsymbol{\cdot }{\boldsymbol{\boldsymbol{\nabla }}}) {\boldsymbol{U}} + \eta {\nabla} ^2 {\boldsymbol{B}}, \end{align}
 \begin{align} \frac {\partial C}{\partial t} + ({\boldsymbol{U}} \boldsymbol{\cdot }{\boldsymbol{\boldsymbol{\nabla }}}) C & = \kappa {\nabla} ^2 C, \end{align}
 \begin{align} {\boldsymbol{\boldsymbol{\nabla }}} \boldsymbol{\cdot }{\boldsymbol{U}} & = 0, \end{align}
 \begin{align} {\boldsymbol{\boldsymbol{\nabla }}} \boldsymbol{\cdot }{\boldsymbol{B}} & = 0, \end{align}
where
 $\boldsymbol{U}$
is the total velocity field,
 $\boldsymbol{B}$
the magnetic field scaled as a velocity (
 ${\boldsymbol{B}} = {\boldsymbol H}/\sqrt {\rho _0 \mu _0}$
, where
 $\boldsymbol H$
is the true magnetic field,
 $\mu _0$
the vacuum magnetic permeability and
 $\rho _0=(\rho _1 + \rho _2)/2$
the reference density) and
 $C$
the concentration of the heavy fluid. Here
 $P$
is the reduced pressure,
 $\nu$
,
 $\eta$
and
 $\kappa$
are the kinematic viscosity, magnetic diffusivity and molecular diffusivity respectively. The Lorentz force
 $({\boldsymbol{\boldsymbol{\nabla }}} \times {\boldsymbol{B}} ) \times {\boldsymbol{B}} = - {\boldsymbol{\boldsymbol{\nabla }}} (B^2/2) + ({\boldsymbol{B}} \boldsymbol{\cdot }{\boldsymbol{\boldsymbol{\nabla }}}) {\boldsymbol{B}}$
has been expressed as the sum of magnetic pressure and magnetic tension.
We further consider an imposed magnetic field
 $B_0$
in the horizontal direction
 $x_1$
, so that the total magnetic field can be written
 ${\boldsymbol{B}} = B_0 {\boldsymbol n_1} + {\boldsymbol{b}}$
. The imposed
 $B_0$
, which can be interpreted as the mean Alfvén velocity, is constant in space and time. Whereas
 $\boldsymbol{b}$
is the varying induced magnetic field.
Due to the imposed mean magnetic field, statistical axisymmetry of the horizontal MRTI is lost. Nevertheless, statistics in horizontal planes remain homogeneous so that we can decompose any field
 $A$
into its horizontal average
 $\langle A \rangle$
and its fluctuating part
 $a=A- \langle A \rangle$
. The volume average is denoted by
 $\overline {\star }$
and is obtained by an additional weighted integration over the vertical direction,
 \begin{equation} \overline {\star } = \frac {1}{L} \int \langle \star \rangle (x_3) \mathrm{d}x_3, \end{equation}
where the mixing zone length is defined as (Andrews & Spalding Reference Andrews and Spalding1990)
 \begin{equation} L(t) = 6 \int \langle C \rangle \left ( 1 - \langle C \rangle \right ) \mathrm{d}x_3. \end{equation}
Since fluctuations decrease quickly outside the mixing layer, integration along the whole vertical direction amounts to averaging upon the mixing zone width for second-order correlations.
Finally, it is worth stressing from here that the mean induced magnetic field is zero on average, namely
 $\int \langle {\boldsymbol{B}} \rangle \mathrm{d}x_3 =0$
, so that the induced magnetic energy is only due to turbulent fluctuations.
2.2. Numerical set-up
We have performed DNS of the incompressible Navier–Stokes (2.1a
)–(2.1e
) under the Boussinesq and MHD approximations, with the pseudospectral code STRATOSPEC (Briard et al. Reference Briard, Gréa and Nguyen2024b
, Reference Briard, Gréa, Oteski, Soulard, Griffond, Thévenin and Danaila2025). The domain is a triply periodic vertically elongated box of dimensions (
 $L_1$
,
 $L_2$
,
 $L_3$
) with
 $L_1 = L_2 = 2 \pi$
and
 $L_3= 4\pi$
.
The present simulations have resolution of either
 $1024^2 \times 2048$
(R1) or
 $2048^2 \times 4096$
points (R2), and are performed with a MPI pencil decomposition using 4096–16 384 cores. A classical spectral Fourier collocation method is used with two-third rule dealiasing. The P3DFFT algorithm was implemented to perform massively parallel fast Fourier transforms (Pekurovsky Reference Pekurovsky2012). The time increment is determined using a third-order low-storage strong-stability-preserving Runge–Kutta scheme, with implicit treatment of diffusive terms. Some of the R2 simulations were repeated twice to evaluate the effect of the initial seed on the self-similar regime.
The initial velocity and fluctuating magnetic fields are zero, namely
 ${\boldsymbol{U}} = {\boldsymbol{b}} = {\boldsymbol 0}$
. The perturbation of the interface between the heavy and light fluids is driven by a 3-D concentration variance spectrum, with infrared slope
 $k^4$
, whose peak wavenumber
 $k_p$
and initial variance
 $\overline {c^2}(t=0)$
are given in table 1, along with all relevant parameters: further details can be found in Appendix B.1 of Briard et al. (Reference Briard, Gréa and Nguyen2024b
). The simulations are stopped when the mixing layer width reaches
 $55\,\%$
of the domain height. Finally, in the DNS labels, ‘R1’ and ‘R2’ refer to the numerical resolution, ‘B’ to the mean magnetic field intensity
 $B_0$
and ‘AG’ to the buoyancy strength
 $\mathcal{A}g$
.
Parameters of the DNS: number of points
 $N_1 \times N_2 \times N_3$
; buoyancy strength with Atwood number times acceleration
 $\mathcal{A}g$
; mean horizontal magnetic field intensity
 $B_0$
(scaled as a Alfvén velocity); kinematic viscosity
 $\nu = \kappa = \eta$
; peak wavenumber
 $k_p$
of the initial 3-D concentration spectrum (all runs have initially
 $\overline {c^2} (t=0) = 0.022$
); initial perturbation Reynolds number
 $\mathcal{R}_0=\sqrt {\mathcal{A}g k_0}/\nu k_0^2$
, with
 $k_0 \leqslant k_p$
the peak wavenumber of the 2-D perturbation spectrum.

3. Dynamics of the MRTI
In this part, we first present the phenomenology of the horizontal MRTI with theoretical arguments in § 3.1. The overall dynamics is then qualitatively exposed with plots of the 3-D scalar field in § 3.2. Afterwards, the effects of increasing
 $B_0$
upon volume-averaged statistics are presented in § 3.3, such as the mixing layer width, mixing and anisotropy parameters, along with measures of the induced turbulence intensities. Additional results regarding irreversible mixing and the energy budget are gathered in §§ 3.4 and 3.5. Also, some horizontally averaged profiles are shown for informative purposes in § 3.6. Finally, qualitative comparisons with the case of an imposed vertical mean magnetic field are gathered in § 3.7 and Appendix B. The subsequent § 4 focuses on the asymptotic regime of the horizontal MRTI.
3.1. Phenomenology
For a uniform magnetic field
 $B_0$
parallel to the interface in the
 $x_1$
direction, the linear stability analysis (Chandrasekhar Reference Chandrasekhar1961) gives that all wavelengths smaller than the critical value
 $\lambda _c$
, given in (1.3), are stabilized. This was verified numerically in Jun et al. (Reference Jun, Norman and Stone1995) in a 2-D DNS set-up, with the most unstable mode having the wavelength
 $2\lambda _c$
.
But in three dimensions, modes whose wavevector
 $\boldsymbol k$
is not aligned with
 $B_0$
may be unstable. In particular, modes along
 $\boldsymbol n_2$
are destabilized like in the hydrodynamic case. Hence, as mentioned earlier, from the onset of the instability, statistical axisymmetry of the system is broken: structures will have a larger wavelength in the direction
 $x_1$
compared with
 $x_2$
.
Let us now consider that perturbations have sufficiently grown to form a turbulent mixing zone. We assume that the typical scales of the inner turbulent fluctuations are much smaller than the mixing layer width
 $L$
, so that statistics can be assumed homogeneous in the three directions. In the non-magnetic case, this framework is known as unstably stratified homogeneous turbulence (Griffond, Gréa & Soulard Reference Griffond, Gréa and Soulard2014; Soulard, Griffond & Gréa Reference Soulard, Griffond and Gréa2014; Burlot et al. Reference Burlot, Gréa, Godeferd, Cambon and Griffond2015; Griffond, Gréa & Soulard Reference Griffond, Gréa and Soulard2015; Gréa et al. Reference Gréa, Burlot, Godeferd, Griffond, Soulard and Cambon2016; Briard, Iyer & Gomez Reference Briard, Iyer and Gomez2017).
In the subsequent developments, we switch to the spectral formalism, which is at the heart of the theoretical tools presented later on to characterize the self-similar state of the MRTI. Focusing on large scales, diffusion terms can be consistently neglected. Furthermore, we also discard nonlinearities, arguing that buoyancy effects are dominant at large scales. In other words, only interactions with the mean flow are kept, which is reminiscent of the rapid distorsion theory (Hunt & Carruthers Reference Hunt and Carruthers1990). The resulting equations in spectral space are
 \begin{align} \frac {\partial }{\partial t} \hat {u}_3(\boldsymbol k,t) & = - 2 \mathcal{A}g \hat {c}(\boldsymbol k,t) P_{33}(\boldsymbol k) + \mathrm{i} k_1 B_0 \hat {b}_3(\boldsymbol k,t), \end{align}
 \begin{align} \frac {\partial }{\partial t} \hat {b}_3(\boldsymbol k,t) & = \mathrm{i} k_1 B_0 \hat {u}_3(\boldsymbol k,t), \end{align}
 \begin{align} \frac {\partial }{\partial t} \hat {c}(\boldsymbol k,t) & = - \frac {1}{L} \hat {u}_3(\boldsymbol k,t), \end{align}
where
 $\hat {\star }$
represents the Fourier transform, and
 $P_{\textit{ij}}=\delta _{\textit{ij}}-k_i k_{\!j}/k^2$
the projector onto the plane perpendicular to the wavevector
 $\boldsymbol k$
. Combining the previous equations readily gives
 \begin{equation} \frac {\partial ^2 {\hat {u}}_3}{\partial t^2} + {\hat {u}}_3 \big(k^2 B_0^2 \cos ^2 \phi - N^2 \big) \sin ^2 \theta = 0, \end{equation}
where
 $\theta$
is the angle between
 $\boldsymbol k$
and the vertical
 ${\boldsymbol n}_3$
,
 $\phi$
the angle between
 $\boldsymbol n_1$
and
 $\boldsymbol k_\perp$
, with
 $\boldsymbol k_\perp$
the projection of
 $\boldsymbol k$
onto the plane (
 $x_1$
,
 $x_2$
) and
 $N=\sqrt {2 \mathcal{A}g/L}$
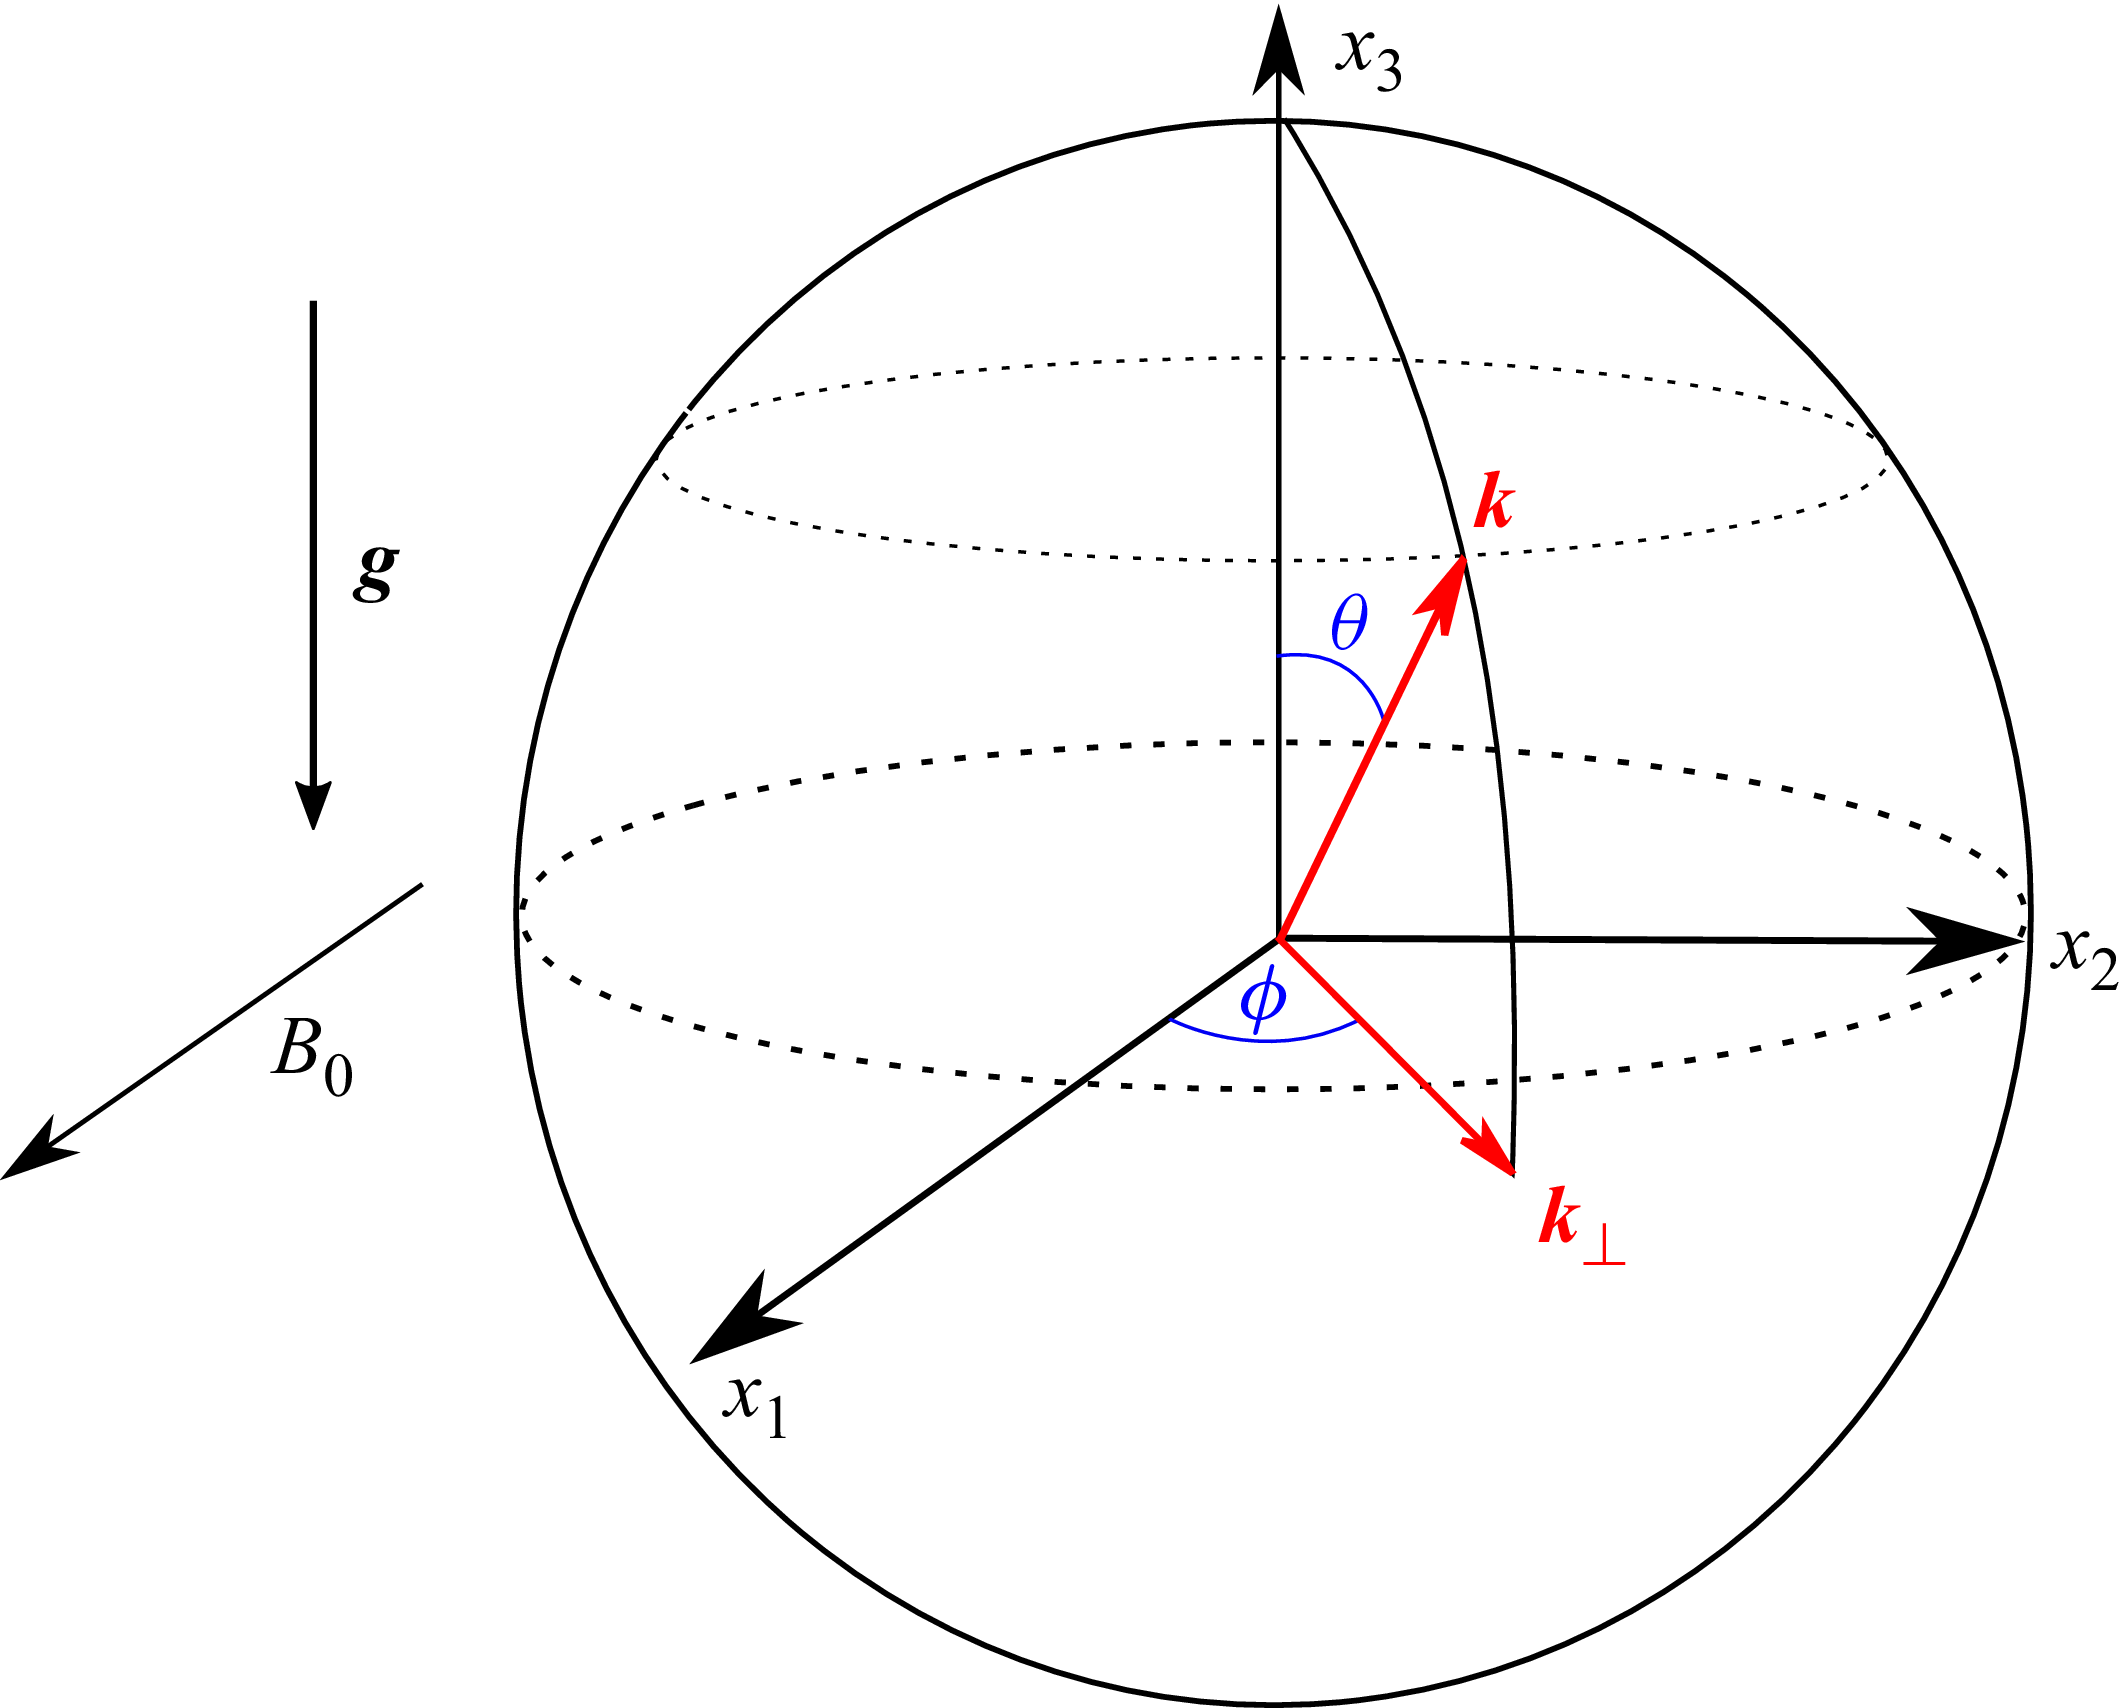
the buoyancy frequency. The configuration is sketched in figure 2 for clarity.
Sketch of the configuration with the angles
 $\theta$
and
 $\phi$
.

This equation contains much information which we disentangle. First, in the absence of a magnetic field, the modes with wavevector
 $\boldsymbol k$
pertaining to the equatorial plane (
 $\theta =\pi /2$
) are the most amplified (Soulard et al. Reference Soulard, Griffond and Gréa2014). This is also true in the presence of
 $B_0$
: in the following we consider the most amplified modes (
 $\theta =\pi /2$
).
-
(i) Modes parallel to
 $B_0$
with
$\phi =0$
(the so-called undular modes in the astrophysical community) in the plane (
$x_1$
,
$x_3$
) experience a complex scale-dependent damping. A critical wavenumber naturally appears,(3.3)Perturbations with wavelengths larger than
\begin{equation} k_B = \frac {N}{B_0} = \frac {\sqrt {2\mathcal{A}g}}{\sqrt {L}B_0}. \end{equation}
$1/k_B$
will grow in amplitude but still experience magnetic tension. Whereas MHD effects will dominate over buoyancy ones for scales smaller than
$1/k_B$
. Note that in the single-mode 2-D horizontal MRTI (
$\theta =\pi /2$
and
$\phi =0$
), a sustained oscillating regime of the interface emerges and may yield a levitating slab of heavy fluid (Briard et al. Reference Briard, Gréa and Nguyen2024a
).
-
(ii) Modes perpendicular to
$B_0$
, namely in the plane (
$x_2$
,
$x_3$
) with
$\phi =\pi /2$
, are not affected by the magnetic field and grow like in the hydrodynamic case: buoyancy dominates at all scales.


The previous analysis reveals the importance of the critical wavenumber
 $k_B$
in the horizontal MRTI. On average, the large scales for which
 $k\lt k_B$
are dominated by buoyancy with the characteristic frequency
 $N$
, whereas the smaller scales for which
 $k\gt k_B$
are dominated by MHD, with the characteristic frequency
 $kB_0$
. The remaining question is whether the energy-containing scales are larger than
 $1/k_B$
or not. This will have significant consequences on the self-similar regime of the horizontal MRTI, and is discussed in § 4.
3.2. Overview of the dynamics
We believe that visualizing the 3-D flow is informative to get some intuition about the effect of an horizontal mean magnetic field on the development of the RTI. The reference hydrodynamic case is shown in figure 3 along with a simulation with
 $B_0=0.3$
. Both movies are available as Supplemental Material.
Concentration field
 $C$
from the simulations R2B00AG05 (
 $B_0=0$
) and R2B03AG05 (
 $B_0=0.3$
) at four different instants: (a)
 $t=0$
; (b)
 $t=2$
; (c)
 $t=6$
; (d)
 $t=12$
. The colourmap is chosen so that the pure fluids (
 $C=0$
and
 $C=1$
) are transparent, with a sharp colour gradient around
 $C=1/2$
.

From the same initial conditions, the differences can be seen from
 $t=2$
, time which roughly corresponds to the onset of small-scale shear instabilities for both cases. For
 $B_0=0$
, the growing bubbles are rather spherical and uniformly distributed in the horizontal plane: statistical axisymmetry is verified. Whereas for
 $B_0=0.3$
, the structures are stretched in the
 $x_1$
direction of the imposed mean magnetic field: the anisotropy is clear and the flow is no longer axisymmetric. Conversely, wavelengths are much larger in the
 $x_1$
direction compared with
 $x_2$
, because the smallest wavelengths are damped by magnetic tension.
Later at
 $t=6$
, the flow is fully turbulent. Structures are, in average, larger for
 $B_0=0.3$
and more ‘bubbly’, still stretched in the horizontal
 $x_1$
direction. A similar topology was also observed in Stone & Gardiner (Reference Stone and Gardiner2007b
).
At a much later time
 $t=12$
, the flows are completely different. While for
 $B_0 = 0$
a variety of scales are observed, mainly big bubbles drive the mixing layer growth for
 $B_0 = 0.3$
. There is also much less mixing in the magnetic case (mainly dark blue and red colours) than the hydrodynamic case (yellow and light blue). An interesting feature is that structures are less stretched in the
 $x_1$
direction: turbulence has partially restored statistical axisymmetry. This is expected since large structures are much less sensitive to the magnetic tension cutoff.
All these observations are better quantified in the next section using appropriate volume-averaged quantities.
3.3. Mixing layer growth, anisotropy and mixing
Here we focus on the effects of increasing the horizontal magnetic field strength
 $B_0$
upon the anisotropy and mixing properties of the MRTI.
We start with the mixing layer width
 $L$
, defined in (2.3), whose time evolution is displayed in figure 4(a) for various mean magnetic field intensities. Large values of
 $B_0$
initially delay the growth of
 $L$
: this is because small wavelengths, which grow the fastest, are damped in the field direction. Whereas later on, magnetic cases achieve higher values of
 $L$
: this is consistent with the larger structures observed in figure 3 that mix less.
Effect of increasing the horizontal mean magnetic field intensity
 $B_0$
, in the R2 simulations, upon the mixing layer growth. (a) Mixing layer width
 $L$
, defined in (2.3), normalized by the vertical height
 $L_3$
. (b) Growth rate
 $\alpha$
of
 $L$
.

Interestingly, the mixing layer width still follows the usual self-similar scaling at large times given in (1.1) (Youngs Reference Youngs1994). This appears more clearly in figure 4(b) where the growth rates, computed according to
 $\alpha =\dot {L}^2/(8\mathcal{A}gL)$
, become constant at large times. The most important feature here is that, for the strongest values of the imposed horizontal mean field
 $B_0$
,
 $\alpha$
reaches values twice as large as the hydrodynamic case: this is consistent with previous observations (Stone & Gardiner Reference Stone and Gardiner2007a
,
Reference Stone and Gardinerb
). The self-similar regime will be discussed at length in § 4.
The mixing parameter, defined as
 \begin{equation} \varTheta = \frac {\int \langle C (1-C) \rangle \mathrm{d}x_3}{\int \langle C \rangle \langle (1-C) \rangle \mathrm{d}x_3} = 1- 6 \, \overline {c^2}, \end{equation}
tends towards unity for perfectly mixed fluids, and on the contrary towards zero for segregated ones. Typical asymptotic values in the hydrodynamic case are
 $\varTheta \simeq 0.8$
(Gréa Reference Gréa2013; Morgan & Black Reference Morgan and Black2020; Thévenin et al. Reference Thévenin, Gréa, Kluth and Nadiga2025a
,
Reference Thévenin, Gréa, Kluth and Briardb
). The time evolution of
 $\varTheta$
displayed in figure 5(a) for the hydrodynamic case is usual: from its initial value,
 $\varTheta$
decreases as structures grow without mixing. Afterwards, when small-scale shear instabilities come into play,
 $\varTheta$
increases driven by turbulent mixing. It eventually becomes constant in the self-similar regime.


Regarding the magnetic cases, several features should be pointed out in figure 5(a). The first one is that increasing
 $B_0$
strongly decreases
 $\varTheta$
: indeed, magnetic tension inhibits the development of small wavelengths which greatly participate to mixing through small-scale shear instabilities. This is consistent with the increase of
 $\alpha$
: less mixing increases the growth rate of the mixing layer (Gréa Reference Gréa2013; Soulard, Griffond & Gréa Reference Soulard, Griffond and Gréa2016). Incidentally, with reduced mixing, structures are also bigger, as seen in figure 3.
The second observation is that, for simulations with
 $B_0 \leqslant 0.2$
,
 $\varTheta$
is constant at large times, which indicates that an asymptotic state has been reached. Whereas for
 $B_0 \simeq 0.3$
, the mixing parameter slightly decreases: this means that despite being in the turbulent regime, the strongest
 $B_0$
case is not yet fully in its asymptotic state. Unfortunately, this would require to run the corresponding DNS for a larger time: but
 $L$
is already almost
 $60 \,\%$
of the domain height, and thus structures may be confined, both vertically and laterally.
The third feature to report is transition to turbulence, evidenced by the increase of
 $\varTheta$
. Indeed,
 $\varTheta$
is a good measure of irreversible mixing in the RTI, which occurs notably at the onset of small-scale shear instabilities. This mixing, induced by the shearing motion of ascending and falling structures, reduces the concentration variance and thus increases
 $\varTheta$
. Here, transition to turbulence happens between
 $t=2$
and
 $t=3$
: it is not delayed by the imposed horizontal
 $B_0$
, unlike the vertical MRTI (see Briard et al. (Reference Briard, Gréa and Nguyen2024b
) or Appendix B for more details). The fact that transition to turbulence is not significantly delayed in the horizontal MRTI, at least for the
 $B_0$
values considered here, is because there is no cutoff wavelength in the direction normal to the imposed magnetic field.
Moving on with global anisotropy indicators, conclusions are quite similar. Starting with the directional anisotropy of the concentration field in figure 5(b), the dimensionality parameter is defined as
 \begin{equation} \sin ^2 \gamma = \frac {\iiint \mathcal{E}_{\textit{cc}}(\boldsymbol k) \sin ^2 \theta \mathrm{d}^3 \boldsymbol k}{\iiint \mathcal{E}_{\textit{cc}}(\boldsymbol k) \mathrm{d}^3 \boldsymbol k}, \end{equation}
where
 $\mathcal{E}_{\textit{cc}}$
is the spectral concentration variance such that
 $\iiint \mathcal{E}_{\textit{cc}} \mathrm{d}^3 \boldsymbol k = L\overline {c^2}$
. This parameter takes the value 2/3 for an isotropic field, is such that
 $2/3 \leqslant \sin ^2 \gamma \leqslant 1$
for vertically stretched structures and such that
 $0 \leqslant \sin ^2 \gamma \leqslant 2/3$
for flatter ones.
In figure 5(b), the increasing values of
 $\sin ^2 \gamma$
at large times for
 $B_0 \geqslant 0.2$
show that the flows are not yet in their asymptotic state for the largest values of the imposed horizontal mean magnetic field. This increase of scalar anisotropy is also due to the fact that statistical axisymmetry is not yet fully restored, as shown hereafter. Also, the early decrease of
 $\sin ^2\gamma$
below
 $2/3$
for
 $B_0 \geqslant 0.2$
corresponds to the moderately flat structures stretched in the magnetic field direction. For
 $B_0 \leqslant 0.1$
, the final values of the dimensionality parameter are slightly larger than in the hydrodynamic case and steady.
Furthermore, statistical axisymmetry may be investigated by analysing the ratios of the horizontal components of the kinetic and magnetic energies, namely
 $\overline {u_1^2}/\overline {u_2^2}$
and
 $\overline {b_1^2}/\overline {b_2^2}$
, respectively. It is clear in figures 6(a) and 6(b) that for large values of
 $B_0$
, these ratios are further away from unity, indicating a greater departure from axisymmetry. These ratios are also still evolving for
 $B_0 \geqslant 0.2$
, providing an additional proof that the flows only approach the asymptotic state. Nevertheless, after transition to turbulence (roughly for
 $2 \leqslant t \leqslant 3$
for all cases), axisymmetry tends to be restored. This is consistent with the observations made in figure 3 regarding the horizontal stretching of the structures between
 $t=6$
and
 $t=12$
for
 $B_0=0.3$
. For the largest values of
 $B_0$
, the energy ratios strongly decrease initially, indicating that the turbulent dynamics mainly occurs in the direction
 $\boldsymbol n_2$
normal to the imposed mean magnetic field.
Effect of increasing
 $B_0$
, in the R2 simulations, upon statistical axisymmetry and anisotropy. (a) Horizontal kinetic energy anisotropy
 $\overline {u_1^2}/\overline {u_2^2}$
. (b) Horizontal magnetic energy anisotropy
 $\overline {b_1^2}/\overline {b_2^2}$
. (c) Transverse to vertical kinetic energy ratio
 $\overline {u_2^2}/\overline {u_3^2}$
. (d) Transverse to vertical magnetic energy ratio
 $\overline {b_2^2}/\overline {b_3^2}$
.

To complete the picture of global anisotropy, the ratio of the most intense horizontal component over the vertical one is shown for kinetic and magnetic energies in figures 6(c) and 6(d), respectively. Unambiguously, the vertical energies bear most of the turbulence intensity, which is a property shared by the classical RTI as well.
We use the turbulent Reynolds number, defined as
 \begin{equation} {\textrm{Re}}_T = \frac {\mathcal{K}_{\textit{uu}}^2}{\nu \varepsilon _{\textit{uu}}}, \quad \quad {\textrm{Re}}_\lambda = \sqrt {\frac {20}{3} {\textrm{Re}}_T}, \end{equation}
with
 $\mathcal{K}_{\textit{uu}} = \overline {u_i u_i}/2$
the kinetic energy and
 $\varepsilon _{\textit{uu}} = \nu \overline {\partial _{\!j} u_i \partial _{\!j} u_i}$
its dissipation rate. The final values in figure 7(a), corresponding to the time where
 $L$
is roughly
 $55 \,\%$
of the domain height, are close to
 ${\textrm{Re}}_T \simeq 7000$
, corresponding to
 ${\textrm{Re}}_\lambda \simeq 200$
. The log scale allows to better see the transition to turbulence around
 $t=2$
.
Effect of increasing
 $B_0$
, in the R2 simulations, upon the turbulence intensity and induced magnetic energy. (a) Turbulent Reynolds number
 ${\textrm{Re}}_T$
defined in (3.6), and
 ${\textrm{Re}}_\lambda$
in the inset. (b) Magnetic to kinetic energy ratio
 $R=\overline {b^2}/\overline {u^2}$
. (c) Normalized horizontal velocity
 $(\overline {u_1^2})^{1/2}$
. (d) Normalized horizontal magnetic field
 $(\overline {b_1^2})^{1/2}$
.

The induced magnetic energy in the horizontal MRTI can be quantified with the magnetic to kinetic energy ratio
 $R=\overline {b^2}/\overline {u^2}$
in figure 7(b). It becomes roughly constant at large times, and, for the largest values of
 $B_0$
, the induced magnetic energy is of the order of the induced turbulent kinetic energy.
Moreover, we observe in figures 7(c) and 7(d) that the typical velocity and magnetic field intensities in the direction
 $\boldsymbol n_1$
only exceed
 $B_0$
for the smallest values of the imposed mean magnetic field. This supports the idea that for
 $B_0 \geqslant 0.2$
the flows are somehow sensitive to the way magnetic fluctuations were created. The ratios
 $\sqrt {\overline {u_3^2}}/B_0$
and
 $\sqrt {\overline {b_3^2}}/B_0$
, not presented for brevity, both exceed unity quite rapidly, whatever the value of
 $B_0$
, indicating that the induced turbulence in the field direction
 $\boldsymbol n_1$
is the most critical feature.
As a summary, the imposed horizontal magnetic field greatly modifies both the early and long time dynamics of the MRTI. After transition to turbulence, which is not delayed by
 $B_0$
, the anisotropy of the structures is quite pronounced in the field direction and mixing is strongly reduced. Later on, statistical axisymmetry is partially restored. Due to magnetic tension and reduced mixing, structures are much bigger and the steady growth rate of the mixing layer is consequently enhanced compared with hydrodynamics. At large times, the overall constancy of mixing, growth rate, anisotropy and induced magnetic fields tends to indicate that some sort of asymptotic state is eventually reached: self-similarity is addressed in detail in § 4.
3.4. Irreversible mixing
We observed previously in figure 5(a) that mixing is reduced when increasing the intensity of
 $B_0$
. It is possible to go further and to quantify the amount of irreversible mixing by computing the sorted concentration field
 $C^*=C(z^*)$
(Winters et al. Reference Winters, Lombard, Riley and D’Asaro1995), where
 $z^*$
is the vertical coordinate such that
 $C^*$
is in a state that minimizes potential energy.
The coordinate
 $z^*$
is obtained from the probability density function
 $P(C)$
of the full 3-D density field as (Davies Wykes & Dalziel Reference Davies Wykes and Dalziel2014)
 \begin{equation} z^*(C) = z_{{\textit{min}}} + (z_{{\textit{max}}} - z_{{\textit{min}}}) \int _0^C P(C') \mathrm{d}C', \end{equation}
where
 $C'$
is a dummy variable, and
 $z_{{\textit{min}}}$
and
 $z_{{\textit{max}}}$
are the boundaries of the fluid domain. Then, it is convenient to compute the `irreversible mixing layer width’
 $L^*$
based on
 $C^*$
, namely
 $L^*=6 \int C^* (1-C^*) \mathrm{d}z^*$
.
Both the classical and sorted concentration fields are shown in figure 8(a) for
 $B_0=0$
and
 $B_0=0.2$
at their respective final time
 $t_{\textit{end}}$
. While the mean concentration profiles
 $\langle C \rangle$
have consistently the same extent (because the simulations are stopped when
 $L$
reaches roughly
 $55\,\%$
of the computational domain height), the sorted profile
 $C^\star$
is much narrower for
 $B_0=0.2$
than for
 $B_0=0$
, reflecting less irreversible mixing.
Effect of
 $B_0$
upon irreversible mixing in the R2 simulations. (a) Mean and sorted concentration profiles
 $\langle C \rangle$
(dashed line) and
 $C^*$
(plain line), for
 $B_0=0$
(black) and
 $B_0=0.2$
(yellow), at the final time
 $t_{\textit{end}}$
. The inset contains the final values of the mixing efficiency
 $\eta _{\textit{ME}}$
defined in (3.8). (b) Ratio of the sorted to classical mixing layer width
 $L^*/L$
.

The difference in width between
 $\langle C \rangle$
and
 $C^*$
is encompassed in the ratio
 $L^*/L$
shown in figure 8(b). It is clear that increasing
 $B_0$
reduces the amount of irreversible mixing. Moreover, one may remark that this ratio is very similar to
 $\varTheta$
in figure 5(a). In fact, using
 $\mathrm{d}z^*/\mathrm{d}C= \Delta z P(C)$
with
 $\Delta z = (z_{{\textit{max}}} - z_{{\textit{min}}})$
, and changing variable in the definition of
 $L^*$
yields
 $L^* \simeq 6 \Delta z \langle C(1-C) \rangle$
. Injecting the latter in the definition (3.4) of the mixing parameter yields
 $\varTheta \simeq L^*/L$
. Further interpretation is provided in § 4.7.2.
Finally, one may evaluate the mixing efficiency (Peltier & Caufield Reference Peltier and Caufield2003; Davies Wykes, Hughes & Dalziel Reference Davies Wykes, Hughes and Dalziel2015),
 \begin{equation} \eta _{\textit{ME}} = \frac {\int \varepsilon _{\textit{bpe}} \mathrm{d}t}{\int (\varepsilon _{\textit{bpe}} + \varepsilon ) \mathrm{d}t}, \end{equation}
where
 $\varepsilon _{\textit{bpe}}$
is the dissipation rate of background potential energy, computed with the sorted concentration field, and
 $\varepsilon$
the dissipation rate of total (kinetic plus magnetic) energy. The final value of the mixing efficiency is shown in the inset of figure 8(a) and decreases when
 $B_0$
increases. Consistently with the discussion in Davies Wykes & Dalziel (Reference Davies Wykes and Dalziel2014), one has
 $\eta _{\textit{ME}} \leqslant 0.5$
whatever the value of
 $B_0$
.
3.5. Energy budget
To conclude with volume-averaged quantities, we consider the energy budget of the horizontal MRTI. Usually, the variation of potential energy with respect to its initial value, corresponding to the energy injected into the system, is defined as (Cook, Cabot & Miller Reference Cook, Cabot and Miller2004)
 \begin{equation} E_P=g \overline {x_3(\rho -\rho (0))} = \frac {g}{L} \int \left (\langle \rho \rangle - \rho (0) \right ) x_3 \, \mathrm{d}x_3 \simeq -\frac {\mathcal{A}g \rho _0 L}{12}. \end{equation}
The last equality is obtained by assuming a linear mean density profile in the mixing layer, which is verified in the next section. The total energy of the system is
 $E = E_K + E_P$
, where
 $E_K = \rho _0 \mathcal{K}$
is the turbulent energy, and
 $\mathcal{K}$
is either
 $\overline {u^2}/2$
in the hydrodynamic case, or
 $(\overline {u^2} + \overline {b^2})/2$
in the MHD case. We recall that, as mentioned in § 2, there is no mean induced magnetic energy because
 $\int \langle B_i \rangle \mathrm{d}x_3=0$
. Moreover,
 $B_0^2/2$
is constant throughout the simulation by definition. Hence, the magnetic energy induced by turbulence is only
 $\overline {b^2}/2$
. The equations for the turbulent energy
 $\mathcal{K}$
and the scalar variance
 $\overline {c^2}$
read
 \begin{align} \left ( \frac {\mathrm{d} }{\mathrm{d} t} + \frac {\dot {L}}{L} \right ) \overline {c^2} & = - \frac {2}{L} \overline {u_3 c} - \varepsilon _{\textit{cc}}, \end{align}
 \begin{align} \left ( \frac {\mathrm{d} }{\mathrm{d} t} + \frac {\dot {L}}{L} \right ) \mathcal{K} & = - 2 \mathcal{A}g \overline {u_3 c} - \varepsilon , \end{align}
where
 $\varepsilon$
and
 $\varepsilon _{\textit{cc}}$
are the dissipation rates of
 $\mathcal{K}$
and
 $\overline {c^2}$
, respectively (see for instance Appendix A of Briard et al. (Reference Briard, Gréa and Nguyen2024b
) for the derivation of these equations). Using the relation
 $\dot {L} = -12 \overline {u_3 c}$
(Gréa Reference Gréa2013; Soulard et al. Reference Soulard, Griffond and Gréa2014) and (3.9), one may write the total energy equation as
 \begin{align} \left ( \frac {\mathrm{d} }{\mathrm{d} t} + \frac {\dot {L}}{L} \right ) \left (\rho _0 \mathcal{K} + E_P \right ) = - \rho _0 \varepsilon . \end{align}
After time integration, it can also be formulated as (Cabot & Cook Reference Cabot and Cook2006)
 \begin{align} LE = \rho _0 L\mathcal{K} + L E_P = - \int _0^t \rho _0 L \varepsilon \, \mathrm{d}t' = - \varPsi . \end{align}
The energy budget is displayed in figure 9(a) for both
 $B_0=0$
and
 $B_0=0.2$
. The remarkable feature is that the proportion of kinetic energy is larger in the horizontal MRTI compared with the hydrodynamic case. This is expected as magnetic tension inhibits small-scale shearing instabilities, and thus turbulent dissipation is reduced. This is in stark contrast with the vertical MRTI where turbulent dissipation is strongly increased with respect to the hydrodynamic case. Note that the early departure from unity of
 $(E_K+\varPsi )/|E_P|$
is only because we used the approximate expression (3.9) for the potential energy rather than the flux itself.
Effect of increasing
 $B_0$
, in the R2 simulations, upon the energy budget. (a) Energy budget (3.12) for
 $B_0=0.2$
(solid lines) and
 $B_0=0$
(thin dashed lines). (b) Ratio of total vertical turbulent energy to potential energy
 $\rho _0 (\overline {u_3^2} + \overline {b_3^2})/|E_p|$
.

Consistently, the proportion of induced vertical turbulent energy increases with
 $B_0$
in figure 9(b). Again, this is expected since the wavelength cutoff (1.3) increases with
 $B_0$
, meaning that magnetic tension acts on larger scales.
3.6. Horizontally averaged profiles
Horizontally averaged quantities for the R2 simulations at the time where
 $L$
reaches
 $50\,\%$
of the domain. (a,b) Mean concentration field
 $\langle C \rangle$
and concentration variance
 $\langle c^2 \rangle$
. (c,d) Vertical kinetic energy
 $\langle u_3^2 \rangle$
and horizontal kinetic energy
 $\langle u_1^2 + u_2^2 \rangle /2$
. (e, f) Vertical magnetic energy
 $\langle b_3^2 \rangle$
and horizontal magnetic energy
 $\langle b_1^2 + b_2^2 \rangle /2$
. The last four correlations are normalized by the injected potential energy in the system
 $|E_P|$
, defined in (3.9), at the time considered.

Here we briefly present horizontally averaged profiles of some second-order correlations of interest in figure 10. The main takeaways are the following ones.
-
(i) The mean concentration
$\langle C \rangle$
is linear within the mixing layer, whatever the value of
$B_0$
, with the same slope. This is expected since the midpoint mean concentration gradient is roughly
$\simeq 1/L$
. -
(ii) The scalar variance
$\langle c^2 \rangle$
increases with
$B_0$
: this is consistent with lower levels of mixing observed with
$\varTheta$
in figure 5(a). -
(iii) Despite having a horizontal imposed mean magnetic field, the vertical kinetic and magnetic energies remain dominant compared with the others components. In particular, the more intense
$B_0$
the larger
$\langle b_3^2 \rangle$
. -
(iv) On the contrary, the horizontal kinetic energy is much larger in the non-magnetic case. Indeed, smaller structures are stirred at all scales when
$B_0=0$
, which creates more turbulent fluctuations, consistently with the observations of figure 3.


3.7. Differences with the vertical MRTI and conclusions
This section gathers qualitative comparisons between the dynamics of the horizontal MRTI of the present work, and the vertical MRTI where
 $B_0$
is perpendicular to the interface (Briard et al. Reference Briard, Gréa and Nguyen2022, Reference Briard, Gréa and Nguyen2024b
). Five features should be pointed out, as follows.
-
(i) Transition to turbulence is significantly delayed for an imposed vertical mean magnetic field, due to the overall damping of small-scale shear instabilities between ascending and falling structures. This is not the case for a horizontal
$B_0$
. -
(ii) The asymptotic value of the mixing parameter remains similar to the hydrodynamic case for the vertical MRTI, whereas it is significantly smaller for the horizontal MRTI.
-
(iii) The flow is eventually less anisotropic within the horizontal MRTI compared with the vertical MRTI. For the latter, structures are rapidly vertically stretched from the instability onset, and magnetic tension damps modes which are not in the equatorial plane (
$\theta =\pi /2$
). -
(iv) The levels of induced turbulent magnetic energy are lower for the vertical MRTI and do not exceed
$55 \,\%$
. The turbulence driven by the horizontal MRTI is more intense. -
(v) The growth rate of the mixing layer decreases compared with its hydrodynamic value in the vertical MRTI, while the opposite happens for the horizontal MRTI.


This brief review illustrates the complexity of the MRTI and how the dynamics is significantly altered by changing the direction of
 $B_0$
. More quantitative comparisons are proposed in Appendix B.
So far, we have observed that an asymptotic state is reached in the horizontal MRTI, evidenced by the overall late-time constancy of
 $\alpha$
,
 $\varTheta$
, anisotropy indicators and magnetic to kinetic energy ratio
 $R$
. In the following section, we define this asymptotic state and extend the theoretical tools developed in Briard et al. (Reference Briard, Gréa and Nguyen2024b
) to characterize it.
4. Self-similarity of the horizontal MRTI?
We have shown in the previous section that there exists an asymptotic state for the horizontal MRTI, and that it is profoundly modified by the horizontal mean magnetic field
 $B_0$
: in particular, there is a strong increase of the growth rate
 $\alpha$
and a joint decrease of the mixing parameter
 $\varTheta$
.
In Briard et al. (Reference Briard, Gréa and Nguyen2024b
) for the vertical MRTI, we derived an analytical relation between
 $\alpha$
,
 $\sin ^2\gamma$
,
 $\varTheta$
and
 $R$
. The overall approach, that we will extend to the horizontal MRTI, is detailed in § 4.3, and relies on two frameworks: the LS analysis and the rapid acceleration (RA) model, described in §§ 4.4 and 4.5, respectively.
Before that, we define precisely what is the self-similar regime of the horizontal MRTI in §§ 4.1 and 4.2, and provide some definitions. Any spherically averaged spectrum
 $E_{xy}(k)$
is obtained from its corresponding spectral density
 $\mathcal{E}_{xy}(\boldsymbol k)$
as
 \begin{equation} E_{xy}(k) = \iint \mathcal{E}_{xy}(\boldsymbol k) k^2 \sin \theta \mathrm{d}\theta \mathrm{d}\phi , \quad \text{with} \quad \mathcal{E}_{xy}(\boldsymbol k)=\hat {x}(-\boldsymbol k)\hat {y}(\boldsymbol k), \end{equation}
with
 $x, y$
any fields among
 $u, b, c$
. For example, the spectral concentration variance was used in (3.5). The dynamics of the relevant spectral densities is addressed in § 4.4.
4.1. Competition between buoyancy and MHD
If the large energetic scales of the kinetic energy spectrum
 $E_{\textit{uu}}$
are indeed self-similar, then one should observe, as time increases, a collapse of the infrared spectra at small
 $k$
with the appropriate scaling, namely
 $E_{\textit{uu}}/(V_N^2 L^2)$
as function of
 $kL$
, with
 $V_N=LN$
the typical stratification velocity (Soulard et al. Reference Soulard, Griffond and Gréa2015). This is indeed verified in the hydrodynamic case in figure 11(a).
Kinetic energy spectra normalized by the large-scale self-similar scaling
 $E_{\textit{uu}}/(V_N^2 L^2)$
as function of
 $kL$
, for (a)
 $B_0=0$
and (b)
 $B_0=0.2$
. The colour goes from blue at early time to red in the asymptotic state every each
 $t=0.5$
of the R2 simulations.

But there remains some scatter in the magnetic case with
 $B_0=0.2$
in figure 11(b). Nevertheless, we have observed in figure 4(b) that the mixing layer grows like
 $L \sim 2\alpha \mathcal{A}g t^2$
, with constant growth rate
 $\alpha$
. This means that eventually, at large times, the energetic scales of the flow are dominated by buoyancy rather than MHD.
In fact, the critical wavenumber
 $k_B=N/B_0$
was put forward in (3.3): scales larger than
 $1/k_B$
are driven by buoyancy whereas smaller scales are dominated by MHD. Therefore, one needs to analyse whether the MRTI energetic scales are larger than
 $1/k_B$
or not. This is done through the ratio
 $k_{\textit{uu}}/k_B$
, where
 $k_{\textit{uu}}$
indicates the maximum of the energy spectrum, and is thus related to the integral scale as
 $l_{\textit{uu}}=1/k_{\textit{uu}}$
. It is clear in figure 12(a) that the large scales of the horizontal MRTI are eventually dominated by buoyancy only for
 $B_0 \leqslant 0.2$
.
The decrease of
 $k_{\textit{uu}}/k_B$
with time is expected. Indeed, in the self-similar regime, it is reasonable to assume that the integral scale evolves like the mixing layer, namely
 $k_{\textit{uu}} \sim 1/t^2$
. On the contrary,
 $k_B=N/B_0$
decreases like
 $\sim 1/\sqrt {L} \sim 1/t$
. Hence, at sufficiently large times, one will always end up with
 $k_{\textit{uu}}\lt k_B$
, meaning that energy-containing scales are driven by buoyancy effects. In a finite size domain, this buoyancy-driven dynamics of the large scales is therefore more difficult to reach with increasing values of
 $B_0$
.
Nevertheless, the mixing layer growth rate eventually becomes constant, as revealed in figure 4(b). So it should be possible to apply self-similarity arguments and to derive an analytical prediction for
 $\alpha$
. In the following, we argue that some sort of self-similarity is indeed reached for the scales larger than
 $1/k_B$
in the horizontal MRTI, and we discuss to which extent this might be true. Afterwards, some background regarding the large-scale dynamics and buoyancy drag equations is provided before diving into the analytical developments.
(a) Ratio of integral wavenumber
 $k_{\textit{uu}}$
to critical wavenumber
 $k_B$
, defined in (3.3), as function of
 $B_0$
for the R2 simulations. (b) Growth rate for simulation R2B20AG05: the measured
 $\alpha$
from the DNS (black); the hydrodynamic prediction (4.5) (blue); the vertical MRTI prediction (4.7) (red).

4.2. Quasi-self-similarity and late time dynamics
So far, within the horizontal MRTI, we have observed that the growth rate of the mixing layer becomes constant and roughly twice as big as in hydrodynamics for sufficiently large
 $B_0$
. This is related to the largest scales of the flow being dominated by buoyancy rather than MHD, a threshold characterized by the critical wavenumber
 $k_B=N/B_0$
.
Still, the trends of the ratio
 $k_{\textit{uu}}/k_B$
in figure 12(a) raise the question of asymptotically large times, when
 $k_B \gg k_{\textit{uu}}$
. Such a regime, that combines large
 $B_0$
and
 $k_B \gg k_{\textit{uu}}$
, cannot be reached with the present DNS because it would require much bigger computational domains in order to avoid confinement of the structures.
Nevertheless, let us consider such an asymptotic regime. Then, all scales, from the large energetic ones to the smallest dissipative ones would be dominated by buoyancy. More precisely, the linear contribution of
 $B_0$
, that is encompassed within
 $k_B$
, would become negligible compared with buoyancy. As for the effects of nonlinearities, complementary simulations (not presented) with initial magnetic perturbations and
 $B_0=0$
show that the magnetic to kinetic energy ratio decays. This would suggest that magnetic energy may not remain strong enough to impact significantly the largest scales of the flow. Nevertheless, the fate of induced magnetic energy with
 $B_0=0$
remains an open question.
Therefore, the overall scenario of the horizontal MRTI would be as follows, and is sketched in figure 13. After the onset of instability and transition to turbulence (I), the flow reaches a quasi-self-similar (QSS) state with constant growth rate and flow statistics (II). This QSS state, observed for large
 $B_0$
values, is characterized by
 $k_B L \sim {O}(1)$
. Eventually, when
 $k_B \gg k_{\textit{uu}}$
, the linear effects of
 $B_0$
are negligible at all scales. But up to this time, there has been a significant amount of induced magnetic energy. The system would then be equivalent to a flow with
 $R \sim {O}(1)$
and
 $B_0=0$
. Therein, the linear analysis of the large scales would conclude that the growth rate eventually returns to its hydrodynamic value (this will be detailed later on) after a long transient (III).
Sketch of the overall scenario of the horizontal MRTI with (I) onset and transition to turbulence, (II) the QSS (III) the slow transient toward an `hydrodynamic-like’ state. Here
 $\alpha _{\textit{hyd}}$
and
 $\alpha _{\textit{MRTI}}^\parallel$
are defined in (4.5) and (4.24), respectively.

Since this long transient towards a ‘hydrodynamic-like’ RTI cannot be reached in DNS, we aim at characterizing in the following sections the QSS state of the horizontal MRTI with strong
 $B_0$
. In § 4.4, we will make explicit how the QSS condition is enforced for the LS analysis.
4.3. Overall methodology: buoyancy–drag equations and large-scale dynamics
In hydrodynamics, the self-similar evolution of the mixing layer is commonly given by the buoyancy–drag equations (Davies & Taylor Reference Davies and Taylor1950; Ramshaw Reference Ramshaw1998; Dimonte Reference Dimonte2000)
 \begin{equation} \ddot {L} = - C_d \frac {\dot {L}^2}{L} + C_b \mathcal{A}g, \end{equation}
where the drag and buoyancy coefficients,
 $C_d$
and
 $C_b$
, respectively, are related to the growth rate as
 \begin{equation} \alpha _{\textit{BDE}} = \frac {C_b}{4 + 8 C_d}. \end{equation}
There are various approaches that allow to relate
 $C_b$
and
 $C_d$
to the flow characteristics and hence to predict the growth rate. The LS analysis consists in relating the growth rate to the infrared slope
 $s$
of the kinetic energy and scalar variance spectra: the infrared range represents scales which are bigger than the integral scale and where the spherically averaged spectra behave like
 $k^s$
. Poujade & Peybernes (Reference Poujade and Peybernes2010) and Soulard et al. (Reference Soulard, Griffond and Gréa2015) obtained the following large-scale prediction for the dominant modes:
 \begin{equation} \alpha _{{\textit{LS}}}(s) = \frac {1}{(s+2)(s+3)}. \end{equation}
Equating this with (4.3) provides
 $C_d=(s+2)/2$
and
 $C_b=4/(s+2)$
, which yields the closure
 $C_b C_d =2$
that will be used afterwards. Later on, Soulard et al. (Reference Soulard, Griffond and Gréa2015) showed that (4.4) is in fact an upper bound, and that the infrared slope of the RTI is doomed to become
 $s=4$
due to backscattering. Therefore, the growth rate measured in DNS should verify
 $\alpha \lt \alpha _{{\textit{LS}}}(s=4) = 0.0238$
. This was verified multiple times (Soulard et al. Reference Soulard, Griffond and Gréa2015, Reference Soulard, Griffond and Gréa2016; Morgan & Black Reference Morgan and Black2020; Briard et al. Reference Briard, Gréa and Nguyen2022); the most probable value
 $\simeq 0.020$
was obtained from a large database of well-resolved DNS (Thévenin et al. Reference Thévenin, Gréa, Kluth and Nadiga2025b
).
The RA framework, introduced in Gréa (Reference Gréa2013), relies on the evolution equations (2.1), keeping only interactions between the fluctuations and the mean field: in other words, fluctuating nonlinearities and dissipative terms are discarded. From this, the equations for the spectral second-order correlations are built and integrated over all wavenumbers
 $k$
, which differs from the previous LS analysis. One obtains after some algebra the classical RTI buoyancy–drag equation with
 $C_d=1/2$
and
 $C_b=4 \sin ^2\gamma (1-\varTheta )$
.
The story does not stop here, because turbulent diffusion needs to be modelled within the RA framework. Indeed,
 $C_d=1/2$
reflects only the drag experienced by the growth of the mixing layer without turbulent nonlinearities and dissipation. Basically, the drag coefficient is modified into
 $C_d \to 1/2 + \mathcal{D}$
where
 $\mathcal{D}$
is closed by
 $C_d C_b =2$
. The underlying argument is that the growth rate is driven by the large scales, and imposes some relation between
 $C_b$
and
 $C_d$
. With
 $C_b$
determined by the RA framework, the complex turbulent nonlinearities and dissipation are modelled through
 $C_d$
. Combined with (4.3), this yields the following relationship (Gréa Reference Gréa2013):
 \begin{equation} \alpha _{\textit {hyd}} = \frac {\sin ^4 \gamma (1-\varTheta )^2}{1+ \sin ^2 \gamma (1-\varTheta )}, \end{equation}
which was also assessed several times with excellent quantitative agreement.
For the MRTI with an imposed background vertical mean magnetic field, a similar methodology was applied in Briard et al. (Reference Briard, Gréa and Nguyen2024b
). In the following, the superscript
 $\perp$
refers to
 $B_0$
being perpendicular to the interface. The LS analysis provided that
 \begin{equation} \alpha _{{\textit{LS}}}^\perp (s) = \frac {1}{(1+R)(s+2)(s+3)} = \frac {\alpha _{{\textit{LS}}}(s)}{1+R}, \end{equation}
where
 $R$
is the magnetic to kinetic energy ratio. The RA model was then extended, assuming that the ratio
 $R$
was constant in the self-similar regime. It was found that while
 $C_b$
was unchanged compared with hydrodynamics,
 $C_d$
was increased due to turbulent magnetic energy dissipation. Consistently, the closure
 $C_d = 2(1+R)/C_b + R/2$
was derived (which gives
 $C_b C_d=2$
for
 $R=0$
), and combined with (4.3), yielded the prediction for the vertical MRTI,
 \begin{equation} \alpha _{\textit{MRTI}}^\perp = \frac {\sin ^4 \gamma (1-\varTheta )^2}{(1+R) \left[1+ \sin ^2 \gamma (1-\varTheta )\right]} = \frac{\alpha_{\textit{hyd}}}{1+R}. \end{equation}
This prediction was assessed in Briard et al. (Reference Briard, Gréa and Nguyen2022, Reference Briard, Gréa and Nguyen2024b
). We make here an additional comment regarding the consequences of (4.6) which were not discussed in the latter references. The present non-magnetic DNS of the RTI yields
 $\alpha \simeq 0.019$
, which is roughly
 $80 \,\%$
of the theoretical upper bound
 $\alpha _{{\textit{LS}}}(s=4)$
. If we use the same ratio
 $C_\alpha =0.8$
for the vertical MRTI upper bound (4.6), and typical values of the magnetic to kinetic energy ratio
 $0.4 \leqslant R \leqslant 0.55$
, this would yield growth rates
 $0.0123 \leqslant \alpha \leqslant 0.0136$
which nicely encompasses all the DNS results.
Our objective in the following is to derive a prediction for
 $\alpha_{\textit{MRTI}}^\parallel$
, the mixing layer growth rate in the horizontal MRTI, where
 $B_0$
is parallel to the interface. Such a prediction is required, since the hydrodynamic prediction (4.5) and the vertical MRTI one (4.7) are shown to significantly overestimate the measured growth rate from the DNS in figure 12(b).
To this aim, we first derive in § 4.4, with the LS analysis, the upper bound
 $\alpha _{{\textit{LS}}}^\parallel$
for the growth rate. Afterwards in § 4.5, we apply the RA framework, along with additional assumptions, to obtain an analytical expression for
 $C_b$
. Finally in § 4.6, everything is put together to obtain the prediction for
 $\alpha _{\textit{MRTI}}^\parallel$
. Assumptions are discussed and assessed in § 4.7.
4.4. Large-scale analysis of the horizontal MRTI
We derive the simplified evolution equations that describe the large-scale dynamics of the various spectral densities of interest. For this range of scales, nonlinear and dissipative terms are neglected, and the spectral densities behave like
 $\mathcal{E}(\boldsymbol k) \sim k^{s-2}$
, where
 $s$
is the infrared slope of the corresponding spherically averaged spectra.
The spectral correlations considered are the vertical kinetic energy
 $\mathcal{E}_{\textit{uu}}(\boldsymbol k) = \hat {u}_3(\boldsymbol k) \hat {u}_3(-\boldsymbol k)$
, the vertical magnetic energy
 $\mathcal{E}_{\textit{bb}}(\boldsymbol k) = \hat {b}_3(\boldsymbol k) \hat {b}_3(-\boldsymbol k)$
, the vertical mass flux
 $\mathcal{E}_{\textit{uc}}(\boldsymbol k) = \hat {c}(\boldsymbol k) \hat {u}_3(-\boldsymbol k)$
, the vertical magnetic flux
 $\mathcal{E}_{bc}(\boldsymbol k) = \hat {c}(\boldsymbol k) \hat {b}_3(-\boldsymbol k)$
, the concentration variance
 $\mathcal{E}_{\textit{cc}}(\boldsymbol k) = \hat {c}(\boldsymbol k) \hat {c}(-\boldsymbol k)$
and the cross-helicity
 $\mathcal{E}_{\textit{ub}}(\boldsymbol k) = \hat {b}_3(\boldsymbol k) \hat {u}_3(-\boldsymbol k)$
. Their equations are given in Appendix A.2. Here, we write these equations in a slightly different form that highlights that only the imaginary parts of
 $\mathcal{E}_{\textit{ub}}$
and
 $\mathcal{E}_{bc}$
are strongly coupled to the other non-magnetic correlations,
 \begin{align} \frac {\partial \mathcal{E}_{\textit{uu}}}{\partial t} &= - 4 \mathcal{A}g {\textrm{Re}} \left [ \mathcal{E}_{\textit{uc}} \right ] \sin ^2 \theta - 2 k_1 B_0 {\rm Im} \left [\mathcal{E}_{\textit{ub}} \right ]\!, \end{align}
 \begin{align} \frac {\partial {\textrm{Re}} \left [\mathcal{E}_{\textit{uc}} \right ]}{\partial t} &= -2 \mathcal{A}g \mathcal{E}_{\textit{cc}} \sin ^2 \theta - \frac {1}{L} \mathcal{E}_{\textit{uu}} + k_1 B_0 {\rm Im} \left [\mathcal{E}_{bc} \right ]\!, \end{align}
 \begin{align} \frac {\partial \mathcal{E}_{\textit{cc}}}{\partial t} &= -\frac {2}{L} {\textrm{Re}} \left [ \mathcal{E}_{\textit{uc}} \right ]\!, \end{align}
 \begin{align} \frac {\partial \mathcal{E}_{\textit{bb}}}{\partial t} &= + 2 k_1 B_0 {\rm Im} \left [\mathcal{E}_{\textit{ub}} \right ]\!, \end{align}
 \begin{align} \frac {\partial {\rm Im} \left [ \mathcal{E}_{\textit{ub}} \right ] }{\partial t} & = 2 \mathcal{A}g {\rm Im} \left [ \mathcal{E}_{bc} \right ] \sin ^2 \theta + k_1 B_0 \left (\mathcal{E}_{\textit{uu}} - \mathcal{E}_{\textit{bb}} \right )\!, \end{align}
 \begin{align} \frac {\partial {\rm Im} \left [ \mathcal{E}_{bc} \right ] }{\partial t} & = \frac {1}{L} {\rm Im} \left [ \mathcal{E}_{\textit{ub}} \right ] - k_1 B_0 {\textrm{Re}} \left [ \mathcal{E}_{\textit{uc}} \right ]\!. \\[9pt] \nonumber \end{align}
Several remarks should be made. First, the
 $B_0$
terms are the only ones that depend on the modulus of the wavevector
 $\boldsymbol k$
. Incidentally, the vertical MRTI equations are obtained by replacing
 $k_1 \to k_3$
. Moreover, if we consider perturbations with horizontal wavevector (
 $\theta =\pi /2$
) normal to
 $B_0$
(
 $\phi =\pi /2$
), then the
 $k_1 B_0$
terms vanish and we recover the non-magnetic case.
We have put forward in § 4.1 that only scales larger than
 $1/k_B$
are dominated by buoyancy. In § 4.2, we defined the quasi-self-similarity as the state where the growth rate of the horizontal MRTI is constant and much larger than in hydrodynamics. In the following, we investigate how the QSS manifests itself in the large-scale system (4.8). To highlight the differences, we start by recalling the process in hydrodynamics. The usual self-similarity condition reads
 \begin{equation} \int _0^{2\pi } \int _0^\pi \int _0^{k_{\textit{uu}}(t)} \begin{pmatrix} \mathcal{E}_{\textit{cc}}(\boldsymbol k) \\ \mathcal{E}_{\textit{uc}}(\boldsymbol k) \\ \mathcal{E}_{\textit{uu}}(\boldsymbol k) \\ \end{pmatrix} k^2 \sin \theta \mathrm{d}k \mathrm{d}\theta \mathrm{d}\phi \sim \begin{pmatrix} L \\ L \dot {L} \\ L \dot {L}^2 \\ \end{pmatrix}\!, \end{equation}
with
 $k_{\textit{uu}} \sim 1/L$
. Injecting the large-scale decomposition
 $\mathcal{E}_{xy}(\boldsymbol k,t) = \mathcal{E}_{xy}^0(\theta ,\phi ) k^{s-2} t^{n_{xy}}$
, where
 $n_{xy}$
is the constant time exponent, in the hydrodynamic system ((4.8) with
 $B_0=0$
), and integrating according to (4.9), yields
 $n_{\textit{cc}}=2(s+2)$
,
 $n_{\textit{uc}}=n_{\textit{cc}}+1$
and
 $n_{\textit{uu}}=n_{\textit{cc}}+2$
.
To determine the QSS condition for the horizontal MRTI, the same large-scale decomposition as before for all spectra is injected into the full system (4.8). It follows that the only possibility for the magnetic terms to have the appropriate scaling, is to integrate up to some wavenumber that would decrease like
 $1/t$
. Hopefully, we have shown in § 4 that
 $k_B=B_0/N$
verifies this property, and consistently represents the threshold between scales dominated by buoyancy and MHD. Therefore, the QSS condition reads
 \begin{equation} \int _0^{2\pi } \int _0^\pi \int _0^{k_B(t)} \begin{pmatrix} \mathcal{E}_{\textit{cc}} \\ \mathcal{E}_{\textit{uc}} \text{ (and $\mathcal{E}_{bc}$)} \\ \mathcal{E}_{\textit{uu}} \text{ (and $\mathcal{E}_{\textit{bb}}$, $\mathcal{E}_{\textit{ub}}$)} \\ \end{pmatrix} k^2 \sin \theta \mathrm{d}k \mathrm{d}\theta \mathrm{d}\phi \sim \begin{pmatrix} L \\ L \dot {L} \\ L \dot {L}^2 \\ \end{pmatrix}\!. \end{equation}
The resulting system after applying the QSS condition is given in Appendix A.2. A visual proof of the relevance of the QSS is shown in figure 14(a), where the self-similar scaling
 $E_{\textit{uu}}/(V_N^2 L^2)$
is replaced by
 $E_{\textit{uu}}/(V_N^2 L L_B)$
, with
 $L_B=1/k_B$
. A better collapse of the large scales is obtained compared with figure 11(b). Note that the self-similarity of the horizontal MRTI is discussed as well in Kalluri & Hillier (Reference Kalluri and Hillier2025), where the
 $1/t$
scaling of the magnetic term was reported. Using (4.10) allows to overcome this difficulty here.
Spectra for R2 simulations. (a) Large-scale self-similar scaling: same as figure 11(b) but with
 $E_{\textit{uu}}/(V_N^2 L L_B)$
. (b) Kinetic and magnetic spectra
 $E_{\textit{uu}}$
and
 $E_{\textit{bb}}$
along with the critical wavenumber
 $k_B$
(3.3) for
 $B_0=0.2$
at the time where
 $L$
is
 $40\,\%$
of the domain.

There are numerous outcomes. First, one gets from (4.10) that
 $n_{\textit{cc}} = s+3$
,
 $n_{\textit{uc}}=n_{bc}=n_{\textit{cc}}+1$
and
 $n_{\textit{uu}}=n_{\textit{bb}}=n_{\textit{cc}}+2$
. Second, one obtains the prediction for the upper bound of the growth rate in the horizontal MRTI in the QSS state, which is the first novelty of the present work,
 \begin{align} (1+R_{\!B}) \alpha _{{\textit{LS}}}^\parallel (s) & = \frac {4}{(s+3)(s+5)} = \frac {4}{n_{\textit{cc}} n_{\textit{uu}}}, \end{align}
 \begin{align} \frac {R_{\!B}}{1+R_{\!B}} & = \frac {(s+1)^2}{(s+2)^2} \frac {(s+3)}{(s+5)} \cos ^2 \phi . \end{align}
Here,
 $R_{\!B}$
is the magnetic to kinetic energy ratio for scales larger than
 $1/k_B$
. As such, it is smaller than the global
 $R = \overline {b^2}/\overline {u^2}$
displayed in figure 7(b). Indeed, it is clear in figure 14(b) that the magnetic energy spectrum dominates only in the inertial range for
 $k \gg k_B$
. Note that in hydrodynamics the large-scale prediction (4.4) can also be written
 $\alpha _{{\textit{LS}}}=4/(n_{\textit{cc}} n_{\textit{uu}})$
, so that (4.11a
) can formally be expressed as
 $(1+R_{\!B}) \alpha _{{\textit{LS}}}^\parallel = \alpha _{{\textit{LS}}}$
.
The prediction (4.11a
) provides an upper bound for the horizontal MRTI growth rate with the infrared slope
 $s=4$
. One can use the ratio
 $R_{\!B}$
from the simulations, and this gives the red and blue curves in figure 15(a) that are indeed higher than the measured growth rates from the DNS. Another possibility is to use (4.11b
) and to assume statistical axisymmetry. For
 $s=4$
, this would yield a unique value
 $R_{\!B}=0.37$
independent of
 $B_0$
, and a corresponding
 $\alpha _B = 0.0463$
, also reported in figure 15(a) as a black dashed line. In both cases, one ends up with
 $\alpha \leqslant \alpha _{{\textit{LS}}}^\parallel (s=4)$
, which validates the prediction (4.11a
). Note that if one applies the coefficient
 $C_\alpha =0.8$
discussed in § 4.3, one gets
 $C_\alpha \alpha _B = 0.0371$
, which is quite close to the DNS results in figure 15(a). This shows that there is the same distance between the growth rate and its upper bound in the classical RTI, and the vertical and horizontal MRTI.
(a) Growth rates for all simulations. Symbols: blue
 $\square$
for the R1 simulations with
 $\nu =2.10^{-4}$
; red
 $\bigcirc$
for the R2 simulations with
 $\nu =10^{-4}$
. The red and blue lines represent the upper bounds (4.11a
) ((4.4) for
 $B_0=0$
) with
 $R_{\!B}$
computed from the DNS; the dashed black line corresponds to (4.11a
) with
 $R_{\!B}=0.37$
(
 $\alpha _B = 0.0463$
); the red one is
 $C_\alpha \alpha _B = 0.0371$
. (b) Ratio of the kinetic, scalar and vertical flux spherically averaged spectra at large scales at the time where
 $L$
is
 $50\,\%$
of the domain, as function of
 $k_\perp$
normalized by the integral wavenumber
 $k_{\textit{uu}}^\perp$
of
 $E_{\textit{uu}}(k_\perp )$
.

In addition of the prediction (4.11a
), solving the
 $k$
-integrated system (4.8) also provides that spectra are perfectly correlated at large scales, like
 $\mathcal{E}_{\textit{uu}}^0 \mathcal{E}_{\textit{cc}}^0 = {\mathcal{E}_{\textit{uc}}^0}^2$
. This is assessed in figure 15(b) by considering
 $k_\perp$
-spectra, which are related to the spectral densities for
 $\theta =\pi /2$
. The ratio
 $E_{\textit{uc}}^2/(E_{\textit{uu}}E_{\textit{cc}})$
tends towards unity for horizontal wavenumbers
 $k_\perp$
smaller than the horizontal integral wavenumber
 $k_{\textit{uu}}^\perp$
.
Finally, we recall that in the late time regime discussed in § 4.2 where
 $k_B L \gg 1$
, the exchange terms, scaling like
 $(k_1 B_0)$
in the system (4.8), would be negligible. As a consequence, one would recover the hydrodynamic expression (4.4) for
 $\alpha _{{\textit{LS}}}$
.
4.5. Rapid acceleration for the horizontal MRTI
We move on with the RA framework in order to build the buoyancy–drag equation for the QSS of the horizontal MRTI. For clarity, we recall that unlike the LS analysis, the system (4.8) is now integrated over all wavenumbers, which requires some additional assumptions, which are discussed below. At the end of the RA approach, we will have an analytical expression for
 $C_b$
. Combining it with the result of the previous LS analysis, the closure for
 $C_d$
will be obtained in § 4.6, and therefore the desired prediction for the growth rate.
In the non-magnetic case, spectral densities, integrated upon
 $k$
and
 $\phi$
, are expended in Legendre polynomials for the
 $\theta$
-dependence (Gréa Reference Gréa2013). In the MRTI, the difficulty comes from the exchange terms in (4.8a
) and (4.8d
) that depend on the wavenumber
 $k$
and redistribute energy between the kinetic and magnetic reservoirs. In the vertical MRTI, this difficulty is circumvented because the exchanges terms scale like
 $\cos \theta$
and are thus negligible for the dominant modes with
 $\theta =\pi /2$
.
This is not the case anymore for the horizontal MRTI. Therefore, to perform the
 $k$
-integration, we make a first assumption and replace
 $kB_0$
by some Alfvèn frequency
 $f_A$
that does not depend on
 $k$
and does not need to be specified for the moment. In the
 $k$
-integrated system (4.8), the spectral densities are then expanded like
 \begin{equation} \int k^2 \mathcal{E}_{xy}(\boldsymbol k, t) \mathrm{d}k = F_{xy}(\theta ,\phi ) g_{xy}(L,\dot {L}), \end{equation}
with
 $g_{\textit{cc}}=L$
,
 $g_{bc}= g_{\textit{uc}}=L \dot {L}$
and
 $g_{\textit{uu}} = g_{\textit{bb}} = g_{\textit{ub}} = L \dot {L}^2$
. We also introduce
 $f_{xy}(\theta ) = \int F_{xy}(\theta ,\phi ) \mathrm{d}\phi$
. In the following, the main steps of the developments are presented. Two additional assumptions will be made: statistical axisymmetry and the constancy in the quasi-self-similar regime of the magnetic to kinetic energy ratio
 $R$
.
Step 1. First, some relations between the angular functions
 $F_{xy}$
can be established. From the scalar variance (4.8c
), one obtains
 \begin{equation} F_{\textit{cc}}(\theta , \phi ) = - 2 F_{\textit{uc}}(\theta , \phi ). \end{equation}
Then, applying a time-derivative to the mixing zone width, defined in (2.3), and using the statistical axisymmetry assumption for the
 $\phi$
-integration, one gets
 \begin{equation} \dot {L} = - \frac {12}{L} \iiint \mathcal{E}_{\textit{uc}}(\boldsymbol k) \mathrm{d}^3\boldsymbol k \to f^{(0)}_{\textit{uc}} = -\frac {1}{24}, \end{equation}
where
 $f_{\textit{uc}}^{(0)}$
is the zeroth-order term in the Legendre expansion for
 $f_{\textit{uc}}(\theta )$
. Afterwards, from the definition of the mixing parameter (3.4), one gets
 $f_{\textit{cc}}^{(0)}=(1-\varTheta )/12$
.
Step 2. Now that all necessary angular functions are known, a time-derivative is applied to (4.14) and yields
 \begin{equation} \ddot {L} + \frac {\dot {L}^2}{L} = -12 \iint \left ( -2\mathcal{A}g \sin ^2\theta F_{\textit{cc}} - \frac {\dot {L}^2}{L} F_{\textit{uu}} + f_A \cos \phi \sin \theta \dot {L} F_{bc} \right ) \sin \theta \mathrm{d}\theta \mathrm{d}\phi . \end{equation}
The first term in the integrals gives the usual hydrodynamic buoyancy coefficient, and is described in Step 4. The second one scales like
 $\dot {L}^2/L$
and contributes to the drag coefficient. The final term encompasses the effects of induced magnetic field both on buoyancy and drag. How to deal with it is described in the next step and constitutes the second theoretical novelty of this work.
Step 3. Using the decomposition (4.12) into the
 $k$
-integrated equation (4.8f
) for
 ${\rm Im} [ \mathcal{E}_{bc} ]$
gives
 \begin{equation} - \dot {L} F_{bc}(\theta , \phi ) = \frac {2}{3} f_A \cos \phi \sin \theta L F_{\textit{uc}}(\theta , \phi ) + \frac {2}{3} \dot {L} F_{\textit{ub}}(\theta , \phi ). \end{equation}
The last unknown function
 $F_{\textit{ub}}$
is determined using the
 $k$
-integrated equation (4.8d
) for
 $\mathcal{E}_{\textit{bb}}$
, and combining it with (4.8a
) using the assumption of constant
 $R$
. Hence, one gets
 \begin{equation} 2 \dot {L} f_A \cos \phi \sin \theta F_{\textit{ub}}(\theta , \phi ) = -4 \mathcal{A}g \frac {R}{1+R} \sin ^2\theta F_{\textit{uc}}(\theta , \phi ). \end{equation}
Combining (4.16) and (4.17) in (4.15) yields
 \begin{align} \ddot {L} & = \frac {\dot {L}^2}{L} \left ( -1 + 12 \int f_{\textit{uu}} \sin \theta \mathrm{d}\theta \right ) + 24 \mathcal{A}g \int \sin ^3\theta f_{\textit{cc}} \mathrm{d}\theta \nonumber \\ &\quad + 8 \iint F_{\textit{uc}} \sin ^3\theta \left (2\mathcal{A}g \frac {R}{1+R} + L f_A^2 \cos ^2\phi \right ) \mathrm{d}\theta \mathrm{d}\phi . \end{align}
From this point, we argue that in the QSS, the characteristic time
 $1/f_A$
should scale like
 $L/\dot {L}$
. Therefore, the first part of the magnetic flux in
 $\mathcal{A}g$
modifies the buoyancy, and the second part in
 $f_A^2$
modifies the drag. If statistical axisymmetry was not verified, there would be an effect upon the
 $\cos ^2\phi$
term. But we have argued that this term is included in the drag part, that will be closed in § 4.6. Departure from axisymmetry, if significant, is therefore partially modelled through the
 $C_d$
closure.
Step 4. The anisotropy parameter
 $\sin ^2\gamma$
, defined in (3.5), is used to deal with the
 $\sin ^3\theta$
terms: it can be interpreted as the ratio of the second- to zeroth-order harmonics of
 $f_{\textit{cc}}$
. Eventually, one gets
 $\int f_{\textit{cc}}(\theta ) \sin ^3\theta \mathrm{d}\theta = \sin ^2\gamma \int f_{\textit{cc}}^{(0)} \sin \theta \mathrm{d}\theta$
.
Step 5. Putting everything together, one obtains the buoyancy drag equation for the horizontal MRTI in the QSS,
 \begin{equation} \ddot {L} = - \frac {\dot {L}^2}{L} \left ( \frac {1}{2} + f(R) \right ) + 4 \mathcal{A}g \sin ^2 \gamma (1-\varTheta ) \left (1 - \frac {R/3}{1+R} \right )\!, \end{equation}
where
 $f(R)$
is a positive function of
 $R$
that does not need to be made explicit. The RA approach, extended to the horizontal MRTI with the assumptions of constant
 $R$
and statistical axisymmetry, thus provides an expression for the buoyancy coefficient
 \begin{align} C_b = 4 \sin ^2\gamma (1-\varTheta ) \left ( \frac {1+2R/3}{1+R} \right ) = C_b^0 \left ( \frac {1+2R/3}{1+R} \right )\!, \end{align}
where
 $C_b^0$
is the hydrodynamic value.
4.6. Growth rate of the horizontal MRTI
With the RA approach, we have obtained the expression (4.20) for the buoyancy coefficient of the horizontal MRTI. To obtain the growth rate prediction
 $\alpha _{\textit{MRTI}}^\parallel$
, the final step is to close
 $C_d$
by accounting for the turbulent diffusion and nonlinearities. The closure derived within the vertical MRTI cannot be used because it relies on the fact that buoyancy is not modified by the induced magnetic fields: this is not the case anymore with the horizontal MRTI.
As recalled in § 4.3, the underlying idea is that the growth rate is driven by the large scales. Hence the previous LS analysis may guide us into finding the closure for
 $C_d$
.
A noticeable feature is that induced magnetic fields are subdominant at the largest scales of the flow. This was already shown in figure 14(b), and we illustrate this here in another way. Let us consider the various spherically averaged production terms in the spectral flux equation, namely
 $P_{\textit{uc}}^{(c)}$
,
 $P_{\textit{uc}}^{(u)}$
and
 $P_{\textit{uc}}^{(b)}$
, corresponding, respectively, to buoyancy, Reynolds stress and magnetic tension (these quantities are defined in § 4.7.1). It is clear in figure 16(a) that for all
 $B_0$
, the magnetic contribution is small compared with the other ones at the largest scales.
(a) Ratio of the magnetic to buoyancy-and-kinetic production terms (of the evolution equation of the spectral flux (4.25)) for various
 $B_0$
at the end of the R2 simulations. (b) Ratio of the measured
 $\alpha$
and its predictions, (4.24) for the horizontal MRTI (red), and (4.5) for the hydrodynamic RTI (blue).

As a result we assume that for large scales, the drag can be formally represented with a hydrodynamic-like closure
 $C_d^{{\textit{LS}}} C_b^{{\textit{LS}}} = 2$
. In other words, the large-scale magnetic effects are encompassed in buoyancy rather than drag. Moreover, using
 $(1+R_{\!B}) \alpha _{{\textit{LS}}}^\parallel = \alpha _{{\textit{LS}}}$
from § 4.4, one can identify
 $C_b^{{\textit{LS}}} = C_b^0/(1+R_{\!B})$
. Therefore, the LS analysis provides the following constraint:
 \begin{equation} \alpha ^\parallel _{{\textit{LS}}} = \frac {C_b^0/(1+R_{\!B})}{4+ 16 (1+R_{\!B}) / C_b^0}. \end{equation}
When considering all scales, we substitute
 $R_{\!B} \to R$
, and
 $C_d$
must be such that
 \begin{equation} \alpha _{\textit{MRTI}}^\parallel = \frac {C_b}{4+8 C_d} = \frac {C_b^0/(1+R)}{4+ 16 (1+R) / C_b^0}, \end{equation}
where
 $C_b$
is given by (4.20). This yields
 \begin{equation} C_d = \frac {2}{C_b} \left ( 1 + \frac {2R}{3} \right )^2 + \frac {R}{3}, \end{equation}
and subsequently the growth rate in the QSS of the horizontal MRTI reads
 \begin{equation} \alpha _{\textit{MRTI}}^\parallel = \frac {1}{(1+R)} \frac {\sin ^4\gamma (1-\varTheta )^2}{(1+R) + \sin ^2\gamma (1-\varTheta )}. \end{equation}
Discussions about the physical interpretation and the validity of some assumptions are postponed to § 4.7. Also, it is recalled that the raw values of
 $\alpha$
were shown in figure 15(a) and that they reach a plateau for the largest
 $B_0$
.
The prediction (4.24) is compared with all the DNS of table 1 in figure 16(b). It is first revealed that the hydrodynamic prediction (4.5) strongly overestimates the growth rate for all values of
 $B_0$
. Then, the agreement with the horizontal MRTI prediction is quite convincing, for both the R1 (
 $\square$
,
 $\nu =2.10^{-4}$
) and R2 (
 $\bigcirc$
,
 $\nu =10^{-4}$
) simulations. In conclusion, the prediction (4.24) correctly relates the growth rate to mixing, anisotropy and induced magnetic fields in the QSS of the horizontal MRTI.
4.7. Discussions and physical interpretation
4.7.1. Validity of the
$C_b$
–
$C_d$
closure


Here we show that the closure (4.23) derived for the drag coefficient
 $C_d$
represents well the DNS results. In other words, we need to express which terms of the evolution equation of the spectral flux
 $\mathcal{E}_{\textit{uc}}$
are modelled by
 $C_d$
. The equation reads
 \begin{equation} \left ( \frac {\partial }{\partial t} + (\nu +\kappa ) k^2 \right ) \mathcal{E}_{\textit{uc}}(\boldsymbol k) = \mathcal{T}_{\textit{uc}}(\boldsymbol k) + \mathcal{P}_{\textit{uc}}^{(c)}(\boldsymbol k) + \mathcal{P}_{\textit{uc}}^{(u)}(\boldsymbol k) + \mathcal{P}_{\textit{uc}}^{(b)}(\boldsymbol k), \end{equation}
with
 \begin{align} \mathcal{P}_{\textit{uc}}^{(u)}(\boldsymbol k) & = \hat {u}_3(\boldsymbol k) \mathcal{P}_c(-\boldsymbol k) + \hat {u}_3(-\boldsymbol k) \mathcal{P}_c(\boldsymbol k) \quad \text{with} \quad \mathcal{P}_c(\boldsymbol k) = - \big(\hat {u}_3 * \widehat {\partial _{x_3} \langle C \rangle }\big)(\boldsymbol k), \end{align}
 \begin{align} \mathcal{P}_{\textit{uc}}^{(c)}(\boldsymbol k) & = - 2 \mathcal{A}g \sin ^2\theta \, \mathcal{E}_{\textit{cc}}(\boldsymbol k), \end{align}
 \begin{align} \mathcal{P}_{\textit{uc}}^{(b)}(\boldsymbol k) & = k B_0 \cos \phi \sin \theta {\rm Im} \left [\mathcal{E}_{bc}\right ](\boldsymbol k), \end{align}
and where
 $\mathcal{T}_{\textit{uc}}$
is the nonlinear term whose expression can be found in Briard et al. (Reference Briard, Gréa and Nguyen2024b
). Applying a time-derivative to
 $\dot {L}L = -12 \iiint \mathcal{E}_{\textit{uc}} \mathrm{d}^3\boldsymbol k$
and using (4.25) yields a buoyancy–drag equation that contains all terms, including dissipation and nonlinearities. The key information that is brought by the RA analysis of § 4.5 is that only the fraction
 $(R/3)/(1+R)$
of
 $\mathcal{P}_{\textit{uc}}^{(b)}$
acts as a buoyancy term (see (4.19)). Therefore, the reminder
 $(1+2R/3)/(1+R)$
represents drag. Eventually one gets
 \begin{align} \ddot {L} & = \underbrace {- \frac {\dot {L}^2}{L} - \frac {12}{L} \iiint \left ( \mathcal{T}_{\textit{uc}}(\boldsymbol k) - (\nu +\kappa ) k^2 \mathcal{E}_{\textit{uc}}(\boldsymbol k) + \mathcal{P}_{\textit{uc}}^{(u)} + \frac {1+2R/3}{1+R} \mathcal{P}_{\textit{uc}}^{(b)} \right ) \mathrm{d}^3\boldsymbol k }_{- C_d \dot {L}^2/L } \nonumber \\ &\quad \underbrace {- \frac {12}{L} \iiint \left ( \mathcal{P}_{\textit{uc}}^{(c)} + \frac {R/3}{1+R} \mathcal{P}_{\textit{uc}}^{(b)} \right ) \mathrm{d}^3\boldsymbol k}_{+ \mathcal{A}g C_b}. \end{align}


In figure 17, we compare the DNS results (computation of the two integrals in (4.27)) and the closure (4.23) using (4.20) for
 $C_b$
. The result is excellent in the non-magnetic case, and very satisfactory in the self-similar states for
 $B_0=0.1$
and
 $B_0=0.2$
. Hence this validates not only the closure for
 $C_d$
, but also the expression for
 $C_b$
and the assumptions made to derive it within the RA approach: namely statistical axisymmetry, the constant
 $R$
in the self-similar regime and the approximation of the Alfvèn time scale
 $(kB_0)^{-1}$
.
4.7.2. Effective mixing and irreversible mixing
If we define an effective mixing parameter as
 \begin{equation} \varTheta _{\textit{eff}} = \varTheta + (1-\varTheta ) \frac {R}{1+R}, \end{equation}
then the growth rate prediction (4.24) can be rearranged as
 \begin{equation} \alpha _{\textit{MRTI}}^\parallel = \frac {\sin ^4\gamma (1-\varTheta _{\textit{eff}})^2}{ 1+ \sin ^2\gamma (1- \varTheta _{\textit{eff}})} = \alpha _{\textit{hyd}}^{\textit{eff}}, \end{equation}
where
 $\alpha _{\textit{hyd}}^{\textit{eff}}$
is given by (4.5) using
 $\varTheta _{\textit{eff}}$
instead of
 $\varTheta$
, with
 $\varTheta _{\textit{eff}} \gt \varTheta$
for
 $R\gt 0$
. This effective mixing parameter reflects the mixing of the large scales which are not affected by magnetic tension. Its asymptotic values as function of
 $B_0$
are steady and quite increased compared with
 $\varTheta$
, as revealed in the inset of figure 18(a).
Effective mixing in the R2 simulations. (a) Growth rate
 $\alpha ^*$
of the irreversible mixing layer
 $L^*$
. The inset shows the values of
 $\varTheta _{\textit{eff}}$
defined in (4.28). (b) Spherically averaged kinetic energy
 $E_{\textit{uu}}$
, scalar variance
 $E_{\textit{cc}}$
and flux
 $E_{\textit{uc}}$
spectra for
 $B_0=0.2$
, compensated by some isotropic scalings. The thin red line is obtained with the dissipation rate
 $\varepsilon _{\textit{cc}}$
while the thick one by using the effective dissipation
 $\varepsilon _{\textit{cc}}^{\textit{eff}}$
.

This formulation (4.29) stresses that the main difference between the horizontal MRTI and the classical RTI originates in mixing, as already pointed out in figure 5(a). This is quite different from the vertical MRTI where it is the drag that is significantly increased by induced magnetic fields.
It is possible to draw further similarities between the horizontal MRTI and the classical RTI now that the protagonist, mixing, has been clearly identified. In § 3.4, the sorted concentration field
 $C^*$
was introduced, along with the ‘irreversible mixing layer’ based on it,
 $L^*=6 \int C^* (1-C^*) \mathrm{d}z^*$
. As such, one may wonder what would be the growth rate
 $\alpha ^*$
associated with irreversible mixing. We have shown in § 3.4 that
 $L^*/L \simeq \varTheta$
. It follows that the ‘irreversible growth rate’ is simply expressed as
 $\alpha ^* = \varTheta \alpha$
. It is shown in figure 18(a) that, for various
 $B_0$
, all asymptotic values of
 $\alpha ^*$
are much less scattered than
 $\alpha$
and end up around the hydrodynamic value
 $\alpha ^* \simeq 0.017$
.
These findings, regarding effective mixing and irreversible growth rate, provide further interpretation of the horizontal MRTI dynamics. Indeed, irreversible mixing has the same origin with or without magnetic fields. What differs are the production mechanisms at large scales, and the redistribution of energy between scales and kinetic and magnetic reservoirs in MHD. Hence, the increase in growth rate in the horizontal MRTI is attributed to reversible exchanges between large structures that do not mix well: these large-scale exchanges can nevertheless be interpreted as an effective mixing.
A final interpretation of the effective mixing can be provided. From the scalar variance equation (3.10a
), and using the fact that the scalar variance becomes constant in the self-similar regime, one may express the concentration dissipation rate as
 $\varepsilon _{\textit{cc}} = \varTheta \dot {L}/(6L)$
. Its effective counterpart reads
 $\varepsilon _{\textit{cc}}^{\textit{eff}} = \varTheta _{\textit{eff}} \dot {L}/(6L)$
.
The kinetic energy, magnetic energy and scalar variance spherically averaged spectra are shown in figure 18(b) for
 $B_0=0.2$
, compensated by isotropic inertial scalings. For the kinetic energy
 $E_{\textit{uu}}$
, there is a slight increase of the Kolmogorov constant from
 $\simeq 1.5$
to
 $\simeq 1.8$
; for the magnetic energy
 $E_{\textit{bb}}$
, the Iroshnikov–Kraichnan constant is
 $\simeq 1.0$
. Interestingly, for the scalar variance
 $E_{\textit{cc}}$
, the Corrsin–Obukhov constant is increased up to
 $\simeq 2.5$
, showing that some physical mechanism is missing. Using
 $\varepsilon _{\textit{cc}}^{\textit{eff}}$
instead of
 $\varepsilon _{\textit{cc}}$
in the scaling, one gets
 $\simeq 0.78$
, which is much closer to the value
 $\simeq 0.67$
obtained in the classical RTI.
4.7.3. Sensitivity to initial conditions
As observed from the beginning of this study in figure 3, very large and fast structures develop within the horizontal MRTI. Hence, one may wonder if the self-similar state is sensitive to the details of the initial perturbations. Indeed, a different distribution could result in a different dynamics, with possibly much faster bubbles.
To partially answer this question, some of the R2 DNS of table 1 were repeated a second time by changing only the random seed (note that all the R2 simulations represent a total of
 $35 \times 10^6$
hours of computer processing time). Results are gathered in table 2: whatever the value of
 $B_0$
, there is roughly a
 $10 \,\%$
variation upon the value of the growth rate when changing the random seed. Moreover, there is not a significant increase of this dispersion with larger values of
 $B_0$
. This intrinsic
 $10 \,\%$
variation remains small compared with the overall increase of
 $\alpha$
in the horizontal MRTI compared with the hydrodynamic case.
Effect of changing the initial random seed, for some of the R2 simulations, on the growth rate
 $\alpha$
.

5. Conclusion
The dynamics of the RTI is profoundly altered by induced magnetic fields, which are produced, in the idealized framework of this study, by a constant background magnetic field, parallel to the interface and of intensity
 $B_0$
.
Using a set of well-resolved DNS, that solve the Boussinesq–Navier–Stokes equations under the MHD approximation, we have observed that the mixing layer still evolves like
 $L = 2\alpha \mathcal{A}gt^2$
asymptotically, but its growth rate
 $\alpha$
is almost doubled compared with the classical RTI. The physical reason is that mixing is strongly reduced in the horizontal MRTI compared with the hydrodynamic case. Indeed, the imposed
 $B_0$
creates a cutoff wavelength below which perturbations are damped by magnetic tension. In addition of inhibiting small-scale mixing,
 $B_0$
breaks the statistical axisymmetry of the MRTI by generating bubbles stretched in the imposed magnetic field direction.
The analysis conducted raised the question of the ultimate fate of the horizontal MRTI at very large times, when the linear effects of
 $B_0$
become negligible at all scales, namely
 $L k_B \gg 1$
. Such a regime cannot be reached in DNS due to the confinement of the largest structures, but we argue that the flow may return to a ‘hydrodynamic-like’ state after a long transient. At intermediate times, when
 $L k_B \sim {O}(1)$
, the horizontal MRTI is in a QSS state where the growth rate is constant, much larger than in hydrodynamics, and all other statistics like mixing, anisotropy and induced magnetic fields are constant as well.
The main outcomes of this work are the derivation of two theoretical predictions for the growth rate in this QSS state of the horizontal MRTI. First, an upper bound (4.11a
) resulting from the analysis of the large scales: all measured
 $\alpha$
in the DNS are consistently smaller than, but close to, this upper bound. This prediction required to consider that the QSS applies to scales larger than
 $1/k_B$
, where
 $k_B=B_0/N$
separates the buoyancy-dominated scales from the MHD-dominated ones.
Second, extending the RA model (Gréa Reference Gréa2013), the expression (4.24) was derived and relates the growth rate
 $\alpha$
, the anisotropy parameter
 $\sin ^2 \gamma$
, the mixing parameter
 $\varTheta$
and the magnetic to kinetic energy ratio
 $R$
. This analytical relation was successfully assessed for a wide range of parameters (the acceleration
 $g$
, the mean field
 $B_0$
, diffusion coefficients
 $\nu$
,
 $\kappa$
,
 $\eta$
and initial condition peak wavenumber
 $k_p$
). To obtain this prediction (4.24), the constancy of
 $R$
, statistical axisymmetry, and a characteristic Alfvèn time scale independent of the wavenumber were assumed in the quasi-self-similar regime. These assumptions were a posteriori verified by comparing the modelled expressions (4.20) and (4.23) for
 $C_b$
and
 $C_d$
, respectively, with DNS. In particular, the RA informs us on which fraction of the magnetic tension (coming from the magnetic flux in the scalar flux equation) acts on buoyancy and drag. Further discussions highlight the relevance of considering an effective mixing at large scales.
In conclusion to both Briard et al. (Reference Briard, Gréa and Nguyen2024b
) and the present work, changing the orientation of the mean magnetic field
 $B_0$
profoundly modifies the flow evolution, the degree of mixing, the level of induced magnetic energy and the growth rate of the mixing layer: the dynamics of the horizontal MRTI is nothing alike the vertical MRTI.
Supplementary movies
Supplementary movies are available at https://doi.org/10.1017/jfm.2025.10818.
Declaration of Interests
The authors report no conflict of interest.
Appendix A. Detailed calculations and equations
A.1. Equations for the fluctuating fields
Starting from the system of (2.1), one ends up, after some algebra, with the equations for the fluctuations, with no mean parts for the velocity and magnetic fields (other than
 $B_0$
)
 \begin{align} \frac {\partial u_i}{\partial t} + \frac {\partial u_{\!j} u_i}{\partial x_{\!j}} & = - \frac {\partial \varPi }{\partial x_i} - 2 \mathcal{A} g c \delta _{i3} + \frac {\partial b_i b_{\!j}}{\partial x_{\!j}} + B_0 \frac {\partial b_i}{\partial x_1} + \frac {\partial }{\partial x_3} \langle u_i u_3 - b_i b_3 \rangle + \nu {\nabla} ^2 u_i, \end{align}
 \begin{align} \frac {\partial b_i}{\partial t} + \frac {\partial u_{\!j} b_i}{\partial x_{\!j}} & = \frac {\partial b_{\!j} u_i}{\partial x_{\!j}} + B_0 \frac {\partial u_i}{\partial x_1} + \frac {\partial }{\partial x_3} \langle u_3 b_i - u_i b_3 \rangle + \eta {\nabla} ^2 b_i, \end{align}
 \begin{align} \frac {\partial c}{\partial t} + \frac {\partial u_{\!j} c}{\partial x_{\!j}} & = - u_3 \frac {\partial }{\partial x_3} \langle C \rangle + \frac {\partial }{\partial x_3} \langle u_3 c \rangle + \kappa {\nabla} ^2 c, \end{align}
where
 $\varPi = p + (b_{\!j} b_{\!j} - \langle b_{\!j} b_{\!j} \rangle )/2$
is the generalized pressure, and
 $p=P-\langle P \rangle$
the fluctuating reduced pressure. These equations are similar to the ones derived in Briard et al. (Reference Briard, Gréa and Nguyen2024b
) for the vertical MRTI, except for the terms depending explicitly on
 $B_0$
.
Since we are interested in deriving equations for the large scales in the RA framework, we further consider that the turbulence is fully developed and homogeneous in the three directions. Therefore, spatial derivatives like
 $\partial _{x_3}\langle \star \rangle$
of second-order correlations vanish in (A1). Going to the spectral space, one finally obtains
 \begin{align} \frac {\partial \hat {u}_i}{\partial t} + \nu k^2 \hat {u}_i & = - \mathrm{i} P_{ipq} \big(\widehat {u_p u_q} - \widehat {b_p b_q} \big) - 2 \mathcal{A} g \hat {c} P_{i3} + \mathrm{i} k_1 B_0 \hat {b}_i, \end{align}
 \begin{align} \frac {\partial \hat {b}_i}{\partial t} + \eta k^2 \hat {b}_i & = \mathrm{i} k_l \left ( \widehat {b_l u_i} - \widehat {b_i u_l} \right ) + \mathrm{i} k_1 B_0 \hat {u}_i, \end{align}
 \begin{align} \frac {\partial \hat {c}}{\partial t} + \kappa k^2 \hat {c} & = - \mathrm{i} k_l \widehat {u_l c} - \big(\hat {u}_3 * \widehat {\partial _{x_3} \langle C \rangle }\big)(\boldsymbol k), \end{align}
where
 $*$
is the convolution product,
 $P_{\textit{ij}}=\delta _{\textit{ij}}-k_i k_{\!j}/k^2$
the spectral projector onto the plane perpendicular to the wavevector
 $\boldsymbol k$
,
 $P_{ipq} =(k_p P_{iq} + k_q P_{ip})/2$
its symmetric counterpart, and with the complex number such that
 $\mathrm{i}^2=-1$
. In the homogeneous limit, the last right-hand side term of (A2c
) is expressed as
 $\hat {u}_3/L$
.
A.2. Large-scale equations for spectral second-order correlations
The equations of system (A2) are finally combined to build the evolution equations of the spectral densities defined in § 4.4. Hereafter, we do not express the nonlinear and dissipation terms since they are discarded when considering the large-scale dynamics. Still, the interested reader will find them in Briard et al. (Reference Briard, Gréa and Nguyen2024b ).
The evolution equations read
 \begin{align} \frac {\partial \mathcal{E}_{\textit{uu}}}{\partial t} & = - 4 \mathcal{A}g \mathcal{E}_{\textit{uc}} \sin ^2 \theta - 2 k_1 B_0 {\rm Im} \left [\mathcal{E}_{\textit{ub}} \right ]\!, \end{align}
 \begin{align} \frac {\partial \mathcal{E}_{\textit{uc}}}{\partial t} & = -2 \mathcal{A}g \mathcal{E}_{\textit{cc}} \sin ^2 \theta - \frac {1}{L} \mathcal{E}_{\textit{uu}} - \mathrm{i} k_1 B_0 \mathcal{E}_{bc}, \end{align}
 \begin{align} \frac {\partial \mathcal{E}_{\textit{cc}}}{\partial t} & = -\frac {2}{L} \mathcal{E}_{\textit{uc}}, \end{align}
 \begin{align} \frac {\partial \mathcal{E}_{\textit{bb}}}{\partial t} & = + 2 k_1 B_0 {\rm Im} \left [\mathcal{E}_{\textit{ub}} \right ]\!, \end{align}
 \begin{align} \frac {\partial \mathcal{E}_{\textit{ub}}}{\partial t} & = -2 \mathcal{A}g \mathcal{E}_{bc}^* \sin ^2 \theta + \mathrm{i} k_1 B_0 \left (\mathcal{E}_{\textit{uu}} - \mathcal{E}_{\textit{bb}} \right )\!, \end{align}
 \begin{align} \frac {\partial \mathcal{E}_{bc}}{\partial t} & = - \frac {1}{L} \mathcal{E}_{\textit{ub}}^* - \mathrm{i} k_1 B_0 \mathcal{E}_{\textit{uc}}, \end{align}
where
 $\mathcal{E}^*$
denotes the complex conjugate of
 $\mathcal{E}$
, and where
 $k_1 = k \cos \phi \sin \theta$
. Rearranging these equations as in (4.8), injecting the decomposition
 $\mathcal{E}_{xy}(\boldsymbol k,t) = \mathcal{E}_{xy}^0(\theta ,\phi ) k^{s-2} t^{n_{xy}}$
and integrating
 $\int _0^{k_B} (\ldots ) k^2 \mathrm{d}k$
yields
 \begin{align} &\begin{pmatrix} \! n_{\textit{uu}} &\!\! 4\mathcal{A}g \sin ^2\theta &\!\! 0 &\!\! 0 &\!\! 2h /\sqrt {\alpha } &\!\! 0 \!\\\! 1/(2\alpha \mathcal{A}g) &\!\! n_{\textit{uc}} &\!\! 2\mathcal{A}g \sin ^2\theta &\!\! 0 &\!\! 0 &\!\! -h/\sqrt {\alpha } \!\\\! 0 &\!\! 1/(\alpha \mathcal{A}g) &\!\! n_{\textit{cc}} &\!\! 0 &\!\! 0 &\!\! 0 \!\\\! 0 &\!\! 0 &\!\! 0 &\!\! n_{\textit{bb}} &\!\! -2h/\sqrt {\alpha } &\!\! 0 \!\\\! -h/\sqrt {\alpha } &\!\! 0 &\!\! 0 &\!\! h/\sqrt {\alpha } &\!\! n_{\textit{ub}} &\!\! -2\mathcal{A}g \sin ^2\theta \!\!\\\! 0 &\!\! h/\sqrt {\alpha } &\!\! 0 &\!\! 0 &\!\! -1/(2\alpha \mathcal{A}g) &\!\! n_{bc} \!\\\! \end{pmatrix} \!\begin{pmatrix} \mathcal{E}_{\textit{uu}}^0 \\[4pt] \mathcal{E}_{\textit{uc}}^0 \\[4pt] \mathcal{E}_{\textit{cc}}^0 \\[4pt] \mathcal{E}_{\textit{bb}}^0 \\[4pt] \mathcal{E}_{\textit{ub}}^0 \\[4pt] \mathcal{E}_{bc}^0 \\ \end{pmatrix} \!=\! \begin{pmatrix} 0 \\ 0 \\ 0 \\ 0 \\ 0 \\ 0 \\ \end{pmatrix}\!, \end{align}
where
 $h=\sin \theta \cos \phi (s+1)/(s+2)$
. Note that the self-similar scaling of the mixing layer
 $L = 2 \alpha \mathcal{A} g t^2$
was used. The main results of solving this system are gathered in § 4.4. From dimensional analysis, it follows that
 $n_{\textit{uu}}=n_{\textit{bb}}$
and
 $n_{bc}=n_{\textit{uc}}$
; the exponents
 $n_{\textit{uu}}$
,
 $n_{\textit{uc}}$
and
 $n_{\textit{cc}}$
are determined thanks to (4.10).
Appendix B. Comparison between the vertical and horizontal MRTI
In § 3.7, qualitative comparisons between the vertical and horizontal MRTI were provided regarding mixing, anisotropy, growth rates and transition to turbulence. The interested reader will find here some quantitative comparisons between two high-resolution DNS that share the same physical and numerical parameters, except the orientation of
 $B_0$
(parallel or perpendicular to the interface), with intensity
 $B_0=0.3$
(simulation R2B30AG05 of table 1). As a reference, the corresponding hydrodynamic case is recalled as well.
Starting with the mixing layer width in figure 19(a), one recovers that there is an initial delay of transition to turbulence for the vertical MRTI, regime during which
 $L$
grows rapidly without mixing. At transition to turbulence,
 $L$
is slowed down and the self-similar growth rate is eventually much smaller than both the hydrodynamic and horizontal MRTI cases.
Effects of the orientation of
 $B_0$
for the R2 simulations: horizontal MRTI (
 $B_0^\parallel$
, blue); vertical MRTI (
 $B_0^\perp$
, red); classical RTI (
 $B_0=0$
, black). (a) Mixing zone size
 $L$
and asymptotic value of
 $\alpha$
. (b) Mixing parameter
 $\varTheta$
. (c) Anisotropy parameter
 $\sin ^2 \gamma$
. (d) Magnetic to kinetic energy ratio
 $R$
.

Effects of the orientation of
 $B_0$
for the R2 simulations on the midplane concentration probability density function
 $P_0$
: (a)
 $B_0=0$
; (b)
 $B_0^\parallel =0.3$
; (c)
 $B_0^\perp =0.3$
.

For
 $\varTheta$
in figure 19(b), the overall mixing can be slightly increased in the vertical MRTI, whereas it is significantly decreased in the horizontal MRTI compared with hydrodynamics.
Regarding anisotropy in figure 19(c), the structures are indeed more vertically stretched in the vertical MRTI, with very large transient values. The transient is quite different in the horizontal MRTI with a decrease of
 $\sin ^2 \gamma$
due to the flattening in the
 $B_0$
direction.
Finally, the magnetic to kinetic energy ratio
 $R$
reaches much larger values in figure 19(d) for the horizontal MRTI compared with the vertical MRTI, which is consistent with a greater turbulence intensity.
To conclude with more visual information, the probability density function of the concentration field in the midplane,
 $P_0(C)$
, is shown in figure 20. The initial condition is the same in all cases, with a perturbed interface that gives mostly values of
 $C$
around
 $\simeq 0.5$
. Afterwards, the transient regimes start in the same fashion, with a dominance of pure fluids, with strong values of
 $P_0$
around
 $C=0$
and
 $C=1$
: the structures grow without mixing before transition to turbulence.
Then, the differences appear. In the hydrodynamic case in figure 20(a), there is a rapid transition to turbulence and once again larger values of
 $P_0$
around
 $C \simeq 0.5$
up to the self-similar regime. For the horizontal MRTI in the middle image, this is in stark contrast with dominance of pure fluids throughout the simulation. This is consistent with a lesser level of mixing due to magnetic tension that damps the small-scale shear instabilities. On the contrary, after a long transient for the vertical MRTI in the figure 20(c), one recovers a phenomenology close to the classical RTI.