


Introduction
From economics (Becker Reference Becker1957) to social psychology (Tajfel et al. Reference Tajfel, Billig, Bundy and Flament1971) and political science (Bullard Reference Bullard1990), researchers have documented inequalities between majority and minority groups. While much is known about discrimination by individuals and private firms, unequal outcomes in the implementation of public policy are less understood. In particular, most studies focus on bias against marginalised groups within social or market interactions (e.g. Oliver and Wong Reference Oliver and Wong2003; Bertrand and Mullainathan Reference Bertrand and Mullainathan2004; Banerjee et al. Reference Banerjee, Bertrand, Datta and Mullainathan2009; Kaas and Manger Reference Kaas and Manger2012; Guryan and Charles Reference Guryan and Charles2013). Although several scholars explore governments’ biases in favour of their own ethnic group (e.g. Franck and Rainer Reference Franck and Rainer2012; Posner and Kramon Reference Posner and Kramon2013), they usually focus on crossgroup disparities in broad development outcomes. Recent studies explore differential responsiveness of bureaucrats to citizen requests from different racial and ethnic groups (e.g. Distelhorst and Hou Reference Distelhorst and Hou2014; White et al. Reference White, Nathan and Faller2015; McClendon Reference McClendon2016), instead of large-scale public policies.
In response to inequality, ethnic parties around the world are advocating for the rights of their perceived coethnics (Chandra Reference Chandra2007). The notion of social “empowerment” plays a central role in contemporary debates about inclusive growth (Drèeze and Sen Reference Dreze and Sen2002; Alsop et al. Reference Alsop, Bertelsen and Holland2006). However, it remains unclear whether this kind of political mobilisation can reduce inequality in public policy implementation.
Here we explore the case of India’s “untouchables,” now known as Dalits, who were at the bottom of the hierarchy in traditional Indian society (Bayly Reference Bayly2001). In today’s rural India, caste inequality remains prevalent despite affirmative action and political representation (Banerjee et al. Reference Banerjee, Iyer and Somanathan2005; Thorat and Newman Reference Thorat and Neuman2012). For example, the 2011–2012 India Human Development Survey finds that 41% of non-Dalit rural households across the country continue to practice “untouchability,” while 38% of Dalit rural households report that they have experienced caste discrimination. Footnote 1 The Dalit population of India, estimated at over two hundred million individuals (Government of India 2013, 25), thus suffers from poor outcomes and extensive bias.
We examine the targeting of rural electrification efforts in India’s most populous state, Uttar Pradesh (UP). Access to electricity is one of the most basic and important public goods, given its importance for health, economic opportunities and overall life comfort (Khandker et al. Reference Khandker, Barnes, Samad and Minh2009, Reference Khandker, Barnes and Samad2013). With a total population of two hundred million and a low rural electrification rate of 24% in the 2011 Census of India, UP is an ideal setting for examining the distributional logic of rural electrification. In areas characterised by such high levels of energy poverty, electrification is in high demand across all social groups (Aklin et al. Reference Aklin, Cheng, Urpelainen, Ganesan and Jain2016). Thus, differences in tastes are not driving disparities across groups.
India’s national rural electrification program, the Rajiv Gandhi Rural Electrification Scheme (RGGVY), targets villages for rural electrification and thus provides an excellent opportunity to detect inequality in implementation at the community level. An exclusive responsibility of the state, rural electrification in India allows us to directly link policy implementation to the caste structure of a hundred thousand villages. Focusing on policy instead of social outcomes allows us to establish a closer link between officials’ behaviour and inequality. Moreover, given that every fifth person living in the state is from the lower castes, UP is an excellent locality to explore caste biases in public policy implication.
Drawing from 2001 and 2011 census data and the information of RGGVY implementation at the village level, we study patterns of rural electrification as a function of demographic and socioeconomic characteristics. We estimate how the proportion of the scheduled castes (SC) population – the legislative category for Dalits – affects the probability of RGGVY implementation in a village. A comprehensive analysis reveals significant evidence of inequality. Consistent across a wide range of different model specifications, we find that an increase in the share of SC population in a village of one percentage point is associated with a reduction in the likelihood of RGGVY implementation of 0.15–0.20 percentage points. The estimated effects of SC population size, in turn, explain why villages populated by Dalits have such low rural electrification rates in the 2011 census. Electric lighting is only used by 17% of the population in villages that are populated by Dalits. While our method cannot detect intentional discrimination, it offers a systematic overview of unequal, biased policy implementation in a large-scale public program of great importance for rural development.
Next, we examine whether political mobilisation curbs inequality. Both in India and elsewhere, the victims of bias have mobilised politically to fight against bias and for justice and social inclusion. In UP, the Dalits have formed their own party, the Bahujan Samaj Party (BSP) in the 1980s (Bose Reference Bose2013; Pai Reference Pai2014). After the 2002 and 2007 state elections, the BSP formed the state (coalition) government in UP. Following the literature on political alignment in distributive politics (Dynes and Huber Reference Dynes and Huber2015; Asher and Novosad Reference Asher and Novosad2017), we thus have the opportunity to study whether BSP’s electoral victories reduce the level of inequality in RGGVY implementation.
Exploiting India’s plurality electoral system and intense competition with narrow margins of victory, we conduct a regression discontinuity analysis of the effects of BSP candidates winning close elections on RGGVY implementation across the villages. Because of wide variation in the SC population share across villages within any of UP’s constituencies, we can see whether a BSP Member of Legislative Assembly (MLA) can guard his or her primary constituency – the Dalits – against weak policy implementation. The results suggest that the BSP’s electoral success has failed to protect Dalits against bias. Regardless of the share of SC population in a village, BSP electoral victories do not cause a reduction in RGVVY inequality. As a possible explanation, we show that Dalit candidates are a tiny minority outside constituencies specifically reserved for them under Indian election law. Using original data on MLA caste backgrounds, we show that outside electoral quotas for Dalits, even the BSP, prefers to use non-Dalit candidates. Thus, the BSP’s electoral success does not actually result in descriptive representation for the Dalits.
These findings offer contributions to research on ethnic and racial inequality. While discrimination against marginalised groups is a well-known phenomenon, our study sharpens the picture in several ways. First, we document inequality in a major development initiative from the world’s largest democracy. India’s rural electrification program is the largest in the world and could improve the lives of hundreds of millions, but our results suggest that these improvements are less available for weak minorities. While earlier studies have shown evidence of ethnic discrimination by legislators and bureaucrats, ours is the first to examine inequality in public policy implementation on a large scale at the community level. Furthermore, we also find that policy discrimination on its own is substantially large. Our robustness checks also rule out alternative explanations, such as Dalits lagging behind in electrification due to poverty or a lack of capacity for collective action.
Equally important is our finding on the ineffectiveness of political mobilisation. While we must exercise due caution in generalising our null result, it is notable that a major political party with the mandate to protect the rights of a particular minority group is unable to do so even in the context of a governmental development initiative. This result contrasts with theories that emphasise the importance of ethnic representation for material outcomes, such as Chandra’s (Reference Chandra2007) “head counts” approach to ethnicity in electoral politics. The result also suggests that although descriptive representation of Dalits may reduce individuals’ “discriminatory intentions” at the local level (Dunning and Nilekani Reference Dunning and Nilekani2013; Chauchard Reference Chauchard2014) and electoral quotas increase pro-Dalit public spending (Pande Reference Pande2003), the electoral success of Dalit-oriented parties may produce disappointing results unless they actually unleash a wave of descriptive representation in the state legislatures. In closely related research, Min (Reference Min2015) reports a positive relation between BSP representation and the supply of electricity to villages in UP at election time. In contrast, our focus is on inequality over policy implementation. We show that the benefits of BSP’s electoral success in the context of India’s most important rural electrification program have been limited. Our result raises doubts about the BSP’s ability to promote Dalit interests in rural development.
Inequality in public policy implementation
Studies have provided robust evidence for discrimination, bias, and inequality in human society. Tajfel et al. (Reference Tajfel, Billig, Bundy and Flament1971) offer experimental evidence of “in-group bias,” as individuals treat their peers from the same group favourably. Likewise, governments may favour individuals that belong to their group, whether it is for opportunistic or psychological reasons (e.g. Franck and Rainer Reference Franck and Rainer2012; Posner and Kramon Reference Posner and Kramon2013; McClendon Reference McClendon2016). In-group bias, however, is not the only form of discrimination. The flip side of the coin is social exclusion (Thorat and Newman Reference Thorat and Newman2007), which refers to individuals’ tendency to marginalise a particular racial and ethnic group. Resentment may be driven by “taste” or by “statistical” cues (Becker Reference Becker1957; Arrow Reference Arrow1998). Those responsible for carrying out and sustaining discrimination in the society do not necessarily belong to a well-defined and cohesive social group but involve multiple groups.
The literature on racial politics in the United States has contributed by showing the predicaments of racial minorities across a wide range of transactions in the private sector, such as car dealings (Ayres and Siegelman Reference Ayres and Siegelman1995) and housing sales (Yinger Reference Yinger1997). Previous studies have also shown varieties of bias against particular minority groups through wage differentials and preferential hiring in the labour market (e.g. Lovell Reference Lovell1993; Bertrand and Mullainathan Reference Bertrand and Mullainathan2004; Kaas and Manger Reference Kaas and Manger2012; Guryan and Charles Reference Guryan and Charles2013).
Scholars of institutionalised racism focus on discrimination in public life. Researchers have documented how discrimination shapes U.S. court verdicts and law enforcement (e.g. Alesina and Ferrara Reference Alesina and La Ferrara2011; Chen Reference Chen2013; Sen Reference Sen2015). Recent experimental work has also demonstrated that elected representatives and public officials often behave differently based on the race of their constituencies. Butler and Broockman (Reference Butler and Broockman2011) find that state legislators, regardless of their party affiliations, tend to be less responsive to African American constituencies. Likewise, White et al. (Reference White, Nathan and Faller2015) find that local election administrators in the US are less likely to reply to requests from putative Latino names and are more likely to provide poor information about voter ID laws. Einstein and Glick (Reference Einstein and Glick2016) uncover evidence for the lack of respectful treatment towards Hispanics by government officials.
The studies mentioned above identified patterns of social exclusion in individual citizen–bureaucrat interactions. Our aim and contribution are different. We examine whether and how a large-scale infrastructure program is biased against a low-status minority, the Dalits, in India (Deshpande Reference Deshpande2000). Access to public goods varies enormously within the country (Spears and Lamba Reference Spears and Lamba2013). Existing studies have mostly focused on examining the pattern and practice of social exclusion based on interpersonal communication, including the interactions between politicians, government officials and minority citizens. For instance, in the Indian context, Bros and Couttenier (Reference Bros and Couttenier2010) show how private violence against Dalits is related to access to water. Few existing studies seek to uncover inequality in large-scale public programs, despite the fact that studies have established inequality in access.
Background and context
We now describe the context of our assessment: caste inequality in a national program of rural electrification in UP.
Rural electrification in India and RGGVY
When India gained independence in 1947, electrification was limited to a small number of urban areas (Kale Reference Kale2014). Over time, the need to electrify pumpsets to extract groundwater for the high-yield plant varieties introduced under the agricultural green revolution enabled rural electrification (Smith and Urpelainen Reference Smith and Urpelainen2016). And yet, according to the 2001 census of India, only 44% of rural households used electricity as their primary source of lighting.
In India, the governance of the electricity sector is a “concurrent” subject, with both the central and state governments having policy authority. While electricity distribution companies are controlled by state governments, except under privatisation in Odisha and the capital city of Delhi, the central government is also authorised to initiate schemes to promote rural electrification. This multilevel governance structure is essential to understanding how the RGGVY is implemented.
Launched in April 2005 by Dr. Manmohan Singh’s (Indian National Congress) central government, the goal of the RGGVY was to increase the rate of rural electrification across India. At the initiation of the RGGVY, the government announced that the “scheme has been launched to fulfill the commitment of the National Common Minimum Programme (NCMP) of completing the household electrification in next 5 years and modernising the rural electricity infrastructure.” Footnote 2
In the RGGVY, the central government provides a 90% capital subsidy for the electrification of villages; the remainder is provided by the national Rural Electrification Corporation as a soft loan. While the RGGVY is a village electrification scheme, households living below the official poverty line are guaranteed free electric connections. State governments can apply for the funds, provided they agree to implement the scheme according to the guidelines set by the central government. Until 2007, only habitations (subvillage units) with more than 300 people according to the 2001 Census were eligible; at that time, the population floor was decreased to 100 (Burlig and Preonas Reference Burlig and Preonas2016). While all villages qualify for the electrification subsidy regardless of socioeconomic status, RGGVY also gave households below the national poverty line a free household connection.
The actual selection of villages and habitations for RGGVY implementation is the responsibility of district-level administrative and technical officials, such as the Chair of District Council (Zilla Parishad), District Magistrate (or Collector) and Electricity Engineers. They work closely with their respective MLAs and Block Development Officers. In India, district-level officials enjoy a lot of discretion in implementing poverty alleviation programs introduced by the central government in Delhi. Focusing on the Employment Assurance Scheme (EAS), Corbridge et al. (Reference Corbridge, Williams, Srivastava and Véron2005) find that district-level officials often revise the details of implementation and collaborate with MLAs to screen eligible recipients for political reasons.
As a result, village selection under RGGVY similarly provides politicians ample opportunity to target the policy according to their own preferences. Footnote 3 The formal rules specifically encourage RGGVY implementation to consider the special needs of the Dalits: “[b]asic infrastructure such as distribution transformer and distribution lines is provided in the inhabited locality as well as the Dalit basti/hamlet where it exists” (Ministry of Power 2013, 3).
The RGGVY has achieved its goal of rapid rural electrification (Aklin et al. Reference Aklin, Cheng, Urpelainen, Ganesan and Jain2016; Burlig and Preonas Reference Burlig and Preonas2016). By the end of the financial year 2012, the program had reached a total of 104,496 unelectrified villages and another 248,553 previously electrified villages for intensification – that is, more than one-half of all villages in India. Within villages, 19.5 million households living below the official poverty line were electrified. As Burlig and Preonas (Reference Burlig and Preonas2016) show, the RGGVY has not had large economic effects in targeted villages, but it has significantly increased electricity access.
In UP, a May 2012 assessment of program implementation showed that 27,770 nonelectrified villages were electrified and 2,982 electrified villages saw improvements through intensive electrification by the end of 2011 across 63 districts. Compared to a goal of 32,118 villages set by the state government, the achievement rate was thus 96%. At the same time, the number is very low relative to the total number of villages in the state: according to the 2011 Census of India, UP had 106,773 villages. Based on our analysis, 96,557 of these villages were inhabited (Indian census also includes abandoned villages in the total number). Thus, only about 31% of all UP villages saw RGGVY implementation by the time of the assessment even though almost all villages in the state perform poorly with regard to electrification: the average household electrification rate in a typical UP village in the census was only 23%. Footnote 4
Caste inequality in India
Scholars have documented persistent patterns of social bias in India against both religious minorities, such as Muslims and Christians (Hasan Reference Hasan2009), and against Dalits (SC) (Bayly Reference Bayly2001; Louis Reference Louis2003; Kapur et al. Reference Kapur, Prasad, Pritchett and Babu2010; Thorat and Newman Reference Thorat and Neuman2012). In the case of Dalit discrimination, some members of the upper caste groups consider their low-caste counterparts socially inferior. As Thorat and Lee (Reference Thorat and Lee2005, 4198) note, for example, shopkeepers belonging to upper castes may refuse to trade with Dalit customers “until they have hung cloth screens in a place to ‘protect’ themselves from the polluting presence of the ‘untouchables’.” Experimental audit studies from Indian labour markets show that Dalits often face obstacles in finding employment (Banerjee et al. Reference Banerjee, Bertrand, Datta and Mullainathan2009). These results highlight the fact that caste bias remains common in India, as higher castes often hold negative attitudes towards the lower castes and refuse to engage in social or economic exchange with them. Tolerance of discrimination remains widespread across large segments of the population (e.g. Shah et al. Reference Shah, Mander, Thorat, Deshpande and Baviskar2006; Kapur et al. Reference Kapur, Prasad, Pritchett and Babu2010; Ramaiah Reference Ramaiah2011).
Caste inequality can take at least three forms (Shah et al. Reference Shah, Mander, Thorat, Deshpande and Baviskar2006). First, physical exclusion, the most common form of untouchability, involves members of upper castes who refuse and avoid contact with those from the SC through residential segregation and denials of commercial exchanges and services, food sharing and water distribution (e.g. Bros and Couttenier Reference Bros and Couttenier2010) and access to public facilities. Next, untouchability also involves public humiliation, as dominant castes restrict the Dalits from using vehicles, smoking, or even holding their wedding processions. Finally, upper castes have also economically exploited the Dalits by blocking the Dalits from certain employment opportunities (e.g. Siddique Reference Siddique2011) and underpaying them. Here we examine these patterns of caste inequality in the case of the RGGVY, a large-scale public policy financed by the central government and implemented by the state governments.
Despite the government’s various legal and policy efforts to eradicate caste bias, untouchability remains widespread in India, especially in the rural areas. Even worse, recent years have seen the emergence of collective, organised violence targeting the SC who seek to assert their rights (Chauchard Reference Chauchard2017). In several cases, “these atrocities took place” because local elites aim to maintain their dominance and privilege in the face of increasing economic competition from the Dalits (e.g. Sharma Reference Sharma2015).
Although caste inequality in the society and the private sector has been carefully documented, including with experimental methods that can identify causal effects, it remains unclear whether a bias remains in public policy itself. Thorat and Lee (Reference Thorat and Lee2005, 4198) use survey data from 531 villages in five states to show that “patterns of exclusion and caste discrimination … afflict, if not overwhelm, the government India’s mid-day meal scheme.” However, it remains unclear whether such patterns reflect policy implementation by the government or, alternatively, the social behaviour of the people who use or prepare mid-day meals in Indian schools.
Solutions to the problem of caste inequality have proven elusive. In India, the most important national policies against caste bias are educational, employment and representation “reservations” (Jaffrelot Reference Jaffrelot2006; Bhavnani Reference Bhavnani2017), which guarantee both the SC and scheduled tribes (adivasis) a certain percentage of admissions to public institutions of higher learning, government jobs and seats in different political bodies from village councils (gram panchayats) to state legislative assemblies and the national parliament. However, it appears that these reservations have not effected a social revolution: the evidence on the socio-economic effects of reservations suggests that they are weak (Jensenius Reference Jensenius2015), though they have contributed to policy changes and political mobilisation (Pande Reference Pande2003; Jaffrelot Reference Jaffrelot2006).
Caste inequality in rural electrification
Rural electrification can contribute to caste inequality in UP through several channels. Because the RGGVY program design allows state governments, district-level officials and MLAs to decide on the targeting of RGGVY implementation at the village level, the national program has a lot of scope for inequality at the implementation stage despite formal rules that base implementation on need. Therefore, examining RGGVY offers an opportunity to detect bias in public policy implementation. In turn, bias in implementation feeds inequality when it is done in way that further weakens groups (such as SCs) that are already marginalised.
The goal of the RGGVY was to electrify as many villages as possible, and villages themselves did not have to do anything to request RGGVY implementation, and in fact lacked lobbying power to make demands (Prayas Energy Group 2011, 27). As per the 2006 National Rural Electrification Policy of India (Ministry of Power 2006), village heads (pradhans) and councils (gram panchayats) only had an advisory and supervisory role in RGGVY implementation. Field research conducted by Greenpeace, an environmental nongovernmental group, finds that fewer than 10% of villagers in Madhubani district, Bihar, were aware of RGGVY even though their village was electrified under the scheme (Greenpeace, n.d.). Indeed, a large-scale survey of six North Indian states reveals that fewer than 50% of village heads had heard of RGGVY in 2014, after a decade of implementation (Aklin et al. Reference Aklin, Cheng, Ganesan, Jain and Urpelainen2016). This basic lack of awareness suggests limited interest or ability in participating in the policy formulation process, which is not surprising given the limited authority of local government in this area.
This feature of the RGGVY is useful for us, as it ensures we cannot empirically conflate bias against lower castes with less vocal demands or less effective collective action by the SC. Given that the RGGVY is a top-down program that does not condition eligibility on active demands by villages, any bias against SC can be attributed to bias by government officials. Moreover, this feature of the RGGVY also ensures that a bias against SC in RGGVY implementation cannot be attributed to logrolling: given the RGGVY rules, communities cannot expect to gain access to other public services by forgoing electrification. The RGGVY is not part of a menu of options for villages, but rather a standalone program.
The first mechanism of bias in policy implementation is the choice of villages. According to RGGVY rules, states are allowed to choose the targeting of districts. With the average district in UP having about three million people, however, this administrative unit is too large for biased implementation: every district in UP has large numbers of both Dalit and non-Dalit communities. There is little scope for inequality in the selection of districts.
Within districts, however, local officials play a key role. The RGGVY rules state that the selection of villages remains in the hands of “the respective States/DISCOMs [electricity distribution companies] based on field survey while preparing Detailed Project Reports” (Ministry of Power 2013, 7). Because the distribution companies in UP are state-owned, they create ample opportunities for political and bureaucratic control (e.g. Wade Reference Wade1985; Iyer and Mani Reference Iyer and Mani2012). MLAs, who compete for office in constituencies that are smaller than districts, have both formal authority over the selection of local officials, such as the powerful Block Development Officers, and informal power through their popular support and networks of connections. A comprehensive assessment of the RGGVY itself in UP notes that (i) the local district-level planning leaves a lot to be desired and that (ii) state-level officials lack the capacity to properly assess the resulting plans (IRADe 2013, 54–55), suggesting ample scope for biased implementation by local politicians. We argue, therefore, that RGGVY’s inequality potential is found at the district and electoral constituency level. Due to their political power, connections and ability to shape the careers of bureaucrats, MLAs can influence village selection for the RGGVY within their own electoral constituency.
Indeed, Section 6 of the Rural Electrification Policy of 2006 further mandates the formation of a district committee for rural electrification, with inter alia elected representatives from the district as members (Ministry of Power 2006). Specifically, the committees are chaired by the district panchayat’s chair, the district planning committee’s chair or the district collector. Other members include district-level government agencies, consumer associations and “other important stakeholders.” This setup gives the committee chair, who must be an elected official or a high-level bureaucrat, ample scope to select his or her preferred members, as there are no specific rules to ensure broad representation. Moreover, since elections are in India hold only every five years, the elected chairpersons have a long period of time to direct rural electrification to their preferred direction.
The role of the committees is to “to coordinate and review the extension of electrification in each district, to review the quality of power supply and consumer satisfaction and to promote energy efficiency and its conservation” (Ministry of Power 2009, 35). By participating in this committee and influencing its work, the MLA has potential for shaping the allocation of electrification works across villages. As politicians and bureaucrats work together to select villages for RGGVY implementation, they can use census lists and other data sources to identify villages for preferential implementation at the expense of others. By using this information, the local administration can thus channel RGGVY resources to the electrification of non-Dalit communities – if it so prefers. Footnote 5
The logic of local inequality in village selection is also facilitated by the role of Members of State Assembly (MLAs) as “fixers” in their electoral constituencies (Chopra Reference Chopra1996; Jensenius Reference Jensenius2015). In India, the typical MLA actually spends very little time in the state capital in legislative debates and instead mostly focuses on serving the people in his or her constituency. Thus, the MLAs have a strong local presence and can influence village selection. Most MLAs spend their time in their own constituencies and thus have easy access to the district-level officials who are selecting villages for electrification.
Political mobilisation against caste inequality
Frustrated with the low pace of change, the Dalit population has mobilised politically against caste inequality (Mendelsohn and Vicziany Reference Mendelsohn and Vicziany1998; Duncan Reference Duncan1999; Jaffrelot Reference Jaffrelot2003; Jaoul Reference Jaoul2006; Jeffrey et al. Reference Jeffrey, Jeffery and Jeffery2008; Singh Reference Singh2017). Political parties are central players in Indian politics. They deliver goods for both the general public and particular interests (Chhibber and Nooruddin Reference Chhibber and Nooruddin2004; Dunning and Nilekani Reference Dunning and Nilekani2013; Kruks-Wisner Reference Kruks-Wisner2018). And they tend to respond to their core supporters’ demands, which makes representation crucial to obtain favourable public policies. This is particularly true for parties that are closely associated to a particular ethnic or social group (Chandra Reference Chandra2007). Inequality-reducing policies, in turn, necessitate strong electoral mobilisation.
Political activists such as Kanshiram and Mayawati have created their own political party, the BSP, and achieved electoral success in UP (Duncan Reference Duncan1999). While the developmental achievements of the BSP remain unclear, scholarship shows that it has empowered the Dalit population to become politically active and vocal (Duncan Reference Duncan1999). Describing the experience of one Dalit village with Mayawati’s program of constructing statues of Dr. Ambedkar, Jaoul (Reference Jaoul2006, 198) notes that “[t]o these villagers, installing a statue was a daring act that cashed in on the new power equation. It gave shape to their new status, enacting a political change that would otherwise remain beyond the realm of local reality.” On the other hand, Mehrotra (Reference Mehrotra2006, 4261) notes that “[s]ymbolic acts of defiance of the established ‘manuvadi’ order have indeed been dominant in UP, without much tangible benefits for the poor and the oppressed to show for it.”
The ideology and strategy of the BSP shed light on why and how the party’s politicians might be able to reduce inequality: “Although the BSP believes in total transformation, i.e., destruction rather than reform of the Hindu social and political order, this revolution is to take place not through social upheaval, but the ballot box … the first past the post system makes it possible for [Dalits] to come to power, and thereby seize power from within” (Pai Reference Pai and Lal2001, 62). Where the BSP wins an electoral seat, the local MLA can act to reduce inequality in several ways.
First, as noted above, the selection of villages within districts is a local process. In his or her own electoral constituency, a BSP MLA can exercise an influence on the selection of villages through contacts with the district committees that officially select villages. The MLA can also influence the selection of households within gram panchayats – India’s rural local governments, often comprising several villages – and thus ensuring that villages/habitations with Dalits are adequately covered. Finally, the MLA can also monitor the rural electrification process and report perceived bias to the state government.
A BSP MLA can also support rural electrification through complementary programs. One of the BSP’s key programs for Dalit empowerment has been the Ambedkar Villages Program (AVP), which channels state development funds into villages with a high percentage of Dalit population (Pai Reference Pai2004, 1145–1146). A BSP MLA can use AVP resources to support rural electrification and thus ensure that RGGVY implementation in Dalit villages succeeds.
Against these predictions, there are also reasons to be skeptical about the effect of electing particular MLAs. Corrupt, inexperienced, isolated or ineffective MLAs will hardly be able to counterbalance the effects of discrimination. These forces could neutralise the benign effect of representation.
During our study period, the UP state government was at times led by BSP. The BSP’s leading politician, Mayawati, had intermittently served as the state chief minister in the 1990s and then again from May 2002 to August 2003, after which BSP lost power because its coalition partner, the national Bharatiya Janata Party (BJP), withdrew. In 2007, BSP won an absolute majority in the state elections with a new electoral strategy that invited non-Dalits to support the BSP.
The BSP’s attempt to form coalitions with other parties raises questions about the party’s commitment to lower-caste empowerment. As Pai (Reference Pai and Lal2001, 63) explains, however, “[t]he BSP has tried to justify its alliances with upper caste parties since the mid-1990s, as not constituting a shift from its path of Dalit justice and upliftment but as short-term strategic alliances … capturing political power by any means is both necessary and justified in the case of a Dalit party in UP as without it social transformation is impossible.” Indeed, in the 2009 general election of India, the only caste group in UP that voted for BSP in the majority were the SC, both the jatav caste, which has historically been the key BSP constituency since its establishment, and other subcastes in the SC (Pai Reference Pai2014, 157). Despite the BSP’s alliances with non-Dalit political forces, the core voters of the party during our study period were the SC – all other social groups in UP favoured other political parties.
In sum, we expect policy discrimination that may or may not be mitigated by political mobilisation. Before turning to the analysis, we highlight some of the scope conditions for our argument. Our theoretical framework applies to situations in which (a) group antipathy is widespread, (b) one group is politically weaker than others, (c) there are few mechanisms available to the disadvantaged group to correct uneven policy implementation (e.g. easy access to courts or media). The effect of political mobilisation itself is contingent on the efficacy of parliamentary action, the willingness of politicians to monitor and exert pressure if they disagree with policy implementation. We believe that this model can be adapted to study other policy areas.
Caste inequality in the RGGVY: research design
To assess the magnitude of caste inequality in public policy and the effectiveness of political mobilisation, we focus on the implementation of the RGGVY in UP. The unit of analysis is a census village
 ${(N = 96,557)}$
. For each village, the 2011 Census of India provides information about the percentage of schedule castes (SC) in the population. Caste inequality can be identified if the SC percentage is strongly and negatively associated with the probability of rural electrification.
Footnote 6
Let
 $i$
denote a village within an electoral constituency
 $j$
. To measure caste inequality, we estimate the following equation:
 $${{Y_{ij}} = \alpha + \beta {\rm{S}}{{\rm{C}}_{ij}} + {\bf{X}}_{ij}^{'} \gamma + {\epsilon}_{ij}}$$
where
 ${Y_{ij}}$
is a dependent variable (household electrification rate or RGGVY program implementation status),
 $\alpha $
is a constant, SC is the percentage of the total village population that belongs to the SC category, X is a vector of control variables and ε is the error term. In some models, we replace the constant with electoral constituency
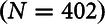 ${(N = 402)}$
fixed effects to maintain a sharp focus on local variation across villages within the same electoral unit. Standard errors are clustered by constituency throughout. The coefficient
 $\beta $
should be negative if caste inequality is a reality. The models are estimated with least square, though our results regarding RGGVY implementation remain stable using a logit model (Table A36 in Supplementary Material).
Dependent variable: RGGVY implementation
The primary dependent variable is a binary indicator for RGGVY implementation in a village. The Rural Electrification Corporation of India monitors the implementation of the RGGVY, and we use their master database as of October 2014. Footnote 7 The database is a list of villages that have been electrified under the RGGVY. While the database does not contain comprehensive or reliable data for the exact timing of village electrification, it provides us with a crosssection of RGGVY implementation three years after the 2011 Census of India. For every village in UP, we thus know whether RGGVY was implemented in it within approximately a decade of the initiation of the program, between April 2005 and October 2014.
To quantify the consequences of caste inequality, we also exploit village-level data on the percentage of households with grid electricity access. We thus repeat our main analysis but replace the RGGVY implementation indicator with the share of electrified households. We expect this share to be lower when the percentage of SC people is high at the village level. Footnote 8
Note that access to the grid does not mean that households benefit from reliable electricity. Several studies have highlighted problems related to low hours of electricity actually available (e.g. Aklin et al. Reference Aklin, Cheng, Urpelainen, Ganesan and Jain2016). As a result, access to the grid does not necessarily mean that households benefit from abundant electricity. This being said, we believe that modelling connections (rather than, say, hours of electricity) make sense give our research interest. Electricity supply (i.e. hours) mostly varies across districts and subdistricts, as opposed to villages, because officials have no direct control over whether any particular village under a certain feeder receives electricity or not. Connections to the grid, on the other hand, are more immediately controllable by officials. In fact, analysing hours of electricity offers us the opportunity to run a placebo test: we would not expect the share of SC to affect supply for the reasons we stated. And indeed, this is what we find (Table A29 in Supplementary Material). Footnote 9
Explanatory variable: scheduled caste population
The primary explanatory variable is based on the SC population of the village. The 2011 Census of India provides both the total population and the SC population of every village in UP, and we can thus compute the percentage of SC population in the village. The results remain very similar with Census data from 2001 (Table A34 in Supplementary Material). Figure A3 in Supplementary Material demonstrates the considerable variation across villages in SC population. The average SC percentage in our dataset is 24.6%. In Figure 1, we show the geographic distribution of RGGVY implementation (share of villages electrified under RGGVY) and SC share (0–1 scale) across UP electoral constituencies. In the empirical analysis, we use constituency fixed effects to ensure that geography does not bias our estimates. In Table A35 in Supplementary Material, we show that the results remain qualitatively the same when allowing the share of SC to be quadratic.
Geographic distribution of RGGVY implementation and SC share by electoral constituency.

Control variables and split samples
We control for a select set of variables that could influence both the SC population percentage and the probability of RGGVY implementation. Section A1 in Supplementary Material presents the variables in greater detail. For each control variable, we also explain why it is not a “bad control” in that it would be influenced by SC population (Angrist and Pischke Reference Angrist and Pischke2009). For summary statistics, see Table A2 in Supplementary Material.
We begin with the logarithmised distance between the village and the nearest town. Because all towns in UP are now electrified, the cost and ease of implementing rural electrification works in nearby villages is much lower than the cost of such works in faraway villages. Next, we control for earlier village-level electrification status, as per the 2001 Census of India. Obviously, the status of village electrification in 2001 is a strong predictor for the need for RGGVY. We also control for the logarithmised population of the village. Larger villages tend to have higher electrification rates to begin with, so they may not need the RGGVY. Because RGGVY implementation requires infrastructure, we also control for the presence of a paved road. We include electoral constituency fixed effects in some models. These fixed effects allow us to compare villages close to each other and sharing similar political histories. It also helps us rule out competing explanations for our findings, such as those based on UP’s location with respect to national electricity sources.
Finally, we control for wealth-related confounders in Table A30 in Supplementary Material. One possible source of bias could be that wealthier villages, which tend to have lower SC shares, either have less need for electrification or are electrified first for economic gains. Poverty could thus be simultaneously correlated to policy implementation and SC presence, making our main estimates spurious. While controlling for wealth is difficult because of possible posttreatment bias, we can use data from the pre-RGGVY period to this effect. From the 2001 census, we include an index of wealth built on the share of the population that owns assets such as TVs, cars, radios and so forth (Filmer and Pritchett Reference Filmer and Pritchett2001). We also include other wealth proxies such as the village literacy rate (%), the number of cooperative banks and the (logarithmised) area of irrigated land. We also control for average nighttime luminosity from 1995 to 2004 using NOAA satellite data (further disaggregation by hamlet is not feasible due to data constraints). Our results remain virtually identical, suggesting that wealth is not biasing our results.
For a more stringent test of caste inequality in policy implementation, we also split the sample by 2001 village electrification status. We first examine whether among villages electrified in 2001, the size of the SC population predicts RGGVY implementation; we then conduct the analysis for villages that were not electrified in 2001. Relatedly, we discuss the relationship between village electrification and SC population before the RGGVY begins in Section A2 in Supplementary Material. We show that while villages without Dalits had slightly lower electrification rates pre-RGGVY, this was almost entirely driven by a number of small villages without any Dalits.
Caste inequality in the RGGVY: findings
We present the main result in three parts. First, we examine whether SC population predicts RGGVY implementation. The second part replicates the analysis separately for previously electrified and nonelectrified villages. The final part digs deeper into the consequences of caste inequality.
Results from the full sample
In Table 1, we show the results for the full sample of all UP villages. The upper panel shows the pooled regressions; the lower panel shows the estimates with constituency fixed effects.
Dependent variable: RGGVY (if present, RGGVY = 100). The standard errors are clustered by constituency

Standard errors in parentheses.
*p < 0.10, **p < 0.05, ***p < 0.01.
The negative correlation between the SC percentage and RGGVY implementation at the village level is large and robust. Depending on the model, increasing the SC population by 10 percentage points (1/2 standard deviation) reduces the probability of RGGVY implementation by about two percentage points. Comparing a village populated by Dalits to one without any Dalits, the difference is thus about 20 percentage points – a massive difference, when only 31% of all villages in UP saw RGGVY implementation. The result also cannot be attributed to differences in 2001 village electrification status, as controlling for this variable makes no difference whatsoever.
When we repeat the estimation for the major regions of the state (Western, Central, Eastern and Bundelkhand), we see evidence of inequality in all four areas (Section A8 in Supplementary Material). This not only demonstrates the robustness of the main result but also shows that major differences in socio-economic characteristics do not seem to eradicate inequality. In fact, the relatively wealthy western parts and the poor Bundelkhand region have the strongest negative associations between SC share and the likelihood of RGGVY implementation.
Split samples
Table 2 shows the estimates separately for villages that were or were not electrified according to the 2001 Census of India. All models are estimated with constituency fixed effects. As the table shows, the result does not depend on prior electrification status. Regardless of whether a village was electrified in 2001 or not, increasing SC population by ten percentage points reduces the probability of RGGVY implementation by about two percentage points. Importantly, this lack of difference allows us to rule out the possibility that the positive association between Dalit population and village electrification in the 2001 Census of India would confound our estimates.
Dependent variable: RGGVY (if present, RGGVY = 100). All models estimated with constituency fixed effects. The standard errors are clustered by constituency

Standard errors in parentheses.
*p < 0.10, **p < 0.05, ***p < 0.01.
Consequences of caste inequality
In Table 3, we summarise the consequences of caste inequality by replacing RGGVY implementation with the percentage of electrified households in the 2011 Census of India. The various models reveal the cost of caste inequality to the SC population: as the SC share of a village increases by ten percentage points, the village electrification rate decreases by about 1 percentage point. Thus, a comparison of a Dalit village to one without any Dalits would thus show a difference of 10 percentage points.
Dependent variable: household electrification in 2011 (0–100 percent). The standard errors are clustered by constituency

Standard errors in parentheses.
*p < 0.10, **p < 0.05, ***p < 0.01.
We confirm these findings with survey data from Aklin et al. (Reference Aklin, Cheng, Urpelainen, Ganesan and Jain2016). Table A45 in Supplementary Material shows that Dalit households are 15 percentage points less likely to have grid electricity connections, again consistent with the notion that the lack of RGGVY implementation is hurting Dalit households.
Political mobilisation against inequality: research design
We now turn to the second part of our inquiry: can political mobilisation in UP reduce caste inequality? We conduct a regression discontinuity analysis.
Sample and model
The basic unit is now a village election (elections were held in 2002 and 2007) and the outcome a binary indicator for RGGVY implementation. The treatment is assigned at the constituency-election level: did a BSP candidate win against a non-BSP candidate by a narrow margin? We map villages into constituencies by using official delimitation lists from Jensenius (Reference Jensenius2015) that allow us to link every village in UP to a unique constituency. Footnote 10
We estimate models at the 1, 2 and 5% margin of victory. Larger bandwidths benefit from stronger statistical power, but at the cost of more potential for bias. The Imbens and Kalyanaraman (Reference Imbens and Kalyanaraman2012) test of optimal bandwidth suggest that the best margin is about 3.2, and the results also hold with this bandwidth. For discontinuity plots, see Figures A7–A9 in Supplementary Material; for additional bandwidths, see Table A20 in Supplementary Material.
Let
 $i$
denote a village,
 $j$
a constituency and
 $k$
an election period (either after 2002 or after 2007 elections). The estimation equation can be written as follows:
 $${Y_{ijk}} = \alpha + {\beta _1}{\rm{BS}}{{\rm{P}}_{jk}} + {\beta _2}{\rm{S}}{{\rm{C}}_{ij}} + {\beta _3}{\rm{BSP}}*{\rm{S}}{{\rm{C}}_{ijk}} + X_{ijk}^{'}\gamma + {{\rm{\epsilon}}_{ijk}},$$
where
 ${Y_{ijk}}$
is again the dependent variable, SC the relevant population percentage and BSP an indicator for the party’s electoral victory. The vector of control variables now includes the forcing variable, that is, the margin of victory of BSP victory (negative when BSP barely loses) in percentages of valid votes.
Footnote 11
Standard errors are conservatively clustered by constituency throughout. Because there were two elections (2002 and 2007) between the 2001 and 2011 Censuses in UP, each village appears in the dataset twice, once for each election. Footnote 12 The clustering of standard errors ensures that this procedure does not result in double-counting of observation and thus the artificial deflation of standard errors (e.g. Folke Reference Folke2014). Footnote 13
Explanatory variable
The primary explanatory variable is a BSP victory in close elections. Because BSP portrays itself as the party of the Dalits and other oppressed people, it is the primary mode of political mobilisation against caste inequality in UP. Because BSP victory can be considered quasirandom in close elections, we can use it to identify the effect of this kind of political mobilisation on inequality.
In some models, we interact the treatment with the SC percentage in a village. If BSP truly protects SC populations, then electing a BSP MLA should have a particularly large positive effect on RGGVY implementation in villages with a large SC population.
We also estimate models with a triple interaction between BSP win, SC share and an indicator for an SC-reserved constituency. This test allows us to investigate whether a BSP win has differential effects when the candidates must be from the SC. The difference might be negative if SC candidates from non-BSP are sympathetic to the plight of the lower castes; or might be positive if it ensures that the BSP MLA is actually himself or herself from a SC.
Figure A4 in Supplementary Material shows the margin of victory for each constituency election in the RDD sample (5% margin of victory). Table A9 in Supplementary Material, in turn, summarises the sample for the RDD analysis. In total, we have 235 close constituency elections when the sample is restricted to a 5% margin of victory. Finally, Table A10 in Supplementary Material compares BSP and non-BSP MLAs. As the table shows, both the candidate and constituency characteristics are mostly similar. The only exception – an unsurprising one – is that BSP MLAs tend to come from SC-reserved constituencies.
Tests of the identifying assumptions are found in Section A3 in Supplementary Material. We find balance over pretreatment covariates across samples. Similarly, following McCrary (Reference McCrary2008), we find no suspicious discontinuity, alleviating concerns about electoral fraud and other irregularities.
Political mobilisation against caste inequality: results
Table 4 shows the RDD results without the product term for heterogeneous effects depending on the village SC percentage. BSP victory has no systematic effect on the probability of RGGVY implementation. The coefficients are sometimes positive and sometimes negative, but always relatively small and never statistically significant. While lack of significance could be a statistical power issue, the confidence interval suggests a weak effect regardless. Even if the largest positive coefficients were correct, they would not offset the large difference of 20 percentage points between villages with only and no Dalits at all.
RDD analysis with BSP victory effects: 1, 2, and 5% bandwidths. Dependent variable: RGGVY (if present, RGGVY=100). The standard errors are clustered by constituency

Standard errors in parentheses.
*p < 0.10, **p < 0.05, ***p < 0.01.
In Table 5, we include the product term of BSP victory and the village SC percentage; the table is otherwise similar to the previous one. Again, we see little evidence for the positive effects of BSP electoral victories in reducing caste inequality. The coefficient for BSP victory still exhibits sign flips, and the coefficient for the product term is small and statistically insignificant. At the same time, SC percent continues to exhibit a strong negative effect on RGGVY implementation.
RDD analysis with BSP victory effects conditional on SC share: 1, 2 and 5% bandwidths. Dependent variable: RGGVY (if present, RGGVY=100). The standard errors are clustered by constituency

Standard errors in parentheses.
*p < 0.10, **p < 0.05, ***p < 0.01.
In Table A15 in Supplementary Material, we estimate the correlation between a BSP victory and RGGVY implementation in the full sample. While the coefficient is not identified, it gives us a sense of the external validity of the null result and ensures that our results are not driven by high degrees of electoral competitiveness. As the table shows, the full sample correlation is similar to the identified coefficient in the RDD: BSP victories are, again, not associated with variation in RGGVY implementation.
In Table A31 in Supplementary Material, we rule out the possibility that the BSP null result can be explained by selective targeting of core or swing voters. We examine the subset of electoral constituencies that have witnessed a BSP victory and see whether the MLA’s margin of victory conditions the association between village SC share and RGGVY implementation. We find that margin of victory is irrelevant, suggesting that the null result holds in both core and swing constituencies. This is consistent with our simple caste inequality hypothesis.
Likewise, we can rule out that electing SC representatives (in contrast to a BSP representative) does not help either. In Table A21 in Supplementary Material, we show that the RD estimates when looking at SC winners yield similarly small and insignificant estimates.
To summarise, our evidence suggests that BSP mobilisation has not reduced bias against Dalits in RGGVY implementation. Across different bandwidths and regardless of whether we condition the effect of BSP victory on SC share, there is no evidence of this kind of political mobilisation changing outcomes. Although the BSP claimed to protect Dalit interests and put together schemes such as Ambedkar villages on paper, these schemes appear not to have done anything to reduce the bias against Dalit communities in the national rural electrification program.
In Section A7 in Supplementary Material, we report the results when conditioning the interactive effect of SC share and BSP win on reservation status. Overall, we see no evidence of differential effects: regardless of whether we use split samples or a triple interaction term, BSP wins do not benefit the SC in reserved or nonreserved constituencies.
Table 6 offers a possible explanation to the conundrum. In this table, we code the caste characteristics of winning candidates in reserved and unreserved MLA constituencies. As we can see, there are virtually no SC politicians outside reserved constituencies. Thus, even where BSP wins seats, the candidates themselves are mostly not Dalits. Although the BSP presents itself as a pro-Dalit party, it relies on non-Dalit candidates unless electoral quotas force the party leaders to choose Dalit candidates.
Share of MLAs from SC background by type of constituency. The data were coded based on the caste connotation of Hindi-language family names, online sources for winning candidates and phone conversations with local journalists covering politics. The coding was done by native Hindi speakers in Lucknow, the capital of UP. In reserved constituencies, the percentages likely fall below 100% because some candidate names cannot be unambiguously ascribed to a specific caste group

Conclusion
Public policies play an important role in poverty alleviation. However, unequal policy implementation threatens to exclude vulnerable minority groups from these gains. Here we have documented widespread inequality in the implementation of India’s flagship rural electrification initiative, the RGGVY, in UP. For every additional percentage point of Dalits in the village population, the probability of RGGVY coverage decreases by 0.15–0.20 percentage points, resulting in massive differences between Dalit and non-Dalit villages. Such differences cannot be attributed to plausible alternative explanations, such as poverty or a lack of collective action. Although BSP, a Dalit party, has enjoyed considerable electoral success in UP over the past two decades, our regression discontinuity analysis also shows that this success has not reduced caste inequality. A plausible explanation for this failure is that most BSP politicians are in fact not themselves Dalits.
Our study has several policy implications. One is to highlight the limits of legislative oversight and political representation to curb discrimination. Instead, it appears that some of the problems raised here stem from the freedom that local officials have in program implementation. The freedom generated by a bottom-up approach is valuable in many settings. However, when it overlaps with social cleavages, it opens up the possibility of discriminatory policy implementation. This problem could be addressed in two steps. Ex ante, policymakers should create clear and transparent criteria that can constrain how program beneficiaries are selected. For instance, population thresholds may be used to identify who should first benefit from a program. Ex post, the government should monitor implementation at the micro level to detect discriminatory patterns. A system that rests on guidelines and aggressive monitoring might be more effective than one that depends on sometimes ineffective legislators. Of course, to be clear: this is only likely to work if policymakers do wish to limit discrimination. If they don’t, then relying on policy design to address discrimination is unlikely to achieve much.
Biased implementation of public policies presents an important research frontier. Now that inequality in society and markets has been established in numerous studies, the natural next question concerns the extent of bias in public policy and in the design of interventions to reduce such bias. The generalisability and external validity of our finding warrant further analysis, as we have focused on a specific kind of public service – rural electrification – in the context of rigid caste hierarchies and a central role of the state in policy implementation. Rural electrification itself is a common challenge across most low-income countries, while ethnic hierarchies and inequalities abound across the world. We would expect similar biases to creep into grid extension programmes in ethnically segregated societies across the world. Rural electrification through grid extension is also typically a public investment by the state, and thus particularly vulnerable to political and bureaucratic bias. What is more, electoral competition in India often revolves around religious and caste-based concerns.
Examining patterns of inequality and the effectiveness of political mobilisation in different contexts, such as privatised service delivery in the urban context or in countries with different logics of electoral competition, seems a natural extension of our approach. While community-level characteristics predict differential levels of access to electric infrastructure, such bias might not be feasible in densely populated urban contexts. Similarly, programmatic political competition between parties could allow political mobilisation to be a more effective antidote than in UP caste politics.
The results are normatively troubling. Although India has seven decades of democratic experience and a robust constitution, actual policy implementation remains biased. Even the striking electoral success of a minority party has not reduced such inequality in India’s largest state. Despite India’s progressive constitutional law and decades of antidiscrimination endeavors following independence, it appears that government policy remains de facto biased against the lower castes. If a major rural electrification program is heavily biased against Dalits, then the prospect for eradicating caste stratification and curtailing discrimination against the marginalised segments of the society – at least in the short run – are bleak.
Supplementary material
To view supplementary material for this article, please visit https://doi.org/10.1017/S0143814X20000045
Data Availability Statement
Replication materials are available in the Journal of Public Policy Dataverse at https://doi.org/10.7910/DVN/KBTHZH.
Acknowledgements
We thank the Council on Environment, Energy and Water for their contribution to this research project and MORSEL India for excellent data collection. The survey for this project was funded by the Shakti Sustainable Energy Foundation and ClimateWorks. We thank Oliver Vanden Eynde and Jacob Shapiro for sharing data on rural electrification. We thank seminar audiences at Strathclyde University, the Indian Institute of Dalit Studies and the National University of Educational Planning and Administration for helpful comments. We are also grateful to Tariq Thachil, Adam Ziegfeld and Simon Chauchard for comments.



