Experimental
Methodology
Fourteen varieties cultivated in the Punjab state of India were fingerprinted using a set of 75 simple sequence repeat (SSR) primers (Supplementary Table S1, available online only at http://journals.cambridge.org), covering all the 12 chromosomes. DNA was extracted from the leaves of 20-d-old seedlings using cetyl trimethyl ammonium bromide procedure (Saghai-Maroof et al., Reference Saghai-Maroof, Soliman, Jorgensen and Allard1984). SSR sequences were amplified through polymerase chain reaction (PCR) using primers specific for SSRs. PCR amplification was performed in 2.0 μl of 10 × PCR buffer, 3.0 μl of dNTPs (1 mM), 1.0 μl of each of the forward and reverse primers (5 M), 0.2 μl of Taq polymerase (5 units/μl), 3.0 μl of DNA (20 ng) and distilled deionized water using a thermal cycler. The PCR profile consisted of initial denaturation at 94°C for 4 min and subsequent 35 cycles each with denaturation at 94°C for 1 min, primer annealing at 55°C for 1 min and primer extension at 72°C for 1 min. Final extension step was performed at 72°C for 7 min.
Molecular analysis
Polymorphism information content (PIC) for each SSR marker was determined, following Senior et al., Reference Senior, Murphy, Goodman and Stuber1998. The similarity matrix was analyzed using NTSYS-pc Version 2.02 to produce an agglomerative heirarchical classification (Rohlf, Reference Rohlf1989) by employing unweighted pair group method using arithmetic averages. For estimating the similarity matrix, null alleles were treated as missing data to reduce the biased genetic or similarity measures (Warburton and Crossa, Reference Warburton and Crossa2000).
Results and discussion
Out of the 75 SSR primers, 71 revealed clear and consistent amplification profiles. Among these, 58 primers showed polymorphic, while 13 showed monomorphic pattern. Two primers (RM 21 and RM 206) failed to show amplification, revealing no bands (null allele), while two more primers (RM 109 and RM 124) revealed alleles only in super basmati. The null alleles might occur due to mutations in the binding region of one or both of the microsatellite primers, thereby inhibiting primer annealing (Callen et al., Reference Callen, Thompson, Shen, Phillips, Richards, Mulley and Sutherland1993). Out of the 58 polymorphic SSR loci, 12 amplified three alleles each and 46 amplified two alleles each, thus, scoring a total of 141 bands. The genotypes of basmati group could be clearly differentiated from the non-basmati group using any one of the four primers (RM 223, RM 184, RM 491 and RM 260).
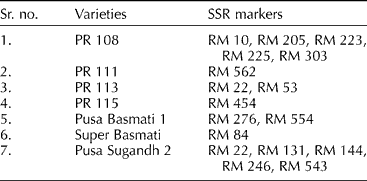
Sixteen SSR primers were found to have higher discriminating power for differentiation of the genotypes as they uncovered 17 unique alleles in the seven genotypes (Table 1). These unique SSR alleles provided an opportunity for their unambiguous differentiation. Unique DNA profiles of the remaining seven genotypes could also be created using other polymorphic primers (Supplementary Table S2, available online only at http://journals.cambridge.org). As reported earlier too (Nandkumar et al., Reference Nandkumar, Singh, Sharma, Mohpatra, Prabhu and Zaman2004; Chakravarthi and Naravaneni, Reference Chakravarthi and Naravaneni2006), identification of the genotypes using PCR-based co-dominant markers offers excellent opportunities for supplementing and refining morphological descriptors. PIC, which is a measure of allelic diversity at a locus, ranged from 0.1 to 0.8 (Supplementary Table S1, available online only at http://journals.cambridge.org).
Simple sequence repeat (SSR) markers discriminating various genotypes based on unique alleles

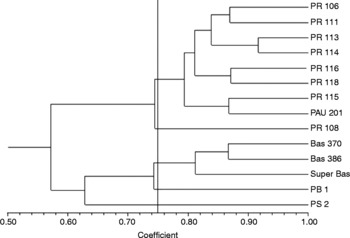
The dendrogram (Fig. 1) depicting the genetic relationships as revealed by cluster analysis identified two distinct groups: comprising non-basmati (group I) and basmati (group II). The cluster pattern was consistent with the pedigree and breeding history of the genotypes, as PR 113 and PR 114; PR 111 and PR 106; Basmati 370 and Basmati 386 had very close genetic similarity because they share common parentage. Whereas PR 108, Pusa Basmati 1, super basmati and Pusa Sugandh 2 formed independent clusters, owing to their diverse nature.
Dendrogram depicting genetic relationships among rice genotypes based on SSR data.

At present, the distinctness, uniformity and stability test guidelines framed in India for the purpose of registration of new plant varieties are, more or less, in accordance with that of International Union for the Protection of New Plant Varieties guidelines, which are primarily based on morphological characters and some biochemical tests. Nevertheless, in our earlier studies (Joshi et al., Reference Joshi, Sarao, Sharma, Singh and Bharaj2007), we could not differentiate clearly many of the rice varieties based on morphological characters due to overlapping of descriptor expression in various trait combinations. The set of microsatellite markers, used in the present study, provided a positive assessment of the ability of SSR markers in producing unique DNA profiles and establishing discrete identity of rice genotypes, which, otherwise, was not possible using morphological traits. The present investigations, for the first time, have helped to establish clear-cut identity of all the cultivars grown in Punjab, which will be of great utility for the protection of Plant Breeders' Rights.