Introduction
Biological invasions have emerged as a prominent feature of global change, with substantial impacts on natural and human-dominated habitats, and are one of the greatest environmental challenges that we face in the 21st century (Dukes and Mooney, Reference Dukes and Mooney1999; Lenzner et al., Reference Lenzner, Leclère, Franklin, Seebens, Roura-Pascual, Obersteiner, Dullinger and Essl2019). Identifying where such species could potentially invade is a key question, critical to effective management of biosecurity risks and potential pest populations if and when they establish (Baker et al., Reference Baker, Sansford, Jarvis, Cannon, MacLeod and Walters2000; Kriticos et al., Reference Kriticos, Leriche, Palmer, Cook, Brockerhoff, Stephens and Watt2013a, Reference Kriticos, Venette, Baker, Brunel, Koch, Rafoss, van der Werf and Worner2013b; Sutherst, Reference Sutherst2014).
Recent discussions of biosecurity risk management have focused attention on issues of how to manage these threats. A synoptic overview of a potential invasion as early as possible is needed so that the risk of introduction, establishment and impact can be assessed and suitable long-term, large-scale strategies formulated in a timely manner (Kriticos et al., Reference Kriticos, Leriche, Palmer, Cook, Brockerhoff, Stephens and Watt2013a, Reference Kriticos, Venette, Baker, Brunel, Koch, Rafoss, van der Werf and Worner2013b). The rates of species invasions have been increasing in Europe (Roques et al., Reference Roques, Rabitsch, Rasplus, Lopez-Vaamonde, Nentwig and Kenis2009), China (Lin et al., Reference Lin, Zhou, Cheng and Xu2007), South America (Czepak et al., Reference Czepak, Albernaz, Vivan, Guimaraes and Carvalhais2013), North America (Aukema et al., Reference Aukema, McCullough, Von Holle, Liebhold, Britton and Frankel2010) and more recent in Australia (Maino et al., Reference Maino, Schouten, Overton, Day, Ekesi, Bett, Barton, Gregg, Umina and Reynolds2021), with the presence of the fall armyworm ‘FAW’, Spodoptera frugiperda (J. E. Smith) (Lepidoptera: Noctuidae), a highly polyphagous pest which since 2016, its global distribution has undergone a large range expansion into the continents of Africa, Asia, the Pacific (Maino et al., Reference Maino, Schouten, Overton, Day, Ekesi, Bett, Barton, Gregg, Umina and Reynolds2021).
This is largely attributable to increased international trade (Levine and D'Antonio, Reference Levine and D'Antonio2003; Westphal et al., Reference Westphal, Browne, MacKinnon and Noble2008; Hulme, Reference Hulme2009) and climate change (Master and Norgrove, Reference Masters and Norgrove2010).
Knowing where invasive pests can and cannot persist allows us to identify the natural and other assets at risk under current and future climate scenarios, and hence what biosecurity measures may be justified on economic or other grounds (Kriticos et al., Reference Kriticos, Leriche, Palmer, Cook, Brockerhoff, Stephens and Watt2013a, Reference Kriticos, Venette, Baker, Brunel, Koch, Rafoss, van der Werf and Worner2013b).
Models based on environmental conditions of sites of known occurrence can be used to identify potentially suitable areas that can be colonized by non-native populations of the species (Peterson, Reference Peterson2003), as well as assess potential distributions under future climate scenarios (Kriticos et al., Reference Kriticos, Sutherst, Brown, Adkins and Maywald2003; Stephens et al., Reference Stephens, Kriticos and Leriche2007). Most bioclimatic models use the known ecological and climatic factors experienced by poikilotherms in their native habitats to estimate their potential distribution elsewhere (Gullan and Cranston, Reference Gullan and Cranston2014). One bioclimatic modelling software package called CLIMEX, enables users to model the potential distribution of organisms based on knowledge of their current distribution and any information on their ecophysiology and phenology with respect to climate change and predict potential distribution, climate similarity, and seasonal phenology (Kriticos et al., Reference Kriticos, Maywald, Yonow, Zurcher, Herrmann and Sutherst2015a). CLIMEX can run in two different useful modes: ‘Compare Locations’, in which the response of a species to long-term average climate at different locations, and ‘Match Climates’, for matching or comparing meteorological data at different locations (Sutherst et al., Reference Sutherst, Maywald and Kriticos2007).
The modelling technique works on the premise that in order to persist at a location, a species needs to be able to grow sufficiently during the favourable seasons (Sutherst et al., Reference Sutherst, Maywald and Kriticos2007; Kriticos et al., Reference Kriticos, Maywald, Yonow, Zurcher, Herrmann and Sutherst2015a). Distribution data indicate that a species may have been observed at a location, though this does not always mean that it was able to persist at that location without artificial assistance (e.g., irrigation or glasshouses) (Kriticos et al., Reference Kriticos, De Barro, Yonow, Ota and Sutherst2020) or seasonal re-invasion via migration (Zalucki and Furlong, Reference Zalucki, Furlong, Srinivasan, Shelton and Collins2011).
Helicoverpa punctigera (Wallengren) (Lepidoptera: Noctuidae), the native budworm, is a polyphagous and economically important species of moth in Australia (Zalucki et al., Reference Zalucki, Daglish, Firempong and Twine1986). It is a serious pest of a wide variety of crops in Australia, including nearly all major field, horticultural and flower crops (Cunningham and Zalucki, Reference Cunningham and Zalucki2014). In most crops, young larvae will graze on leaves alone, moving on to feeding on developing pods, and grain. In other crops, such as mungbeans and cotton, hatchling larvae infest reproductive structures (flowers, squares) as soon as they hatch. This broad host demonstrates why H. punctigera is a pest of the broad farming system and not just a few specific crops.
Helicoverpa punctigera appears well-adapted to the uncertain habitats of inland Australia, included sandy deserts, floodplains and mulga, where it breeds overwinter in the arid inland regions on localized rainfall events (Gregg, Reference Gregg1993, Reference Gregg, Constable and Forrester1995; Gregg et al., Reference Gregg, Fitt, Zalucki, Murray and Drake1995, Reference Gregg, Del Socorro, Le Mottee, Tann, Fitt and Zalucki2019).
In 2015 an insect with morphological characteristics similar to H. punctigera was found in the Northwest region of Ceará State, Brazil (EMBRAPA, 2015). The suspicion of invasion by H. punctigera caused great concern to Brazilian farmers, especially those producing soybean and cotton, having recently experienced the invasion of Helicoverpa armigera (Hübner) (Lepidoptera: Noctuidae) in 2013, which caused damage of around $2 billion in the 1st year of detection alone (Czepak et al., Reference Czepak, Albernaz, Vivan, Guimaraes and Carvalhais2013). Subsequently this specimen was identified and it was not H. punctigera (Czepak, 2019, personal information). However, this event made the Brazilian government aware of the risk of establishment of H. punctigera in Brazil (Zalucki and Furlong, Reference Zalucki and Furlong2005).
Currently H. punctigera is geographically restricted to Oceania, but will this scenario change in a future with increasing trade and global warming? Climate change is likely to alter the potential distribution of H. punctigera compared with the present. By knowing the direction of change and the relative sensitivity of the potential distribution of H. punctigera to different climate change scenarios, we can assess the likely changes in the invasion risk posed by this species. Thus, the present study was undertaken with the following objectives: (i) project the global potential distribution, relative abundance and establishment risk of H. punctigera, and (ii) assess its potential distribution under future climate scenarios.
Methods
CLIMEX software
A bioclimatic niche model of the potential distribution of H. punctigera under current as well as future climate was developed using CLIMEX (Sutherst and Maywald, Reference Sutherst and Maywald1985; Kriticos et al., Reference Kriticos, Maywald, Yonow, Zurcher, Herrmann and Sutherst2015a). CLIMEX works on the basis of an eco-physiological growth model that assumes that at each location, a population may experience favourable seasons for population growth and unfavourable seasons that cause negative population growth (Kriticos et al., Reference Kriticos, Maywald, Yonow, Zurcher, Herrmann and Sutherst2015a). The known geographic range of a species is used to infer parameters that describe its response to climate. The ability to cross-check parameter estimates across these different knowledge domains has been identified as a strength of CLIMEX, which provides a strong form of independent model validation (Kriticos et al., Reference Kriticos, De Barro, Yonow, Ota and Sutherst2020).
An annual growth index (GIA) describes the potential for population growth when climatic conditions are favourable, while four stress indices (cold, wet, hot and dry) and up to four interaction stress indices (hot-wet, cold-wet, hot-dry and cold-dry) describe the likelihood that the population can survive unfavourable conditions. The Growth Index is scaled from 0 to 100 to describe conditions that favour growth of a population is also generated by CLIMEX.
Weekly calculations of the growth and stress indices are combined into an overall annual index of climatic suitability, the ecoclimatic index (EI) which is scaled from 0 to 100. This index provides an overall measure of the climatic suitability of a given location to support a permanent population of the species (Sutherst et al., Reference Sutherst, Maywald and Kriticos2007).
For the potential suitable level, the following categories of EI were adopted based on the observed EI values in H. punctigera native range: locations with EI = 0 (unsuitable), 1 < E < 10 (marginal), 10 < EI < 20 (moderate), and >20 EI (highly favourable).
Seasonal phenology
The seasonal phenology patterns for H. punctigera in Australia were obtained from Maelzer et al. (Reference Maelzer, Zalucki and Laughlin1996), Walden (Reference Walden, Drake and Gatehouse1995) and unpublished data sets. There were eight relatively long series of light-trap catch of H. punctigera, namely from Myall Vale ( = Narrabri in this paper) and Trangie in New South Wales (NSW), Turretfield in South Australia (SA), Emerald (QLD), Horsham and Hamilton (VIC), and Ord River and Prenti Downs (WA).
The moth data from all of the sites are comprised of weekly totals. For Narrabri, data were obtained for the years 1973–1974 to 1977–1978 and 1981–1982 to 1986–1987. The raw data for 1977–1978 to 1980–1981 have been ‘lost’. Trangie data were obtained for the years 1973–1974 to 1983–1984, Horsham and Hamilton data were obtained for the years 1980–1981 to 1984–1985, Turretfield data for 1962–1963 to 1983–1984, Emerald data for 1978–1979 to 1982–1983, Ord River data for 1964–1965 to 1969–1970 and Prenti Downs data from 1991 (Walden, Reference Walden, Drake and Gatehouse1995).
Meteorological database and climate change
Historical climate data were obtained from the CliMond 10′ resolution data set for 1950–2000 represented by average minimum monthly temperature (T min), average maximum monthly temperature (T max), average monthly precipitation (Ptotal) and relative humidity at 09:00 h (RH09:00) and 15:00 h (RH15:00) (Kriticos et al., Reference Kriticos, Webber, Leriche, Ota, Macadam, Bathols and Scott2012). These same five variables were used to characterize potential future climate in 2100, based on CSIRO-Mk3.0 (CS) one of many Global Climate Models (GCMs), which assumes a temperature increase of 2.11 °C and a 14% rainfall reduction by 2100 (Gordon et al., Reference Gordon, Rotstayn, McGregor, Dix, Kowalczyk, O'Farrell, Waterman, Hirst, Wilson, Collier, Watterson and Elliott2002) with the A1B scenario (IPCC, 2007).
This scenario can be considered a business-as-usual case where balanced is defined as not relying too heavily on one particular energy source, on the assumption that similar improvement rates apply to all energy supply and use technologies. The scenario describes a future world of very rapid economic growth, low population growth, and shows an increasing trend in greenhouse gas (GHG) emissions up to 2050 then a decreasing trend out to 2100.
Model fitting, verification and validation
The CLIMEX parameter set of H. punctigera developed by Zalucki and Furlong (Reference Zalucki and Furlong2005) was taken as a starting point while building the new model. Helicoverpa punctigera is presently endemic to Australia, and its distribution records indicate that it is found widely throughout Australia, even in xeric regions (Zalucki et al., Reference Zalucki, Daglish, Firempong and Twine1986, Reference Zalucki, Murray, Gregg, Fitt, Twine and Jones1994; Gregg et al., Reference Gregg, Del Socorro, Le Mottee, Tann, Fitt and Zalucki2019). Climate-modifying factors such as irrigation can play an important role in extending a species range beyond the limits afforded by climate (De Villiers et al., Reference De Villiers, Hattingh, Kriticos, Brunel, Vayssières, Sinzogan, Billah, Mohamed, Mwatawala, Abdelgader, Salah and De Meyer2016). Therefore, we hypothesized that the persistence of H. punctigera in these dry regions may be predicated in part on irrigation practices or unusual localized rain events. Hence, we included an irrigation scenario to simulate these conditions and provide a better model fit.
The model was fitted using distribution data and parameters derived from observed phenologies according to the published information of Zalucki and Furlong (Reference Zalucki and Furlong2005), as well as phenological observations made through trapping by Maelzer et al. (Reference Maelzer, Zalucki and Laughlin1996) in Australia, as well as unpublished trapping data.
Temperature index
The minimum temperature for development (DV0) was set to 11 °C in accordance with Qayyum and Zalucki (Reference Qayyum and Zalucki1987). The lower and upper optimum temperatures for development (DV1 and DV2) were adjusted to 25 °C and 30 °C, respectively. These parameters were estimated for a better fit of the growth phenology of the moths accorded with field observations of strong population growth (fig. 1). The maximum temperature for development (DV3) was set to 40 °C, in accordance with observations in Qayyum and Zalucki (Reference Qayyum and Zalucki1987) that egg mortality increased significantly above this temperature threshold.
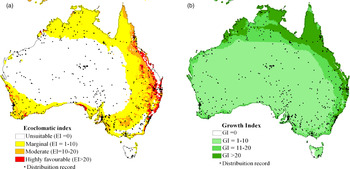
The current climate suitability for Helicoverpa punctigera in Australia, modelled using CLIMEX, taking into account diapause and irrigation. (a) Ecoclimatic index (EI) and (b) growth index (GI). Observed distributions derived from Zalucki et al. (Reference Zalucki, Daglish, Firempong and Twine1986, Reference Zalucki, Murray, Gregg, Fitt, Twine and Jones1994) and Matthews (Reference Matthews1999).

Moisture index
The limiting low moisture parameter SM0 was set to 0.11, to accord with the permanent wilting point (Kriticos et al., Reference Kriticos, Maywald, Yonow, Zurcher, Herrmann and Sutherst2015a) (table 1). Below this level, host plants are unlikely to be capable of supporting population growth of insects.
CLIMEX parameter set for Helicoverpa punctigera showing the source

Values were adjusted to better fit to the occurrences.
a Value referred to Zalucki and Furlong (Reference Zalucki and Furlong2005).
Minimum annual heat sum
Population degree day (PDD) represents the total number of the degree-days above DV0 required for completing an entire generation. This was set to 500 °C days in accord with Daglish (Reference Daglish1991) (table 1).
Stress indices
In CLIMEX, the stress indices capture the species' response to unfavourable climatic conditions (Kriticos et al., Reference Kriticos, Maywald, Yonow, Zurcher, Herrmann and Sutherst2015a). There are four types of stress: CS (cold stress), HS (heat stress), DS (dry stress), and WS (wet stress), and an additional set of four interaction stresses (cold−wet, cold−dry, hot−dry and hot−wet).
Cold stress
Cold stress begins to accumulate when temperatures drop below a cold stress temperature threshold (TTCS) (4 °C). This TTCS was estimated according with the natural occurrence of H. punctigera in cold regions in Australia as in Victoria. The degree-day cold stress (DTCS) mechanism provides a limitation under cool conditions where daily maximum temperatures are insufficient for host photosynthesis and H. punctigera feeding to offset metabolic base rate respiration losses. In the fitted model, we set our DTCS at 10° days and the cold stress degree-day (DHCS) at −0.001 week−1.
Heat stress
When temperature is higher than the heat stress temperature threshold (TTHS; °C) heat stress begins to accumulate at a rate determined by (THHS). As the temperature increases, the hatching rate of H. punctigera increased while the time required for hatching decreased. H. punctigera eggs did not hatch if exposed to 30 °C continuously, but the eggs can survive brief exposure to temperature of 40 °C (Qayyum and Zalucki, Reference Qayyum and Zalucki1987). Based on this, TTHS was set to 40 °C, same value of Zalucki and Furlong (Reference Zalucki and Furlong2005), but the THHS was fitted to 0.01 week−1 according with the geographical distribution in Australia.
Dry stress
Dry stress accumulates when the soil moisture falls below the dry stress threshold (SMDS) at a dry stress rate (HDS). Different from Zalucki and Furlong (Reference Zalucki and Furlong2005) the dry stress was calibrated by setting SM0 to 0.1, and adjusting the stress accumulation rate (HDS) to −0.025 week−1, barely allowing persistence (a positive EI value) at the driest sites considered capable of maintaining persistent populations of H. punctigera.
Wet stress
Wet stress accumulates at a rate (HWS) when the soil moisture exceeds the wet stress threshold (SMWS). The wet stress parameters were fitted to the geographical distribution in Australia. In accord with advice in Kriticos et al. (Reference Kriticos, Sutherst, Brown, Adkins and Maywald2003) that stress thresholds should not be set within the limits of growth, the Wet Stress Threshold SMDS was adjusted upwards to match SM3.
Diapause
Helicoverpa punctigera exhibits a facultative pupal diapause that is regulated by temperature and photoperiod (Cullen and Browning, Reference Cullen and Browning1978). Individuals entering diapause through an adaptive strategy for forsake opportunities for growth as a trade-off for protection against extremely high or low temperatures which would be lethal (Tauber et al., Reference Tauber, Tauber and Masaki1986).
In general, the pupae entering diapause in autumn would remain in diapause over winter to yield adults in the spring, those entering diapause in spring would encounter high soil temperatures which would promote termination of diapause (Cullen and Browning, Reference Cullen and Browning1978).
In the present version of CLIMEX, only one diapause mechanism can be run at a time.
In this model we noted that the cold limits were most important for projecting the potential range of H. punctigera.
The diapause parameters DPD0 (the diapause induction day length) and DPT0 (the diapause induction temperature) were adjusted to 11 h and 19 °C, respectively. DPT1 is the diapause minimum temperature that leads to termination of diapause after the minimum number of days in diapause (DPD) has been completed (table 1). These values were fitted at 12 °C and 69 days, respectively, according with the natural occurrence of H. punctigera in cold the regions as Trangie (NSW), Horsham and Hamilton (VIC). DPSW is an indicator for diapause season, and it was set at zero ( = winter).
Irrigation and composite risk map
Helicoverpa punctigera is found in areas that under average natural rainfall conditions are too arid to support sufficient crop/plant growth and hence year-round survival of H. punctigera populations. We used methods described in De Villiers et al. (Reference De Villiers, Hattingh, Kriticos, Brunel, Vayssières, Sinzogan, Billah, Mohamed, Mwatawala, Abdelgader, Salah and De Meyer2016) and Yonow et al. (Reference Yonow, Kriticos, Ota, Van Den Berg and Hutchison2016) to apply an irrigation scenario of 2.5 mm day−1 throughout the year as top-up, a moderate scenario to produce a risk map contingent on irrigation being practiced in the 10′ cell according to the global irrigation map, producing a composite irrigation/natural rainfall risk map. The area over which irrigation is practiced was identified using the Global Irrigated Area V5 (GMIA5) developed by Siebert et al. (Reference Siebert, Döll, Hoogeveen, Faures, Frenken and Feick2005) to produce a composite map, comprising both irrigated and non-irrigated areas, to show the overall projected suitability for H. punctigera.
The diapause and irrigation scenarios were combined into a fully factorial set of scenarios. In areas where more than zero hectares were under irrigation according to Siebert et al. (Reference Siebert, Döll, Hoogeveen, Faures, Frenken and Feick2005), the EI of the irrigation scenario was mapped, while in areas where zero irrigation is applied, the EI of the non-irrigation scenario was mapped. Within the irrigation scenarios, the results of the with- and without diapause models were combined, taking the maximum EI value for each cell, reasoning that the value that was best adapted to the climate within each cell would predominate in such regions.
Results
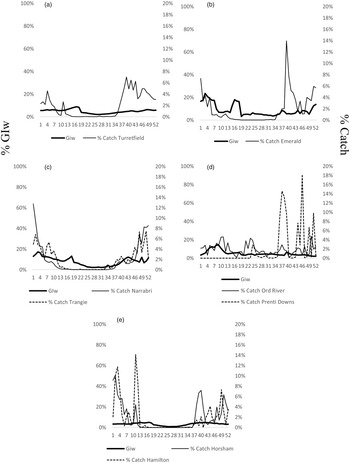
The projected potential distribution of H. punctigera under historical climate agrees with its current distribution in Australia (fig. 1). Throughout most of its range, H. punctigera is found in areas modelled as being climatically suitable for establishment. Climatic suitability (EI and GIA) increases toward the coasts where a high proportion of the recorded locations occur, especially eastern Queensland and northern NSW that are climatically optimal, which conforms well to the Australian distribution (Zalucki and Furlong, Reference Zalucki and Furlong2005), while in the xeric centre of Australia has low climatic suitability due to dry stress. The green-shaded areas in fig. 1b represent arid and semi-arid regions capable of supporting ephemeral populations of H. punctigera. The GIW for a location enabling ‘modelled seasonal suitability’ to be compared with observed seasonal phenology based on trapping of adult moths (Kriticos et al., Reference Kriticos, Ota, Hutchison, Beddow, Walsh, Tay, Borchert, Paula-Moreas, Czepak and Zalucki2015b). Our model simulates very similar phenology to that observed (fig. 2), with best rates of growth occurring from September to January; during the spring and summer.
Weekly Growth index values (major Y-axis) and various measures of population abundance for H. punctigera (expressed as a % of the total catch, secondary Y-axis) over a year (time in weeks, 1–52) from 1 January. The GIW (thick solid line) is the composite maximum across these scenarios, considering whether irrigation is practiced for H. punctigera to: (a) Turretfield, South Australia, (b) Emerald, Queensland, (c) Narrabri, thinner line and dashed thin line for Trangie, both are New South Wales, (d) Ord River (thinner line) and Prenti Downs (dashed line), Western Australia and (e) Horsham (thinner liner) and Hamilton (dashed line) in Victoria.

In some areas, we would expect GIW to be a leading indicator of moth population growth rates, where trapped moths occur at times which are on average climatically suitable for growth, with variation in seasonal climatic suitability reflected in part in changes in moth numbers (fig. 2a–c). However, for the other sites the GIW remained low for a longer period than the peak in the moth population; for example in Victoria (VIC) and Western Australia (WA) (fig. 2d, e), where the GIW stayed low all year, except for March. In Western Australia and Victoria the moth numbers peaked during the middle of August and declined towards January and March, respectively.
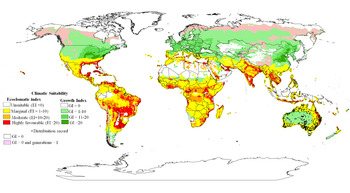
On a global scale, climatic conditions are projected to be suitable for H. punctigera throughout much of the tropics and subtropics (fig. 3), with the exception of desert areas where excessive dry stress or heat stress limit its distribution, however irrigation would enable the species to persist. The Annual Growth Index (GIA) illustrates areas that are climatically suitable for at least one generation (fig. 3). With irrigated agriculture many parts of South America, Central America, sub-Saharan Africa, South-eastern USA, Madagascar, the Indian subcontinent and most of the Pacific Islands; appear climatically suitable for H. punctigera to establish from where it may spread to other regions when weather or temperatures are favourable for pest development (fig. 3).
Climate suitability for Helicoverpa punctigera globally modelled using CLIMEX, including the spatially explicit effects of irrigation. The Ecoclimatic Index (EI) describes the potential suitability for persistence, while the GI describes suitability for population growth. Point locations indicate the natural occurrence.

Climatic conditions are projected to be more suitable during the warmest months of year. In the South Hemisphere this period is between September/October until February/March, while in North Hemisphere the suitable months are April/May until September/October.
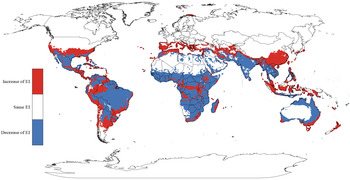
The difference values between ‘future climate’ EI values and ‘current climate’ EI values are presented in fig. 4. Red indicates that compared with current climate, the EI values show positive changes in the future climate (fig. 4) whereas blue in contrast indicates that compared with current climate, the EI values reduce in the future. In general, the overall impact of the future climate scenario on the potential distribution of H. punctigera is that its range expands poleward and into higher altitudes; basically, into areas that are currently too cold (fig. 4). The projected geographic range of suitable climates for H. punctigera under each of the future climate scenarios examined here, will increase substantially in Europe, the USA, South East Asia, and South Pacific Islands including New Zealand (fig. 4). In Europe, the potential range for H. punctigera is projected to expand northwards, with climatically suitable or marginal conditions occurring in much of Spain, Portugal and Italy (fig. 4a–c). In Asia, the projected potential range for H. punctigera also expands poleward, although projected conditions in South East Asia decrease, because of increasing dry stress in New Guinea, Myanmar and Thailand. In China, the optimal range for H. punctigera invasion is projected to extend towards north-eastern areas (fig. 4).
Climate change impacts on the potential distribution of Helicoverpa punctigera under A1B scenario. The map shows the global changes of the suitability [Ecoclimatic index (EI) difference] in 2100, which are compared with the historical condition (1950–2000). The gradation of colour in the different regions shows the sensitivity to climate change. The depth of colour up to red represents a positive EI difference; while blue represents a negative EI difference.

In South America, modelled climatically optimal areas for H. punctigera under current climate are restricted to areas outside the Amazon Basin, primarily along the eastern coast of South America in the Northeast Brazil and Northeast Argentina region and inland in Paraguay (fig. 4).
Under the A1B scenario, the projected optimal range of H. punctigera in the Amazon Basin, India and inland Australia reduces as the climate is projected to become drier and, consequently, less suitable for the invasion threat of H. punctigera in terms of EI over 2100 (fig. 4).
Establishment risk in South America
The GIA describes the overall potential for growth, and gives an indication of the potential size or relative abundance of a species across its range as determined by climate alone (Kriticos et al., Reference Kriticos, Maywald, Yonow, Zurcher, Herrmann and Sutherst2015a).
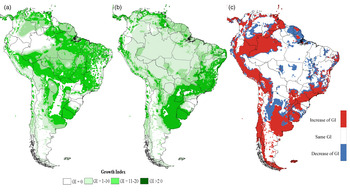
The model results indicate that in most of the countries in South America have areas with highly suitable climatic conditions (GI > 20) for H. punctigera, at least seasonally (fig. 5a and fig. A in S1 File). In most south American countries, the future climate scenario projects a progressive reduction in areas with annual growth index for H. punctigera by 2100 in comparison with the current situation (fig. 5b, c). The growth index for H. punctigera will reduce progressively in each projected time period. In South America, between current and 2100, the areas with a growth index highly (20 < GI < 100) and less suitable (0 < GI < 20) for H. punctigera will reduce. The most sensitive stress parameters influencing the modelled range of H. punctigera are dry stress, which is of major importance, and cold stress, less so (figs 6, 7, figs B and C in S1 File).
Annual growth index (GIA) for Helicoverpa punctigera in South America, for (a) current, (b) 2100 scenario, (c) GIA difference in 2100, which are compared with the historical condition (1950–2000), modelled using CLIMEX, taking into account irrigation patterns and diapause. Point symbols indicate the biggest port in South America, Port of Santos, SP, Brazil.

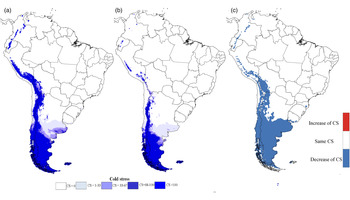
Cold stress index for H. punctigera projected using CLIMEX under CS GCM running the A1B scenario for (a) current, (b) 2100 and (c) difference in 2100, which are compared with the historical condition (1950–2000) for South America.

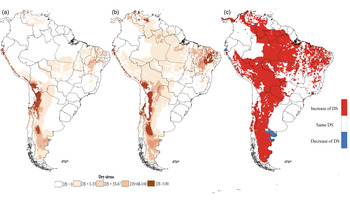
Dry stress index for H. punctigera projected using CLIMEX under CS GCM running the A1B scenario for (a) current, (b) 2100 and (c) difference in 2100, which are compared with the historical condition (1950–2000) for South America.

These represent the extent to which each factor hinders survival of the species. In this case, the cold stress map (fig. 6a–c) highlights locations in which cold conditions limit the species’ ability to survive the winter; values of 100 (indicated by very dark blue shades) indicate lethal cold stress conditions..
The A1B future climate scenarios indicate that dry stress will likely restrain H. punctigera in some areas (fig. 7a–c). In most countries in South America, the projection has a progressive increase of dry stress for H. punctigera. Consequently, this leads to a progressive decrease in areas suitable for H. punctigera (fig. 7a–c). In Northern Brazil, the future scenario includes a decrease in rain, and hence the decrease of soil moisture, which will impact dry stress experienced (fig. 7a–c); similarly, central and northeast Brazil will become progressively drier and less suitable for the plant hosts and the moth.
Discussion
The CLIMEX model results agree closely with the known geographic range of H. punctigera in Australia, where extensive sampling indicates that this moth is spread throughout country, at least seasonally (fig. 1). While the map suggests a static boundary, in reality, the border between the area suitable for establishment and ephemeral populations will be dynamic, responding to inter-annual variation in climate.
The CLIMEX model performed very well, giving perfect model sensitivity in relation to all known qualified distribution records, and no excessive model prevalence. The previous CLIMEX model of H. armigera (Zalucki and Furlong, Reference Zalucki and Furlong2005) indicated a positive EI value for large areas of arid and semi-arid habitat in Central Australia, where the climate is only suitable for H. punctigera during favourable seasons and years, due to the occurrence of alternative hosts during the rainy season (Gregg et al., Reference Gregg, Del Socorro, Le Mottee, Tann, Fitt and Zalucki2019). Our model incorporated the use of the irrigation information from Siebert et al. (Reference Siebert, Döll, Hoogeveen, Faures, Frenken and Feick2005), that allowed us to capture the effect of crop irrigation, as well as the erratic rainfall in supporting populations of H. punctigera in arid regions (De Villiers et al., Reference De Villiers, Hattingh, Kriticos, Brunel, Vayssières, Sinzogan, Billah, Mohamed, Mwatawala, Abdelgader, Salah and De Meyer2016; Yonow et al., Reference Yonow, Kriticos, Ota, Van Den Berg and Hutchison2016).
Extensive research has clarified the seasonal dynamics of H. punctigera in Australia, with populations occurring in ephemeral habitats, basically during the rainy season in inland areas given good conditions for native host plant in non-cropping regions, where H. punctigera larvae were recorded on 106 plants in 24 families, and persistent in agricultural areas (Gregg et al., Reference Gregg, Del Socorro, Le Mottee, Tann, Fitt and Zalucki2019). In cropping areas at least three generations are observed between September and April, with overlapping fourth and fifth generations also possible late in this period in cropping and non-cropping systems in Australia (Zalucki et al., Reference Zalucki, Daglish, Firempong and Twine1986; Gregg, Reference Gregg1993).
For seven of the eight sites in this study, moths were trapped at times which are on average climatically suitable for growth (fig. 2). The one site where there is poor agreement is in Ord River region and Prenti Downs where irrigation is widely used for agriculture.
Given its notable migratory ability and short generation time, it is not easy to predict the abundance and distribution of H. punctigera, particularly in inland Australia where human populations are sparse and insect pests are rarely monitored because there are no crops (Gregg et al., Reference Gregg, Socorro and Rochester2001). These uncertainties combine to limit our ability to model the potential distribution of H. punctigera with greater precision.
The modelled Ecoclimatic Index suggests that H. punctigera could establish and spread beyond its current range to other regions in the world if introduced particularly in the subtropic and tropic areas (fig. 3). The model presented here shows a high degree of reliability due to the parameter values used that were based on recent biological studies and realistic distribution record of persistent and ephemeral populations. America, Central African regions, and Asia are vulnerable to invasion by H. punctigera under current climatic conditions (fig. 3).
The distribution of H. punctigera in others regions will be related to the presence of alternative host plants as happens in Australia, where Gregg et al. (Reference Gregg, Del Socorro, Le Mottee, Tann, Fitt and Zalucki2019) recorded larvae in annual Asteraceae, as Polycalymma stuartii, Senecio gregorii and Rhodanthe charsleyae, Fabaceae, especially annuals, and a few plants from other families including Geraniaceae, Goodeniaceae, Malvaceae and Solanaceae. All of these plant families are commonly find in others regions in the world. The tribe Senecioneae has approximately 3500 species (Nordenstam et al., Reference Nordenstam, Pelser, Kadereit, Watson, Funk, Susanna, Stuessy and Bayer2009), of which about 500 occur in the Americas and between 350 and 500 in Africa (Pelser et al., Reference Pelser, Nordenstam, Kadereit and Watson2007; Matzenbacher, Reference Matzenbacher2009; Milton, Reference Milton2009).
The pathways of H. punctigera introduction could be via international trade or through travellers with plant material infested with eggs or larvae, or even via migration; adult moths are strong flyers (Zalucki et al., Reference Zalucki, Daglish, Firempong and Twine1986; Rochester et al., Reference Rochester, Dillon, Fitt and Zalucki1996; Zalucki and Furlong, Reference Zalucki and Furlong2005). Additionally, H. punctigera shows a similar ecology to H. armigera (Zalucki et al., Reference Zalucki, Daglish, Firempong and Twine1986), and it is likely that if it is introduced to other areas, such as South America, it would be able to establish, as happened with H. armigera (Czepak et al., Reference Czepak, Albernaz, Vivan, Guimaraes and Carvalhais2013).
Climate change has significant implications for pest risk assessment and biosecurity, as pest ranges are likely to shift because of changes in temperature, humidity and soil moisture patterns (Sutherst et al., Reference Sutherst, Maywald and Kriticos2007; Kriticos et al., Reference Kriticos, Leriche, Palmer, Cook, Brockerhoff, Stephens and Watt2013a, Reference Kriticos, Venette, Baker, Brunel, Koch, Rafoss, van der Werf and Worner2013b). Many bioclimatic modelling papers that explore climate change scenarios, report a projected increase in invasion of exotic pests (Dukes and Mooney, Reference Dukes and Mooney1999; Bradley, Reference Bradley2009; Bradley et al., Reference Bradley, Wilcove and Oppenheimer2010; Duursma et al., Reference Duursma, Gallagher, Roger, Hughes, Downey and Leishman2013). However we found the converse for H. punctigera in some regions of the world (fig. 4). According to the climate scenario for 2100, in almost all countries in Central and South America, Sub-Saharan Africa, and Asia, the climatic conditions, currently favourable for H. punctigera become less suitable or unfavourable. This reduction is due to increased dry stress and reduced growth potential (figs 6 and 7). The CS GCM projects a greater expansion of dry stress than cold stress by 2100 since the A1B scenario incorporates a 1.1–3.8 °C increase in annual temperatures and decrease of 14% of mean annual rainfall (Porter et al., Reference Porter, Parry and Carter1991; Suppiah et al., Reference Suppiah, Hennessy, Whetton, McInnes, Macadam, Bathols, Ricketts and Page2007). Other factors are important for the growth of H. punctigera, for example temperature, which influences survival, development, reproductive performance, population dynamics, and distribution (Chown and Nicolson, Reference Chown and Nicolson2004; Chown and Terblanche, Reference Chown and Terblanche2006; Angilletta, Reference Angilletta2009). Above 40 °C and low humidity (<75%), H. punctigera's eggs do not hatch (Qayyum and Zalucki, Reference Qayyum and Zalucki1987). Increasing dry stress is the major factor restricting H. punctigera under future climate scenarios (fig. 7). This may be due to a higher dehydration vulnerability during the larval stage, since the insect's cuticle is more permeable compared to the pupal stage (Zalucki et al., Reference Zalucki, Daglish, Firempong and Twine1986; da Silva et al., Reference da Silva, Kumar, Shabani and Picanço2017).
The modelled suitability projections for H. punctigera are only based on its responses to climate, and ignore dispersal and interactions among species (Jarnevich et al., Reference Jarnevich, Stohlgren, Kumar, Morisette and Holcombe2015), such as resource competition and effects of predatory species (Baker et al., Reference Baker, Sansford, Jarvis, Cannon, MacLeod and Walters2000), biophysical factors such as soil, land use (Sutherst et al., Reference Sutherst, Maywald and Kriticos2007), genetic diversity (Jarnevich et al., Reference Jarnevich, Stohlgren, Kumar, Morisette and Holcombe2015) and vegetation cover (Chejara et al., Reference Chejara, Kriticos, Kristiansen, Sindel, Whalley and Nadolny2010). Besides that, the various data elements used in this analysis span a range of temporal frames, where the climate is centred on 1975, the crop distribution data on 2000 and the value of production and irrigation data on 2005, therefore these temporal mismatches should have minimal impact on the analytical results (Kriticos et al., Reference Kriticos, Ota, Hutchison, Beddow, Walsh, Tay, Borchert, Paula-Moreas, Czepak and Zalucki2015b).
In summary, future climate changes may reduce the areas that are suitable for H. punctigera, mainly where currently H. punctigera has been causing high losses in agricultural crops. This progressive reduction of climatically suitable area for H. punctigera is caused by an increase in dry stress due to a decrease of rainfall.
Overall, the modelling approaches used here indicated the risk of invasion of H. punctigera in different countries even in a climatic change scenario. We find the major factors that limit the growth of H. punctigera is dry stress. This finding can be useful for the integrated pest management programs, including use of potential biological control agents (Ireland et al., Reference Ireland, Bulman, Hoskins, Pinkard, Mohammed and Kriticos2018) and understanding of the native hosts (Gregg et al., Reference Gregg, Del Socorro, Le Mottee, Tann, Fitt and Zalucki2019) that could be used in concert with our model to apply the best method in either the riskiest locations or at the margins of such locations to prevent additional spread.
Supplementary material
The supplementary material for this article can be found at https://doi.org/10.1017/S0007485321000638
Acknowledgements
We thank especially, Peter Gregg, for providing information about the H. punctigera occurrence, Noboru Ota, Ricardo Siqueira da Silva, Márcio Regys and Sharon Gomes for helping with the analysis with ArcMap. This research was supported by the Cearense Foundation for Scientific and Technological Development Support (Fundação Cearense de Apoio ao Desenvolvimento Científico e Tecnológico – FUNCAP) and the Brazilian Federal Agency (88881.189410/2018-01), for the Support and Evaluation of Graduate Education (Coordenação de Aperfeiçoamento de Pessoal de Ensino Superior – CAPES) and the School of Biological Science of the University of Queensland (UQ), Brisbane, Australia. The simulations were carried out using computational facilities at UQ.