I. INTRODUCTION
Metal matrix composites reinforced with ceramic particles have attracted increasing attention because of their excellent properties, such as high elastic modulus, high specific strength as well as high thermal and electrical properties, having wide applications in automotive, aerospace, military, electronics, and sports industries. Reference Varol, Canakci and Ozsahin1–Reference Canakci, Arslan and Varol3 Several processing techniques, such as stir casting (SC), mechanical alloying (MA), and powder metallurgy (PM), have been used for fabrication of metal matrix composites. Reference Varol and Canakci4–Reference Canakci, Arslan and Varol6 Regarding SC method, the introduction of reinforcements to the matrix requires the addition of wetting agents or the reinforcing particles to be coated because of the bad wettability between the matrix melts and reinforcements. Moreover, extensive reactions of reinforcements/matrix interface and the agglomeration of the reinforcements are inevitable. MA method can fabricate the composites with high tensile properties, but long milling time is necessary to obtain homogeneous distribution of reinforcing particles, which excessively increases the work hardening of the milled powders and thus decreases densification ability during consolidation process. PM technology is a well-known commercial process because of the flexible constituent design, controllable interface reaction, and homogeneous distribution of reinforcements. Reference Zhang, Cai, Wang, Peng, Qiu and Wang7 However, the main challenges of this method are the high processing cost resulting from the complex processes and difficulty in fabricating products with complex shapes and compact microstructures, Reference Chen, Yang and Chao8 which limit its applications. Therefore, the development of a novel process that not only retains the advantages of PM but also overcomes these disadvantages becomes extremely urgent.
Thixoforming is a relatively novel metal-processing technique and is available for fabricating the components with complex shapes and compact microstructures. By combining thixoforming with PM, a novel process for fabricating composites, powder thixoforming (PT) can be proposed. A green composite compact is first achieved by mixing the matrix powders and reinforcements and subsequent cold pressing. Then, the compact is partially remelted and thixoformed, and a PT composite component can be obtained. Previous studies on the PT most focused on the microstructural evolution during the partial remelting of 2024 aluminum alloy. Reference Li, Chen, Zhang and Guan9 Only a few investigations have studied the effects of processing parameters on the microstructure and tensile properties of 6061 aluminum alloy and SiCp/2024 Al-based composite fabricated via PT. Reference Chen, Chen, Zhang and Li10,Reference Li and Chen11 There has been little study to detailedly focus on the superiorities of the PT technology and the resulting composites. In addition, although the strengthening mechanisms of the particle reinforced metal matrix composites have been comprehensively studied and several strengthening models have been proposed, such as the Zhang and Chen (Z–C) model and modified Clyne (M-C) model, the theoretically predicted results had significant deviation from the experimental values. Reference Zhang and Chen12,Reference Sanaty-Zadeh13 When a composite is subjected to the tensile stress, some reinforcements will experience fracture and debonding as the deformation proceeds because of the stress concentration. Once composite suffers damage in a fraction of its reinforcements, the strengthening effects are degraded because the load-transfer capability becomes less-effective and the dislocation density is relaxed. Unfortunately, the existing strengthening models neglected the negative effects following reinforcement failure and assumed that the reinforcements are intact in the theoretical analysis, which led to less precision of the predicted results. Therefore, in the present work, an investigation was made to compare the microstructures and mechanical properties of PT SiCp/2024 Al-based composite, PT 2024 alloy, and PMC 2024 alloy, to excavate the superiorities of the PT technology and the resulting composites. Moreover, a novel strengthening model was proposed in consideration of the failure of SiCp, and the resulting result coincided well with that of the experiment.
II. EXPERIMENTAL PROCEDURE
A. Materials
Gas-atomized 2024 Al alloy powders (Alp) with a chemical composition (in wt%) of Al–4.22Cu–1.35Mg–0.5Si and an average particle size of 20 µm were used as the matrix alloy. The SiC particles (SiCp) with an average particle size of 15 µm were chosen as the reinforcements. Prior to PT fabrication of the SiCp/2024 Al-based composite, the SiCp were oxidized at 930 °C for 5 h. The Alp and SiCp were supplied by Zhejiang Bainianyin Industry & Trade Co., Ltd. (Yongkang, Zhejiang, China).
B. Fabrication of the composite and 2024 alloys
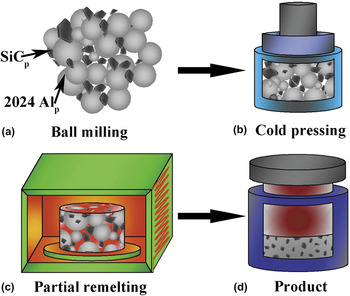
Figure 1 shows a schematic of the PT technology that includes four steps. First, the Alp were blended with SiCp in a ND7-21 planetary ball mill (Nanjing Laibu Technology Industry Co., Ltd., Nanjing, China) for 30 min [Fig. 1(a)], and the mixture containing 10 vol% SiCp was prepared. The ball-to-powder weight ratio and rotation speed were maintained at 5:1 and 100 rpm, respectively. Second, the powder mixture was compacted under a pressure of 200 MPa into a cylindrical composite compact with 45 mm of diameter and 20 mm of thickness [Fig. 1(b)]. Third, the compact was heated at a semisolid temperature of 625 °C for 80 min to achieve a semisolid ingot [Fig. 1(c)]. Finally, the ingot was transferred quickly to a pre-heated mold with a cavity of Ø50 mm × 60 mm and thixoformed, and a composite product with dimensions of Ø50 mm × 16 mm was obtained [Fig. 1(d)]. The used mold temperature, punch velocity, and applied pressure were 350 °C, 60 mm/s, and 190 MPa, respectively. The PT 2024 alloy was also fabricated by the same process.
Schematic illustration of PT. (a) ball milling, (b) cold pressing, (c) partial remelting, and (d) product.

The PMC 2024 alloy was fabricated via a liquid metallurgy route using a commercial 2024 aluminum alloy. The alloy ingot was first melted at 800 °C. Subsequently, the melt was degassed using C2Cl6 and then poured into a permanent mold with dimensions of Ø50 mm × 500 mm when the melt temperature was cooled to 740 °C. Finally, some ingots (diameter = 50 mm, height = 16 mm) were machined from the as-cast rods.
C. Tensile testing
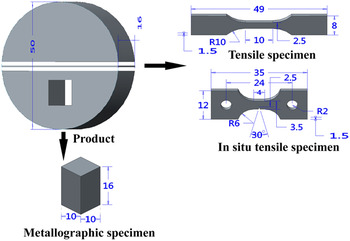
Tensile specimens were machined from the center region of each product (the obtained cake products with dimensions of Ø50 mm × 16 mm), as schematically illustrated in Fig. 2. The tensile tests were performed on a universal material testing machine at a loading velocity of 0.5 mm/min. Four specimens of each product were tested. To study the crack initiation and propagation path during the tensile tests, the in situ tensile tests were conducted at a loading velocity of 5.5 × 10⁻⁴ mm/s on a QUANTA FEG 450 scanning electron microscope (SEM; FEI Company, Hillsboro, Oregon).
Illustration of the tensile, in situ tensile, and metallographic specimens.

D. Characterization
Typical fracture surfaces were observed using the SEM. Some specimens were also machined from the center region of each product [Fig. 2] and used for metallographic observation with a MeF3 optical microscope (OM; Nikon Instruments, Shanghai, China) and SEM and micro-hardness examination using a D/MAX-2400X optical Brinell–Rockwell–Vickers hardness tester (Rigaku Beijing Corporation, Beijing, China) with a 294 N load and 30 s dwell time. For each specimen, six hardness tests were performed. The primary particle size or grain size, d, was calculated by:
 $$d = \left( {\sum {{{2\sqrt {{{{A_i}} \mathord{\left/ {\vphantom {{{A_i}} \pi }} \right. \kern-\nulldelimiterspace} \pi }} } \mathord{\left/ {\vphantom {{2\sqrt {{{{A_i}} \mathord{\left/ {\vphantom {{{A_i}} \pi }} \right. \kern-\nulldelimiterspace} \pi }} } N}} \right. \kern-\nulldelimiterspace} N}} } \right)\quad ,$$
where A i are the areas of each primary particle or grain, and N is the total number of the primary particles or grains. Subsequently, the composite specimens were solutionized at 490 °C for 1 h and then water-quenched. The solutionized specimens were observed on the OM to analyze the degree of plastic deformation that occurs during the thixoforming process. Energy-dispersive spectroscopy (EDS) was utilized to examine the compositions. To study the interfacial products, the SiCp were extracted from the composite using an electrochemical dissolution method. The used electrolyte contains 30 vol% of HNO3 and 70 vol% of distilled water, and the voltage and current were maintained at 7 V D.C. and 5 A, respectively. The extracted SiCp were then observed by the SEM and examined by a D8 ADVANCE X-ray diffractometer (Bruker, Tokyo, Japan). The measured density (ρm) was determined using Archimedes’ principle, and the theoretical density (ρt) was calculated by applying the rule of mixtures. The relative density (ρr) was determined by comparing ρm with ρt.
III. RESULTS AND DISCUSSION
A. Microstructural characterization
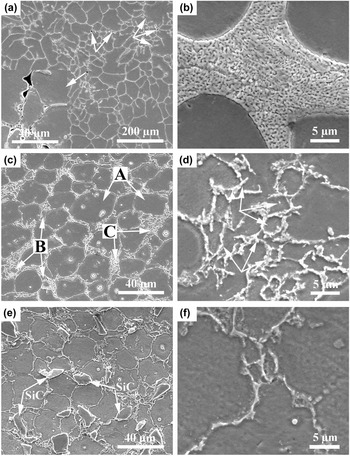
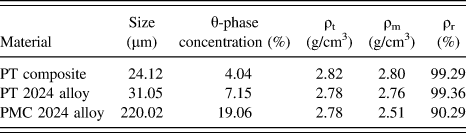
Figure 3 shows the microstructures of the PMC 2024 alloy, PT 2024 alloy, and PT SiCp/2024 Al-based composite. The microstructure of the PMC alloy consists of large equiaxed grains (220 µm) and continuously net-shaped interdendritic eutectic structures [Fig. 3(a)]. The white eutectic θ-Al2Cu phase (θ-phase) occupies the most part of the eutectics [Fig. 3(b)]. In addition, numerous porosities can be found between the dendrites [indicated by the arrows in Fig. 3(a)]. However, for the PT alloy, its microstructure is composed of fine spheroidal primary α-Al particles [indicated by the arrows A in Fig. 3(c)] and intergranular secondary solidified structures. The secondary solidified structures consist of the secondary α-Al phases [indicated by the arrows B in Fig. 3(c)] and eutectic structures [indicated by the arrows C in Fig. 3(c)]. The eutectic structures comprise the eutectic α-Al phase surrounded by the θ-phase, as clearly evidenced by the arrows shown in Fig. 3(d). Distinctly, the concentration of the white θ-phase is less than that of the PMC alloy. The variations of the θ-phase concentration, primary particle size, or grain size are more clearly indicated by the quantitative examination results shown in Table I. Furthermore, no porosity can be observed in the PT alloy [Fig. 3(c)], and the relative density of the PT alloy is obviously higher than that of the PMC alloy [Table I]. The microstructure of the PT composite is similar to that of the PT alloy except the SiCp that distribute homogeneously in the secondary solidified structures [Fig. 3(e)]. However, the quantitative examination results indicate that the primary particle size and eutectic concentration of the PT composite are smaller and less than those of the PT alloy [Table I]. Additionally, it should be noted that the eutectic structures of the PT alloy and composite are much finer than those of the PMC alloy, in addition to the decreased concentration of these structures.
SEM micrographs of (a and b) PMC alloy, (c and d) PT alloy, and (e and f) PT composite.

Variations of the primary particle size or grain size, θ-phase concentration, and material density.

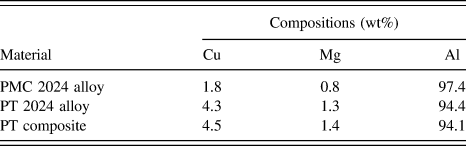
The microstructure of a single 2024 powder is composed of fine α-Al grains as well as intergranular eutectic θ-phase caused by the rapid solidification rate that occurs during the atomization preparation process. Reference Li, Chen, Zhang and Guan9 Owing to the Al–4.2Cu binary alloy that will experience a single α-Al phase interval during heating (considering only the two main elements of Al and Cu), most of the θ-phase dissolves into the neighboring α-Al grains during partial remelting. That is, the solubility of the alloying elements (such as Cu and Mg) in the primary particles is increased. This phenomenon can be evidenced by the EDS results shown in Table II. It indicates that Cu content in the primary particles of the PT alloy is higher than that in the grains of the PMC alloy. Increase of the Cu content in the primary particles must decrease its content in the liquid phase, which thus decreases the concentration of the θ-phase because Cu is indispensable for the formation of the θ-phase. Previous investigation on the semisolid microstructure evolution indicated that although the primary particles coarsen during partial remelting, the primary particle size is still much smaller because of the fine original 2024 Al powders. Reference Li, Chen, Zhang and Guan9 Hence, it is not difficult to understand that the primary particle size of the PT alloy is much finer than the grain size of the PMC alloy. 2024 Al alloy has a relatively large solidification interval (136 °C), a kind of interlocked dendrites networks can form during the solidification of PMC when solid fraction exceeds 10%, Reference Flemings14 preventing the liquid feeding and thus generating a large number of shrinkage porosities forming in the last solidified regions [Fig. 3(a)]. However, thixoforming can decrease or even eliminate the shrinkage porosities due to the good feeding ability to shrinkage and the solidification under pressure applied during thixoforming. Reference Kirkwood15 During thixoforming, the secondary α-Al phases are prone to attach to the surfaces of the primary α-Al phases because both of them are the same phase. Subsequently, the fine equiaxed secondary α-Al phases nucleate in the liquid far away from the primary α-Al particles if the conditions required for heterogeneous nucleation are attained. Finally, the solidification of the residual liquid is completed through a eutectic reaction. This secondary solidification behavior can prevent the formation of interlocked dendrites networks and thus enhances the shrinkage-feeding ability. According to the study from Flemings, Reference Flemings14 for the pressurized solidification of a non-dendritic semi-solid ingot with a solid fraction of 40%, it is behaving as a liquid-like slurry when a shear stress of less than 2 × 10⁻⁴ MPa is applied. That is the fine spheroidal primary particles are more beneficial for liquid penetration for feeding under the condition that the pressure is applied during thixoforming. Moreover, the liquid fraction of a semi-solid ingot is within 40–60%, which is apparently lower than the full liquid solidification of PMC, decreasing the generated possibility of shrinkage porosities. Therefore, the microstructure compactness of the PT alloy is superior to that of the PMC alloy. In addition, solidification under pressure can bring significant refinement in microstructure caused by the improved heat transfer across the interface between the solidified shell and mold wall and increased cooling rate. Reference Sukumaran, Ravikumar, Pillai, Rajan, Ravi, Pillai and Pai16 Consequently, the secondary solidified structures of the PT alloy, especially the eutectic structures, are significantly refined compared with the PMC alloy. From the above standpoints, the effects of PT technology on the resulting microstructure evolution (including the refinement of the eutectic structures, decrease of the eutectic concentration, enhancement of the microstructure compactness, and formation of the fine spheroidal primary α-Al particles) can be well interpreted.
Compositions of the grains or primary α-Al particles of the used materials.

The incorporation of SiCp into the matrix alloy must result in three effects during partial remelting. Reference Cai, Tan, Shen and Su17 First, the SiCp can split the neighboring α-Al particles from each other, decreasing the coarsening rate because the roles of coalescence and Ostwald ripening are inhibited. Second, the microstructural evolution rate is delayed during partial remelting because of lower thermal conductivity of SiCp. It can be expected that the coarsening stage of the PT composite is relatively lagged behind that of the PT alloy, and thus the delayed microstructural evolution rate decreases the size of the primary particles. Third, the effective liquid fraction of the composite is less than that of the PT alloy because of the incorporation of 10 vol% SiCp to the matrix, decreasing the eutectic concentration. Based on these standpoints, the decrease of the primary particle size and eutectic structures in the PT composite can be well interpreted.
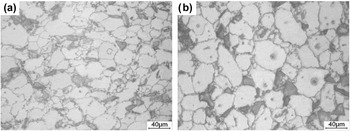
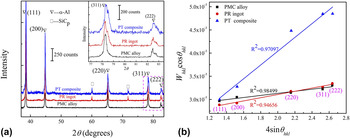
According to the study from Chen et al., Reference Chen, Huang, Huang, Ma and Hao18 plastic deformation occurred during thixoforming of AZ63 alloy. It can be expected that recrystallization can operate during the heat treatment of a previously deformed alloy. Therefore, to verify if plastic deformation occurs during thixoforming of the PT SiCp/2024 Al-based composite, the composite specimens were solutionized for 1 h at 490 °C and then observed by OM. As shown by Fig. 4(a), the microstructure of the solutionized composite consists of two kinds of grains (including large and small ones), and the average grain size (11.46 µm) is obviously smaller than the primary particle size (24.12 µm) [Fig. 4(b)]. This implies that the original large-sized primary particles become relatively small ones through recrystallization and the plastic deformation actually occurs during thixoforming. It is well known that plastic deformation must generate dislocations. The resulting dislocation density (ρ) can be examined through analyzing the X-ray diffractograph because the strain from the plastic deformation can broaden the peaks of diffractograph. Figure 5(a) shows the X-ray diffractograms of the partially remelted composite (PR) ingot, PT composite, and PMC alloy. It indicates that the peak broadening of full width at half-maximum (W hkl ) is the largest for the PT composite. According to the Williamson–Hall equation, the relationship between W hkl , Bragg angle (θ hkl ), strain (ε), and the crystallite size (d) can be expressed as Reference Williamson and Hall19
 $${W_{hkl}}\cos {\theta _{hkl}} = \left( {{{M\lambda } \mathord{\left/ {\vphantom {{M\lambda } d}} \right. \kern-\nulldelimiterspace} d}} \right) + 4\varepsilon \sin {\theta _{hkl}}\quad ,$$
where M is the shape factor (0.9), and λ is the wave length (0.15406 nm). Based on the results from Fig. 5(a), the fitted curves of the W hkl cos θ hkl as a function of 4 sin θ hkl are plotted in Fig. 5(b). The corresponding values of ε as well as d of the three specimens can be obtained from the slopes and intercepts of the plots, respectively. Applying these values, the corresponding values of ρ are calculated according to the following formula reported by Williamson and Smallman: Reference Williamson and Smallman20
 $$\rho = {{2\sqrt 3 \varepsilon } \mathord{\left/ {\vphantom {{2\sqrt 3 \varepsilon } {\left( {db} \right)}}} \right. \kern-\nulldelimiterspace} {\left( {db} \right)}}\quad ,$$
where b is the Burgers vector (0.286 nm). Reference Cheng, Zeng and Liu21 The calculated values of ρ for the PMC alloy, PR ingot, and PT composite are 5.24 × 10¹³, 7.31 × 10¹³, and 1.39 × 10¹⁴ m−2, respectively. That is, the PT composite has the highest dislocation density and this further demonstrates that plastic deformation indeed occurred during thixoforming.
OM micrographs of (a) the solutionized and (b) the as-PT composites.

(a) X-ray diffractograms and (b) Williamson–Hall plots of the different materials.

In summary, the effects of PT technology on the resulting microstructure evolution include the refinement of the eutectic structures, decrease of the eutectic concentration, enhancement of the microstructure compactness and plastic deformation, and formation of the fine spheroidal primary α-Al particles. Consequently, the microstructure of the PMC alloy consists of large equiaxed grains, continuously net-shaped interdendritic eutectic structures, and a large amount of porosities, but both the PT microstructures are composed of fine spheroidal primary particles and smaller concentration and finer size of the intergranular eutectic structures. The incorporation of SiCp into the matrix affects the microstructure by decreasing the coarsening rate and liquid amount and delaying the microstructural evolution rate, which results in the decreased primary particle size and eutectic concentration of the PT composite compared with the PT alloy.
B. Mechanical properties
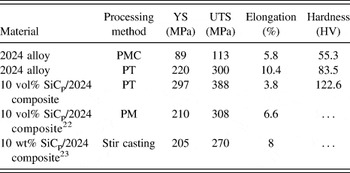
Table III shows the mechanical properties of the used materials. To feature the superiorities of the present PT technology, the results from other investigations are also included. It indicates that the PT alloy possesses superior mechanical properties over the PMC alloy, having the ultimate tensile strength (UTS) of 300 MPa, yield strength (YS) of 220 MPa, hardness of 83.5 HV, and elongation of 10.4%, increased by 165.5%, 147.2%, 51.0%, and 79.3%, respectively. The incorporation of 10 vol% SiCp to the 2024 alloy further brings considerable improvements, the UTS (388 MPa), YS (297 MPa), and hardness (122.6 HV) are increased by 29.3%, 35%, and 46.8%, respectively. However, the elongation (3.8%) is decreased by 63.5%. Moreover, the tensile strengths of the PT composite are significantly higher than those of the composites fabricated by PM Reference Hong, Kim, Huh, Suryanarayana and Chun22 and stir casting. Reference Su, Gao, Mao, Zhang, Liu, Lu and Lu23 This implies that the used PT technology exhibits larger superiority for fabricating SiCp/Al based composites with excellent mechanical properties.
Mechanical properties of the materials.

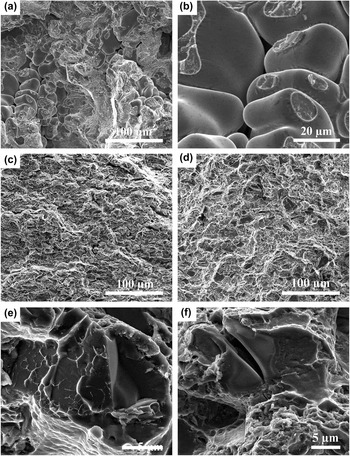
Figure 6 shows the fracture surfaces of the PMC alloy, PT alloy, and PT composite. The fracture surface of the PMC alloy is characterized by typical shrinkage porosities that always exist between the dendritic arms [Fig. 6(a)], as clearly evidenced by the magnified micrograph shown in Fig. 6(b). Inversely, the fracture surface of the PT alloy is free of porosities and comprises many small dimples [Fig. 6(c)]. Thus, the fracture surfaces further demonstrate that the microstructure of the PT alloy is actually more compact than that of the PMC alloy. From the above discussion, the primary α-Al particle size of the PT alloy is significantly smaller than the grain size of the PMC alloy, which is beneficial for strengthening the PT alloy according to the Hall–Petch relationship. Furthermore, PT technology changes the continuously net-shaped eutectic structures of the PMC alloy into the fine skeleton-shaped eutectic structures of the PT alloy. The eutectic θ-phase is a hard and fragile metallic compound (Al2Cu), and the large-sized θ structure or large concentration of θ-phase is detrimental to mechanical properties. Reference Emamy, Oliayee and Tavighi24 Thus, it can be expected that the decreases in the size and concentration of the θ-phase can improve the mechanical properties. Additionally, plastic deformation that occurs during thixoforming must generate work hardening, which is also conducive to strengthening the PT alloy. Therefore, the mechanical properties of a PT alloy is superior to those of a PMC alloy due to the enhanced microstructure compactness, decreased concentration of the deleterious θ-phase, refined eutectic structures, work hardening, and grain refinement.
Fractographs of (a and b) the PMC alloy, (c) PT alloy, and (d–f) PT composite.

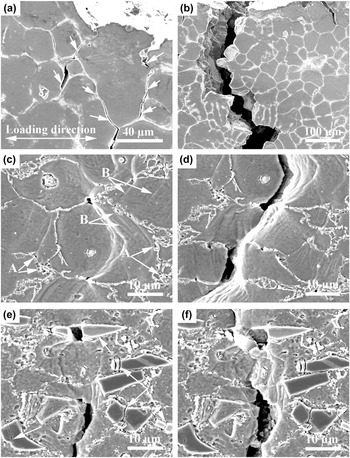
The microstructure of the PMC alloy is filled with many shrinkage porosities and a larger concentration of the θ-phase. During the tensile tests, the porosities and θ-phase located in the interdendritic regions are prone to provide sites for crack initiation and propagation, promoting the premature fracture of the alloy. This is evident in the micrographs obtained during the in situ tensile testing [Figs. 7(a) and 7(b)]. Cracks initiate preferentially in the interdendritic regions [indicated by the arrows in Fig. 7(a)], and then the alloy fractures by crack propagation along the interdendritic eutectic structures [Fig. 7(b)]. That is the fracture of the PMC alloy belongs to intergranular regime. However, crack propagation path of the PT alloy is different from that of the PMC alloy. During the tensile tests, some voids are generated in the secondary solidified structures because of the mismatch between the plastic deformation abilities in the soft α-Al phase and hard θ-phase [indicated by the arrows A in Fig. 7(c)]. Besides, the α-Al particles deform plastically, and a large number of parallel distributed slip bands are generated [indicated by the arrows B in Fig. 7(c)]. As the loading further increases, the generated voids do not expand obviously, and only the α-Al particles deform continuously, which presents a good elongation of the PT alloy. Finally, the alloy fractures through crack propagation across the deformed α-Al particles [Fig. 7(d)], which indicates that the fracture of the PT alloy changes into transgranular mode. Generally speaking, the tensile properties of a material fractured in a transgranular regime are better than those fractured in an intergranular regime. Therefore, the variations of the crack propagation path validate the correctness of above discussion that the mechanical properties of the PT alloy are superior to those of the PMC alloy.
SEM micrographs of (a and b) the PMC alloy, (c and d) PT alloy, and (e and f) PT composite from the in situ tensile testing.

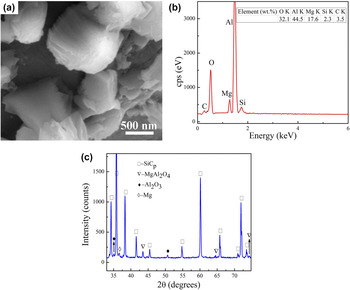
As discussed in the above section, the eutectic concentration of the PT composite is less compared with the PT alloy, which may be a reason why the mechanical properties of the PT composite are higher than those of the PT alloy. More importantly, the strengthening of composite should be attributed to the strengthening effects due to the incorporation of SiCp to the matrix, which has been evidenced by many investigations. Reference Arsenault, Wang and Feng25–Reference Sajjadi, Ezatpour and Torabi Parizi27 A generally accepted strengthening mechanism is load transfer (LT), which operates on the basis of the fact that load transfer from the soft matrix across the reinforcement/matrix interface to the hard reinforcements in the condition of external load contributes to the strengthening of composites. The key to fully achieving the strengthening role is dependent on the strength of the matrix–reinforcement interface. Figure 8(a) shows the surface morphologies of the SiCp extracted from the composite, which indicates that the octahedral-shaped reaction product is formed on the surfaces of the SiCp. The EDS result indicates that the octahedral-shaped product is rich in elemental O, Al, and Mg [Fig. 8(b)]. The XRD result of the SiCp reveals that the diffraction peaks of Al2O3 and elemental Mg are generated besides forming the reaction product of MgAl2O4 [Fig. 8(c)]. Shi et al. Reference Shi, Yang, Lee, Zhang, Lee and Wu28 reported that the oxidized SiCp can react with the elements existed in the matrix during processing according to the following equations:
 $$4{\rm{Al}} + 3{\rm{Si}}{{\rm{O}}_2} \to 2{\rm{A}}{{\rm{l}}_2}{{\rm{O}}_3} + 3{\rm{Si}}\quad {\rm{.}}$$
 $$3{\rm{Mg}} + 4{\rm{A}}{{\rm{l}}_2}{{\rm{O}}_3} \to 3{\rm{MgA}}{{\rm{l}}_2}{{\rm{O}}_4} + 2{\rm{Al}}\quad {\rm{.}}$$
SEM micrographs of (a) SiCp extracted from the composite, (b) EDS spectrum, and (c) X-ray diffractogram of SiCp.

It can be found that Al2O3 is an intermediate reaction product. Thus, the octahedral-shaped interfacial product of MgAl2O4 is developed at the SiCp/Al interface. MgAl2O4 product can improve the interface bonding, which is beneficial for fully achieving the load-transfer ability.
The YS of composite σc can be predicted by load-transfer strengthening mechanism on the basis of a modified shear lag (MSL) model: Reference Nardone and Prewo26
 $${\sigma _{\rm{c}}} = {\sigma _{\rm{m}}}\left[ {{{{V_{\rm{c}}}\left( {S + 2} \right)} \mathord{\left/ {\vphantom {{{V_{\rm{c}}}\left( {S + 2} \right)} {2 + {V_{\rm{m}}}}}} \right. \kern-\nulldelimiterspace} {2 + {V_{\rm{m}}}}}} \right]\quad ,$$
where σm is the YS of the matrix alloy, and S is the aspect ratio of SiCp (1.62). V
c and V
m are the volume fractions of SiCp (10%) and matrix (90%), respectively. Substituting these parameters into Eq. (6), a predicted value of 237.820 MPa is obtained, which is much lower than the experimental result of 297 MPa. Thus, MSL model underestimates the strength increase of composite. The reason is that the changed microstructure of the matrix (including enhanced dislocation density and decreased grain size) due to SiCp incorporation is not considered in the theoretical calculation. It was verified that the different expansion coefficients between the reinforcements and the matrix can induce higher dislocation density in the matrix alloy on cooling from processing temperature to room temperature.
Reference Arsenault, Wang and Feng25,Reference Arsenault, Shi, Feng and Wang29
The increased dislocation density caused by thermal mismatch (TM) contributes much strength increment over the matrix alloy. Moreover, geometrically necessary dislocations (GND) generate because of the inability of hard SiCp to accommodate the large strain gradient that develops in the soft matrix during the tensile tests. The increased GND is also beneficial for strengthening the composites.
Reference Sekine and Chen30
Additionally, as discussed in the above section, the size of the primary particles in the composite is finer than that in the unreinforced alloy. Grain refinement (GR) can increase the YS of materials on the basis of the Hall–Petch equation.
Reference Miller and Humphreys31
Ramakrishnan
Reference Ramakrishnan32
reported that the rules of addition of different strengthening contributions can be used to predict the composite strength when several strengthening mechanisms operate simultaneously. Thus, the YS of composite
 $\sigma _{\rm{c}}^{\rm{*}}$
can be predicted by a model considering the strengthening mechanisms of LT, TM, GND, and GR, which is expressed as
 $$\sigma _{\rm{c}}^{\rm{*}} = \;\left( {{\sigma _{\rm{m}}} + \Delta {\sigma _{{\rm T}{\rm M}}} + \Delta {\sigma _{{\rm{GND}}}} + \Delta {\sigma _{{\rm{GR}}}}} \right)\left[ {{{{V_{\rm{c}}}\left( {S + 2} \right)} \mathord{\left/ {\vphantom {{{V_{\rm{c}}}\left( {S + 2} \right)} {2 + {V_{\rm{m}}}}}} \right. \kern-\nulldelimiterspace} {2 + {V_{\rm{m}}}}}} \right]\quad ,$$
where ΔσTM, ΔσGND, and ΔσGR are the strength contributions of TM, GND, and GR, respectively. The YS increment ΔσTM caused by TM can be calculated according to Reference Zhang and Chen33
 $$\Delta {\sigma _{{\rm T}{\rm M}}} = \sqrt 3 a{G_{\rm{m}}}b\sqrt {{{12{V_{\rm{c}}}\Delta \alpha \Delta T} \mathord{\left/ {\vphantom {{12{V_{\rm{c}}}\Delta \alpha \Delta T} {\left[ {b{d_{\rm{c}}}\left( {1 - {V_{\rm{c}}}} \right)} \right]}}} \right. \kern-\nulldelimiterspace} {\left[ {b{d_{\rm{c}}}\left( {1 - {V_{\rm{c}}}} \right)} \right]}}} \quad ,$$
where a is the strengthening coefficient (1.25), Reference Hansen34 G m is the shear modulus (26.4 GPa), Reference Arsenault, Wang and Feng25 Δα is the difference in the coefficients of the thermal expansion between the matrix and SiCp (19.1 × 10⁻⁶ K−1), Reference Cheng, Zeng and Liu21 ΔT is the difference between the processing temperature and room temperature (600 K), and d c is the average particle size of SiCp. The contribution in the YS ΔσGND can be calculated by Reference Sekine and Chen30
 $$\Delta {\sigma _{{\rm{GND}}}} = 2{G_{\rm{m}}}{V_{\rm{c}}}{\varepsilon _{\rm{c}}}{{\left( {1 - \nu } \right)} \mathord{\left/ {\vphantom {{\left( {1 - \nu } \right)} {\left( {1 - 2\nu } \right)}}} \right. \kern-\nulldelimiterspace} {\left( {1 - 2\nu } \right)}}\quad ,$$
where ν is Poisson’s ratio (0.33)30 and εc is yield strain of composite (0.002). The increment of the YS ΔσGR resulting from GR is calculated by Reference Miller and Humphreys31
 $$\Delta {\sigma _{{\rm{GR}}}} = K\mathop {{d_{\rm{m}}}}\nolimits^{ - {1 \mathord{\left/ {\vphantom {1 2}} \right. \kern-\nulldelimiterspace} 2}} \quad ,$$
where K is a coefficient (0.1 M N/m3/2), Reference Miller and Humphreys31 and d m is the primary particle size.
Substituting the contributed values of ΔσTM, ΔσGND, and ΔσGR calculated from Eqs. (8)–(10) into Eq. (7), a predicted YS of 315.722 MPa is obtained. However, the calculated value is higher than the actual experimental value of 297 MPa. The reason may be attributed to the degradation of the aforementioned strengthening effects because of the premature failure of SiCp caused by stress concentration during the tensile tests which is not considered. The strengthening mechanisms of LT and GND not only strengthen the composites but also increase the stress concentration at the SiCp/Al interface. Besides, the stress concentration degree increases gradually as the tensile test continues. The SiCp/Al interface will debond or the SiCp crack if the stress exceeds a critical value. The fractograph of PT composite is composed of many visible SiCp [Fig. 6(d)]. The high magnification micrographs indicate that the behaviors of the visible SiCp include two kinds, debonding of SiCp/Al interfaces [Fig. 6(e)] and cracking of SiCp [Fig. 6(f)]. These failed behaviors are also evident in the micrographs obtained from the in situ tensile specimens shown in Figs. 7(e) and 7(f). Some failed SiCp are observed near the highly localized deformed α-Al particles [indicated by the arrows in Fig. 7(e)]. The formation of the failed SiCp increases the points of crack initiation and propagation, as evidenced by Fig. 7(f), cracks resulting from the failed SiCp propagate across the α-Al particles during further loading, leading to the fracture of composite. The failed SiCp are unable to strengthen the composite, resulting in the less-effective strengthening effects and thus weakening the strength of composite. Therefore, to accurately predict the YS of composite, a failure fraction V f is proposed and expressed as
 $${V_{\rm{f}}} = {V_{{\rm{de}}}} + {V_{{\rm{cr}}}}\quad ,$$
where V
de and V
cr are the fractions of debonded and cracked SiCp, respectively. Thus, an effective fraction
 $V_{\rm{c}}^{\rm{*}}$
of SiCp is expressed as
 $$V_{\rm{c}}^* = {V_{\rm{c}}} - {V_{\rm{f}}}\quad .$$
Substituting Eq. (12) into Eq. (7) by replacing V
c with
 $V_{\rm{c}}^{\rm{*}}$
, the predicted YS of composite
 ${\sigma ^{**}}$
can be obtained by a novel model considering the failure fraction of SiCp, in addition to the strengthening mechanisms of LT, TM, GND, and GR, which is given by
 $$\sigma _{\rm{c}}^{**} = \;\left( {{\sigma _{\rm{m}}} + \Delta \sigma _{{\rm{{\rm T}{\rm M}}}}^ * + \Delta \sigma _{{\rm{GND}}}^ * + \Delta {\sigma _{{\rm{GR}}}}} \right)\left[ {{{V_{\rm{c}}^*\left( {S + 2} \right)} \mathord{\left/ {\vphantom {{V_{\rm{c}}^*\left( {S + 2} \right)} {2 + {V_{\rm{m}}}}}} \right. \kern-\nulldelimiterspace} {2 + {V_{\rm{m}}}}}} \right]\quad .$$
The Weibull probability distribution function was widely used to make predictions on brittle reinforcement failure in ductile matrix, Reference Lewis and Withers35,Reference Li, Ghosh, Richmond, Weiland and Rouns36 and thus the probability of SiCp fracture F cr is calculated by
 $${F_{{\rm{cr}}}} = 1 - \exp \left[ { - \left( {{V \mathord{\left/ {\vphantom {V {{V_0}}}} \right. \kern-\nulldelimiterspace} {{V_0}}}} \right){{\left( {{{{\sigma _{\rm{p}}}} \mathord{\left/ {\vphantom {{{\sigma _{\rm{p}}}} {{\sigma _{\rm{0}}}}}} \right. \kern-\nulldelimiterspace} {{\sigma _{\rm{0}}}}}} \right)}^m}} \right]\quad ,$$
where V is the volume of a SiC particle, and σp is the average tensile stress in SiCp. m is the Weibull modulus (m = 3), and V 0 (1.5 × 10⁻¹⁴ m3) and σ0 (1.8 GPa) are the reference volume and fracture stress of SiCp, respectively. Reference Clegg, Horsfall, Mason and Edwards37 The study from Lee and Subramanian Reference Lee and Subramanian38 indicated that the stress in SiCp is probably 1.5 times the externally applied tensile stress, and the experimental results demonstrated that this is a reasonable first approximation. Reference Song and Xiao39 Thus, σp is regarded as 582 MPa in the present work. The SiCp volumes can be characterized by the probability function P(V), and thus the fraction of cracked SiCp V cr is calculated by Reference González and Llorca40
 $${V_{{\rm{cr}}}} = \int_{{V_{\min }}}^{{V_{\max }}} {P\left( V \right){F_{{\rm{cr}}}}\,{\rm{d}}V = \int_{{V_{\min }}}^{{V_{\max }}} {\left( {{{4V} \mathord{\left/ {\vphantom {{4V} {\mathop {{V_{{\rm{av}}}}}\nolimits^{\rm{2}} }}} \right. \kern-\nulldelimiterspace} {\mathop {{V_{{\rm{av}}}}}\nolimits^{\rm{2}} }}} \right)\exp \left( {{{ - 2V} \mathord{\left/ {\vphantom {{ - 2V} {{V_{{\rm{av}}}}}}} \right. \kern-\nulldelimiterspace} {{V_{{\rm{av}}}}}}} \right){F_{{\rm{cr}}}}\,{\rm{d}}V} } \quad ,$$
where V
min → V
max is the range of SiCp volumes, and
 ${V_{{\rm{av}}}} = d_{\rm{c}}^3$
represents the average volume of SiCp. The size of SiCp ranges from 6.181 µm to 49.095 µm. Correspondingly, the SiCp volumes of V
min and V
max are 1.236 × 10⁻¹⁶ m3 and 6.193 × 10⁻¹⁴ m3, respectively. The probability of SiCp debonding F
de is defined as
Reference Lee41
 $${F_{{\rm{de}}}} = 1 - \exp \left[ { - {{\left( {{{{\sigma _{\rm{p}}}} \mathord{\left/ {\vphantom {{{\sigma _{\rm{p}}}} P}} \right. \kern-\nulldelimiterspace} P}} \right)}^m}} \right]\quad ,$$
where P is the critical debonding stress and defined by Reference Clyne and Withers42,Reference Song, Xie and He43
 $$P = {{1.4{\tau _{\rm{d}}}} \mathord{\left/ {\vphantom {{1.4{\tau _{\rm{d}}}} {\left[ {n\coth \left( {nS} \right)} \right]}}} \right. \kern-\nulldelimiterspace} {\left[ {n\coth \left( {nS} \right)} \right]}}\quad ,$$
where n is a dimensionless constant, and τd is the critical debonding shear stress. n and τd can be calculated as follows
 $$n = {\left[ {{{{E_{\rm{m}}}} \over {{E_{\rm{c}}}\left( {1 + \nu } \right)\ln \left( {{1 \mathord{\left/ {\vphantom {1 {{V_{\rm{c}}}}}} \right. \kern-\nulldelimiterspace} {{V_{\rm{c}}}}}} \right)}}} \right]^{{1 \mathord{\left/ {\vphantom {1 2}} \right. \kern-\nulldelimiterspace} 2}}}\quad ,$$
 $${\tau _{\rm{d}}} = {{{W_{{\rm{ad}}}}{{\left( {{{{E_{\rm{m}}}} \mathord{\left/ {\vphantom {{{E_{\rm{m}}}} {{E_{\rm{c}}}}}} \right. \kern-\nulldelimiterspace} {{E_{\rm{c}}}}}} \right)}^{{1 \mathord{\left/ {\vphantom {1 2}} \right. \kern-\nulldelimiterspace} 2}}}} \mathord{\left/ {\vphantom {{{W_{{\rm{ad}}}}{{\left( {{{{E_{\rm{m}}}} \mathord{\left/ {\vphantom {{{E_{\rm{m}}}} {{E_{\rm{c}}}}}} \right. \kern-\nulldelimiterspace} {{E_{\rm{c}}}}}} \right)}^{{1 \mathord{\left/ {\vphantom {1 2}} \right. \kern-\nulldelimiterspace} 2}}}} {{\delta ^{ - 1}}}}} \right. \kern-\nulldelimiterspace} {{\delta ^{ - 1}}}}\quad ,$$
where E m (70 GPa) and E c (460 GPa) are the elastic modulus of matrix and SiCp, respectively. Reference Srivatsan, Sudarshan and Lavernia44 W ad is the work of adhesion of SiCp/Al interface (743 mJ/m2), Reference Rohatgi, Ray, Asthana and Narendranath45 and δ−1 (0.5 nm) is a constant. Reference Song, Xie and He43 The fraction of debonded SiCp V de can be expressed as Reference Ju and Lee46
 $${V_{{\rm{de}}}} = {V_{\rm{c}}}{F_{{\rm{de}}}}\quad .$$
Substituting Eq. (16) into Eq. (20), V de is calculated by
 $${V_{{\rm{de}}}} = {V_{\rm{c}}}\left\{ {1 - \exp \left[ { - {{\left( {{{{\sigma _{\rm{p}}}} \mathord{\left/ {\vphantom {{{\sigma _{\rm{p}}}} P}} \right. \kern-\nulldelimiterspace} P}} \right)}^m}} \right]} \right\}\quad .$$
The calculated results of V
cr = 0.756%, V
de = 0.938%, V
f = 1.694%,
 $V_{\rm{c}}^* = 8.306\%$
, and
 $\sigma _{\rm{c}}^{**} = 299.920$
MPa are obtained, indicating that the predicted YS
 $\left( {\sigma _{\rm{c}}^{**}} \right)$
of the PT composite is in good agreement with the experimental result (297 MPa) if the failure of SiCp is considered. Therefore, the failed SiCp indeed weaken the strengthening effects, and the YS of composite can be well predicted by a novel strengthening model concerning the negative effects of the damaged reinforcements.
IV. CONCLUSIONS
-
(1) PT technology exhibited larger superiority for fabricating composite with high mechanical properties.
-
(2) The PMC alloy comprised large equiaxed grains, continuously net-shaped interdendritic eutectic structures, and a large amount of shrinkage porosities. However, both the PT materials possessed finer spheroidal primary particles and smaller concentration and finer size of the intergranular eutectic structures. Moreover, the primary particle size and eutectic concentration of the PT composite were smaller and less than those of the PT alloy.
-
(3) The PT alloy exhibited significant improvements in the mechanical properties compared with the PMC alloy, with UTS, YS, hardness, and elongation increasing by 165.5%, 147.2%, 51.0%, and 79.3%, respectively, which were ascribed to the enhanced microstructure compactness and work hardening, decreased concentration of the deleterious θ-phase, refined eutectic structures, and fine α-Al particles.
-
(4) The incorporation of SiCp to the PT alloy further brought considerable improvements, the UTS, YS, and hardness were increased by 29.3%, 35%, and 46.8%, respectively, compared with the PT alloy. Besides the strengthening role caused by the decreased eutectic concentration, the strengthening effects due to LT, TM, GND, and GR are the main mechanisms responsible for the excellent mechanical properties of the PT composite.
-
(5) The fracturing of the PT alloy, different from the intergranular mode of the PMC alloy, is transgranular regime. The fracturing of composite is caused by the cracked SiCp and debonded SiCp/Al interface because of stress concentration.
-
(6) A modified model considering both additive and synergistic strengthening effects of LT, TM, GND, and GR and failure fraction of SiCp was proposed, and the predicted result coincided well with the experimental value.
ACKNOWLEDGMENTS
The authors wish to express thanks for the financial support provided by the Basic Scientific Fund of Gansu University (Grant No. G2014-07), the Program for New Century Excellent Talents of the University of China (Grant No. NCET-10-0023), and the Program for Hongliu Outstanding Youth of the Lanzhou University of Technology.