1. Introduction
The Sonapahar area is situated in the West Khasi Hills district of Meghalaya, NE India, and is a part of the Shillong-Meghalaya Gneissic Complex (SMGC), also known as the Shillong Plateau. The SMGC belongs to the NE portion of India, with the Garo, Khasi and Jaintia hills outlining the southern, northern and western parts of the plateau, respectively. The SMGC is still one of the least-known granulite belts in the world, as little attention has been paid to the basement rocks (Precambrian Litho Units) of northeastern India. This deficiency motivated us to conduct electron microprobe (EPMA) monazite dating of the granulites in the study area to determine the ages of the metamorphic events, i.e., whether they are Palaeoproterozoic or Mesoproterozoic, for correlation of the metamorphic history with global metamorphic events. Different types of amphibolite- to granulite-facies mineral assemblages have been identified in the Sonapahar area of the SMGC, which reflects prograde metamorphism from the greenschist to the granulite facies. A preliminary note on the gneissic complex of the Nongmaweit–Rambrai–Nongstoin Plateau was provided by Ghosh (Reference Ghosh1952), while Banerjee (Reference Banerjee1955) noted the petrology of the metamorphites around Sonapahar. Ghosh & Saha (Reference Ghosh and Saha1954) and Lal et al. (Reference Lal, Ackermand, Seifert and Haldar1978) reported sapphirine-bearing granulites from Sonapahar. The exposure of the basement rocks in the SMGC is limited; thus, granulite-facies rocks are reported only from some parts of the plateau, namely, the Sonapahar area (Lal et al. Reference Lal, Ackermand, Seifert and Haldar1978; Chatterjee et al. Reference Chatterjee, Mazumder, Bhattacharya and Saikia2007; Dwivedi, Reference Dwivedi and Tiwari2011; Dwivedi & Theunuo, Reference Dwivedi and Theunuo2013, Reference Dwivedi and Theunuo2017), Goalpara Hills (Chatterjee et al. Reference Chatterjee, Mazumder, Bhattacharya and Saikia2007, Reference Chatterjee, Bhattacharya, Duarah and Mazumdar2011) and Patharkhang (Dwivedi & Theunuo, Reference Dwivedi and Theunuo2011).
Monazite dating with an electron microprobe has been performed based on the total abundances of Th, U and Pb (Suzuki & Adachi, Reference Suzuki and Adachi1991, Reference Suzuki and Adachi1994; Montel et al. Reference Montel, Foret, Veschambre, Christian and Provost1996; Braun et al. Reference Braun, Montel and Nicollet1998; Williams et al. Reference Williams, Jercinovic and Terry1999, Reference Williams, Jercinovic and Hetherington2007; Suzuki & Kato, Reference Suzuki and Kato2008; Hazarika et al. Reference Hazarika, Mishra, Ozha and Pruseth2017). The EPMA monazite dating technique can identify the preserved history of polyphase metamorphic events for the comparison of the metamorphic evolution with past geological records. Different methodologies are applied to extract the history of the rock, which provide crucial datasets constraining the evolution of the SMGC. The evolutionary records of granulites are preserved in the form of different mineral assemblages and associations in different rock types, fabrics and textural relationships. The EPMA monazite dating of the metapelitic granulites of the SMGC reveals predominantly Mesoproterozoic ages of 1621–1596 Ma for a post-S1/pre-S2 stage of metamorphism, with poorly constrained 1141–946 Ma ages and more significant ages of 649–524 Ma, which are considered syn-S2 and post-S2 stages of metamorphism, respectively (Chatterjee et al. Reference Chatterjee, Mazumder, Bhattacharya and Saikia2007, Reference Chatterjee, Bhattacharya, Duarah and Mazumdar2011; Chatterjee, Reference Chatterjee2017). U–Pb zircon dating of granite gneiss basement rocks from the central SMGC yielded Neoarchaean to Neoproterozoic ages, which range from ∼2600 to ∼1100 Ma (Bidyananda & Deomurari, Reference Bidyananda and Deomurari2007; Kumar et al. Reference Kumar, Rino, Hayasaka, Kimura, Raju, Terada and Pathak2017). Yin et al. (Reference Yin, Dubey, Webb, Kelty, Grove, Gehrels and Burgess2010) found three stages of granite intrusion at ∼1.6 Ga, ∼1.1 Ga and ∼0.5 Ga in the central SMGC, which were revealed by the same analytical technique. In the present study, an attempt has been made to meticulously study the granulites of Sonapahar based on the most recent methodology (monazite dating, bulk composition modelling and P–T conditions) employed for the interpretation of its metamorphic evolution and correlation with global tectonics.
2. Geological setting
The SMGC is located in the northeastern extension of the Indian Peninsular Precambrian shield, and comprises the NE–SW-trending Proterozoic Shillong basin with metasedimentary rocks of the Shillong Group (Bidyananda & Deomurari, Reference Bidyananda and Deomurari2007; Yin et al. Reference Yin, Dubey, Webb, Kelty, Grove, Gehrels and Burgess2010) (Fig. 1). The area around Sonapahar (latitude 25° 39′ N to 25° 42′ N and longitude 91° 01′ E to 91° 07′ E) is located along the eastern part of the Nongchram fault (Gupta & Sen, Reference Gupta and Sen1988; Golani, Reference Golani1991) (Fig. 1). This area lies in the central part of the SMGC and is ∼60 km west of the town of Shillong (Fig. 2).
(a) Inset map showing the location of the Shillong-Meghalaya Gneissic Complex (SMGC) in India. (b) Map showing the different segments and tectonic lineaments of NE India (Sengupta & Agarwal, Reference Sengupta and Agarwal1998, modified after Anon, 1974). Rectangle represents the SMGC located in the western part of NE India. (c) Regional geological map of the SMGC (after Mazumdar, Reference Mazumdar1976). The geochronological dates for the SMGC are from: BD,07 – Bidyananda & Deomurari (Reference Bidyananda and Deomurari2007); C,07 – Chatterjee et al. (Reference Chatterjee, Mazumder, Bhattacharya and Saikia2007); Y,10 – Yin et al. (Reference Yin, Dubey, Webb, Kelty, Grove, Gehrels and Burgess2010); C,11 – Chatterjee et al. (Reference Chatterjee, Bhattacharya, Duarah and Mazumdar2011); K,17 – Kumar et al. (Reference Kumar, Rino, Hayasaka, Kimura, Raju, Terada and Pathak2017); B,19 – Borah et al. (Reference Borah, Hazarika, Mazumdar and Rabha2019).

Geological map of Sonapahar (rectangular area in Fig. 1c) showing different rock types present in the study area.

The SMGC is surrounded in the north by the Oldham and Brahmaputra Valley faults and in the south by the N-dipping Dauki fault and its related fold system, while the western portion of the plateau is bounded by the N–S Jamuna fault; along the eastern side, it is bordered by the Indo-Myanmar mobile belt and Kopili rift, which separate the plateau from the Mikir Hills (Evans, Reference Evans1964; Desikachar, Reference Desikachar1974; Acharyya et al. Reference Acharyya, Mitra, Nandy, Mitra, Acharyya, Datta, Ghosh, Nandy, Roy, Vidyadharan, Venktaraman, Srivastava, Bhattacharyya, Joshi, Jena and Goswami1986; Nandy, Reference Nandy, Mitra, Acharyya, Datta, Ghosh, Nandy, Roy, Vidyadharan, Venktaraman, Srivastava, Bhattacharyya, Joshi, Jena and Goswami1986, Reference Nandy2001; Gupta & Sen, Reference Gupta and Sen1988; Rajendran et al. Reference Rajendran, Rajendran, Duarah, Baruah and Earnest2004; Yin et al. Reference Yin, Dubey, Webb, Kelty, Grove, Gehrels and Burgess2010) (Fig. 1). The SMGC is separated from the main Indian Peninsular shield by the Cretaceous Rajmahal volcanic rocks and Tertiary Ganges–Brahmaputra alluvium; the plateau covers an area of ∼47000 km2 (Fig. 1). Desikachar (Reference Desikachar1974) proposed that the SMGC is part of the eastern extension of the Chhotanagpur gneissic complex (CGC) and the Central Indian Tectonic Zone (CITZ) of central India. The ENE–WSW-trending CITZ was formed by the collision and suturing of the North Indian Block (NIB) and South Indian Block (SIB) at ∼1.5 Ga due to the subduction of the SIB under the NIB in the Indian Peninsular shield (Bhowmik et al. Reference Bhowmik, Wilde, Bhandari, Pal and Pant2012, Reference Bhowmik, Wilde, Bhandari and Sarbadhikari2014). Some authors have also suggested that the NIB was subducted southward below the SIB (Yedekar et al. Reference Yedekar, Jain, Nair and Dutta1990; Mishra et al. Reference Mishra, Singh, Tiwari, Gupta and Rao2000), and another proposal was double-sided subduction (Naganjaneyulu & Santosh, Reference Naganjaneyulu and Santosh2010). However, the northeastern part of the Indian Plate is subducting under the Tibetan Plateau from the north; in the same way, the Burmese Plate is also over-riding it from the east. Thus, the Shillong Plateau is a mobile foreland spur, which tends to resist the Burmese block that is moving westward (Desikachar, Reference Desikachar1974).
The Proterozoic metasedimentary rocks and the basement gneisses are composed of amphibolite- to granulite-facies rocks derived from Neoarchaean–Palaeoproterozoic gneissic rocks (Chatterjee, Reference Chatterjee2017 and references therein). The Sonapahar area is composed of granulite-facies metapelites and quartzofeldspathic gneisses, including sillimanite-bearing gneisses, basic granulites, amphibolites and granite gneisses (Lal et al. Reference Lal, Ackermand, Seifert and Haldar1978; Nandy, Reference Nandy2001; Dwivedi & Theunuo, Reference Dwivedi and Theunuo2013, Reference Dwivedi and Theunuo2017). However, the Sonapahar area has a significant occurrence of metapelitic granulites and has experienced multiple phases of deformation (Chatterjee et al. Reference Chatterjee, Mazumder, Bhattacharya and Saikia2007; Chatterjee, Reference Chatterjee2017). There are three stages of metamorphism occurring in the metapelites, and they were metamorphosed along a counter-clockwise P–T path (Chatterjee et al. Reference Chatterjee, Mazumder, Bhattacharya and Saikia2007).
The SMGC was assembled with the Columbia, Rodinia and Gondwana supercontinents during different periods of tectonic orogeny. Rodinia was an accretionary product of fragmented plates from the Columbia supercontinent, with rifting starting in Mesoproterozoic times (∼1.5 Ga). Three episodes of magmatism (∼ 1.5, ∼ 1.0 and ∼ 0.5 Ga) were reported from the SMGC based on U–Pb zircon dating (Yin et al. Reference Yin, Dubey, Webb, Kelty, Grove, Gehrels and Burgess2010), which are consistent with the metamorphic events demarcated by monazite dating (Chatterjee et al. Reference Chatterjee, Mazumder, Bhattacharya and Saikia2007). This correlation suggests that the magmatism and metamorphic events were related to each other. A chemical age of 1.15–0.93 Ga reveals the SMGC was situated adjacent to East Antarctica (Prydz Bay) during the Rodinia amalgamation (Borah et al. Reference Borah, Hazarika, Mazumdar and Rabha2019). The SMGC was located to the north of the NW-trending Eastern Ghats orogeny, and it was considered a part of the Rodinia supercontinent (∼1.0 Ga), which was produced by India–Antarctica collision (Dalziel, Reference Dalziel1991; Hoffman, Reference Hoffman1991; Moores, Reference Moores1991; Li et al. Reference Li, Bogdanova, Collins, Davidson, Waele, Ernst, Fitzsimons, Fuck, Gladkochub, Jacobs, Karlstrom, Lu, Natapov, Pease, Pisarevsky, Thrane and Vernikovsky2008). The high-grade rocks of the Eastern Ghats Mobile Belt of the Indian Plate correlated with the Napier and Rayner Province in East Antarctica during the Grenvillian orogeny (∼1.0 Ga) (Mezger & Cosca, Reference Mezger and Cosca1999; Boger et al. Reference Boger, Carson, Wilson and Fanning2000; Fitzsimons, Reference Fitzsimons2000). The Rodinia supercontinent achieved the highest strength of accretion during the Grenvillian orogeny (∼1.0 Ga), after which drifting was again started from ∼0.75 Ga, finally forming the Gondwana supercontinent during Neoproterozoic times (∼0.5 Ga) (Rogers & Santosh, Reference Rogers and Santosh2002; Chatterjee et al. Reference Chatterjee, Mazumder, Bhattacharya and Saikia2007, Reference Chatterjee, Bhattacharya, Duarah and Mazumdar2011; Li et al. Reference Li, Bogdanova, Collins, Davidson, Waele, Ernst, Fitzsimons, Fuck, Gladkochub, Jacobs, Karlstrom, Lu, Natapov, Pease, Pisarevsky, Thrane and Vernikovsky2008; Yin et al. Reference Yin, Dubey, Webb, Kelty, Grove, Gehrels and Burgess2010; Kumar et al. Reference Kumar, Rino, Hayasaka, Kimura, Raju, Terada and Pathak2017; Borah et al. Reference Borah, Hazarika, Mazumdar and Rabha2019). This orogeny experienced significant magmatism and contraction during the amalgamation of Eastern Gondwana (0.55–0.50 Ga) (Ghosh et al. Reference Ghosh, de Wit and Zartman2004; Collins et al. Reference Collins, Santosh, Braun and Clark2007; Biswal et al. Reference Biswal, de Waele and Ahuja2007). Several authors have suggested that the western margin of the Pan-African suture passing through Prydz Bay in Antarctica possibly passes through the SMGC (Fitzsimons, Reference Fitzsimons2000, Reference Fitzsimons, Yoshida, Windley and Dasgupta2003; Chatterjee et al. Reference Chatterjee, Mazumder, Bhattacharya and Saikia2007; Kelsey et al. Reference Kelsey, Clark and Hand2008). The SMGC and Prydz Bay belt witnessed their latest high-grade event and have a shared common Early Palaeozoic metamorphic history during the final stages of metamorphism related to the Pan-African collision (∼0.5 Ga). The Prydz Bay Pan-African suture continues through the SMGC in NE India (Chatterjee et al. Reference Chatterjee, Bhattacharya, Duarah and Mazumdar2011). According to Gupta & Sen (Reference Gupta and Sen1988), the SMGC lies along the direct continuation of the Ninety-East Ridge. They also considered that a major N–S-trending lineament called the Um-Ngot lineament that developed during Late Jurassic to Early Cretaceous times might constitute a location for neotectonic activity in the SMGC (Srivastava et al. Reference Srivastava, Guarino, Wu, Melluso and Sinha2019 and references therein). Additionally, the oblique northeastward counter-clockwise movement of the Indian Plate has produced severe compressional tectonics; hence, the SMGC is tectonically sensitive and seismically very active (Harijan et al. Reference Harijan, Sen, Sarkar, Das and Kanungo2003; Ramesh et al. Reference Ramesh, Kumar, Devi, Raju and Yuan2005).
3. Sample collection, preparation and analytical techniques
Geological mapping and the collection of 40 representative rock samples from the Sonapahar area were carried out during different courses of fieldwork. Representative samples of all available rock outcrops were collected. A Global Positioning System instrument (Garmin GPSMAP 78s) was used to record the locations (latitude/longitude) of the collected samples, and these data are presented in online Supplementary Material Table S1.
Thin-sections of all collected rock samples were prepared, and, after fine polishing, the slides were studied under a Leica petrological microscope (LEICA DM 2500 P). The detailed petrographic study revealed different types of mineral assemblages and textures. Based on the petrography, thin-sections of different important rocks were selected for further probe analysis.
We chose three samples (Sn-26, Sn-24 and Sn-11) for the electron microprobe analyses, which were carried out at the Geological Survey of India (GSI) laboratory in Faridabad, and IIT Kharagpur (CAMECA SX100 EPMA). The minerals were analysed with a CAMECA SX100 electron microprobe in Faridabad. Different accelerating voltages and standards were used for silicate analysis and monazite mineral dating. The polished thin-section was coated with a 40 nm layer of carbon for electron microprobe analysis using a LEICA-EM ACE200 carbon coating instrument. For silicate analysis, the accelerating voltage was 15 kV with a beam current of 10 nA and a beam diameter of 1 micron. Andradite was used as a natural silicate mineral to verify crystal positions using an internal standard (SP2-LiF, SP3-LPET, SP4-LTAP and SP5-PET) with wavelength dispersive (WD) spectrometers (SP#) in the CAMECA SX100 instrument. The standards used for different elements were Al (Al2O3), Si and Ca (CaSiO3), Ti (TiO2), Cr (Cr), Zn (Zn), Na (albite), K (orthoclase), Fe (Fe2O3), Mn (rhodonite), Mg (peridotite), Ba (BaSO4), F (CaF2), Na (NaCl) and P (apatite); a Ni pure metal standard was supplied by CAMECA-AMETEK, which was used for routine calibration and quantification. For monazite, the accelerating voltage was 20 kV with a beam current of 200 nA and a beam diameter of 2 microns. The counting times were 240 s (U and Pb), 120 s (Th and Y), 30 s (Pr, Sm, Gd and Dy), 20 s (La, Ce and Nd) and 10 s (Si, P and Ca); U was measured using U Mβ X-ray intensity with corrections performed for Th Mc interference. Interference correction was also performed for Th Mz and Y Lc3 overlap on Pb Mα X-ray intensity. Other X-ray lines were used for different elements: Kα (Si, P and Ca), Lα (Y, La and Ce), Lβ (Pr, Nd, Sm and Dy) and Mα (Th). Quantification of rare earth element (REE) analyses in monazite mineral phases and U, Th and Y elemental X-ray mapping of monazite grains were obtained at an accelerating voltage of 20 kV, with a beam current of 200 nA and 0.5 μm/pixel spatial resolution. All REE analyses were carried out on LiF crystals attached to SP2, and Pb, Th and U were analysed with LPET crystals connected with the SP3 spectrometer in a CAMECA-SX100 EPMA instrument. Synthetic glass standards of all REEs (La to U) supplied by CAMECA-AMETEK were used for routine calibration and quantification.
4. Rock types and their field relationships
4.a. Mineral assemblages and textural relationship
The investigated area contains different types of rocks: granulitic gneisses, migmatites, cordierite–sillimanite gneisses, Mg–Al granulitic rocks, biotite gneisses, quartz–sillimanite schists, two-pyroxene-bearing basic granulites, massive sillimanite rocks and coarse-grained porphyritic granites (Fig. 2). The garnet–cordierite-bearing granulitic gneiss (Sn-26), garnet-absent cordierite-bearing granulitic gneiss (Sn-24) and cordierite–spinel-bearing granulitic gneiss (Sn-11) were studied in detail for the purpose of monazite dating. The mineral abbreviations used in this study are from Whitney & Evans (Reference Whitney and Evans2010).
4.a.1. Garnet–cordierite-bearing granulitic gneiss
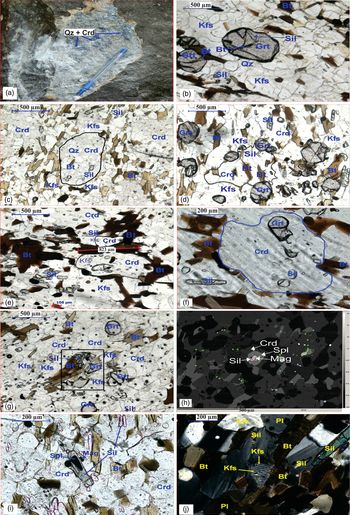
The garnet–cordierite-bearing granulitic gneiss (Sn-3, Sn-26 and Sn-27a, b) is massive and dark grey, mostly medium grained, and shows a granulitic texture. In sample Sn-26, porphyroblasts of quartz and cordierite can be clearly observed (Fig. 3a) with a pitted appearance, which is probably due to pinitization of the cordierite grains. Microscopically, these rocks contain garnet, cordierite, biotite, quartz, plagioclase, K-feldspar (mostly perthitic) and sillimanite. In addition, the accessory minerals present in minor amounts are magnetite, ilmenite, rutile, zircon, monazite, etc. Garnet occurs as medium- to large-sized, subhedral and rounded grains within the groundmass. Fine to medium flakes of biotite grains are found wrapping the boundaries of garnet and cordierite, whereas biotite and sillimanite occur as inclusions in garnet (Fig. 3b).
(a) Field photograph showing porphyroblasts of quartz and cordierite in garnet–cordierite-bearing granulitic gneisses. (b) Photomicrograph of coarse xenoblasts of garnet sillimanite in granulitic gneiss showing dodecahedral outline and inclusions of trails of biotite (plain-polarized light; PPL). (c) Photomicrograph of large poikiloblasts of cordierite with trails of sillimanite and biotite occurring as inclusions (PPL). (d) Photomicrograph showing small grains of sillimanite and biotite occurring as inclusions within cordierite, and garnet coexisting with cordierite in cordierite-bearing granulitic gneiss (PPL). (e) Photomicrograph showing biotite flakes wrapped around cordierite grains and aligned to S2 foliation; some flakes also define S3. The intergrowth of biotite and sillimanite is also observed (PPL). (f) Photomicrograph showing poikiloblasts of cordierite with sillimanite and garnet occurring as inclusions (PPL). (g) Photomicrograph showing corroded porphyroblast of garnet is breaking down to biotite and cordierite (PPL). (h) Back-scattered electron (BSE) image of corona texture in which magnetite at the core is rimmed by spinel followed by cordierite. (i) Photomicrograph of corona texture in which dark green spinel is rimmed by sillimanite, which occurs within the poikiloblastic cordierite (PPL). (j) Hair perthite intergrowth of plagioclase and K-feldspar showing quadrille structure in granulitic gneiss (cross-polarized light; XPL) (mineral abbreviations from Whitney & Evans, Reference Whitney and Evans2010).

4.a.2. Garnet-absent cordierite-bearing granulitic gneiss
Different representative samples (Sn-4a,b, Sn-5a,b,c, Sn-7, Sn-21, Sn-22, Sn-23 Sn-24a,b,c and Sn-25) of garnet-absent cordierite-bearing granulitic gneiss were collected from the study area. These rocks consist of cordierite, biotite, plagioclase, sillimanite, K-feldspar and quartz with minor amounts of the accessory minerals ilmenite, magnetite, zircon, rutile, monazite, etc. Cordierite grains occur as medium to coarse anhedral phenocrysts, whereas biotite, sillimanite and quartz occur as inclusions (Fig. 3c). Biotite grains occur mostly as small flakes in the groundmass, defining the foliation.
4.a.3. Cordierite–spinel-bearing granulitic gneiss
Samples Sn-9a,b, Sn-10 and Sn-11a,b include cordierite, spinel, biotite, sillimanite, K-feldspar, quartz and magnetite. They also contain minerals such as ilmenite, monazite and zircon as accessory phases. Cordierite occurs as medium- to coarse-grained poikiloblasts that contain numerous inclusions of spinel, sillimanite and magnetite as possible prograde minerals (Fig. 3h).
4.b. Petrography and mineral chemistry
4.b.1. Garnet
Garnet crystals in Sn-26 are characterized by their isotropic optical properties and range in diameter from 0.1 to 0.6 mm. Two generations of garnets occur in the garnet–cordierite-bearing granulitic gneisses, out of which the prograde garnets contain inclusions of biotite and trails of sillimanite needles (Fig. 3b). The textural relationships of the garnets suggest that crystallization of the garnets is related to the prograde metamorphic event via metamorphic reaction 1.
The prograde garnet coexists with biotite–sillimanite–K-feldspar–plagioclase–quartz with other minor phases of rutile and ilmenite. The second stage of garnet participates in a retrograde decompression reaction and coexists with garnet–cordierite–sillimanite–quartz and garnet–cordierite–sillimanite–biotite–K-feldpar–plagioclase–quartz. The electron microprobe compositional mapping of the garnets across the crystals shows that the garnets from Sonapahar are rich in Fe and Mn and poor in Ca and Mg. The garnets consist of 77.26 to 78.69 mol. % almandine, 10.53 to 12.28 mol. % pyrope, 1.91 to 2.52 mol. % grossularite and 7.77 to 8.81 mol. % spessartine (Table 1).
Representative electron microprobe analysis of garnet from Sonapahar granulitic gneisses

Where, XMg = Mg/(Fe + Mg); r – rim; c – core
4.b.2. Sillimanite
Sillimanite occurs as needles or fibrolites (0.07 to 0.5 mm in length) intimately intergrown with biotite. Most of the sillimanite needles and biotite flakes occur as inclusions within the porphyroblasts of cordierite, whereas garnet porphyroblasts occur within the matrix or adjacent to the cordierite (Fig. 3d), which suggests prograde metamorphic reaction 3.
4.b.3. Biotite
Biotite is pleochroic with brown or yellowish brown to reddish or dark brown colours, and biotite flakes range from 0.1 to 0.8 mm in length. The parallel orientation of biotite flakes and intergrowths of biotite and sillimanite are also observed, which are wrapped around the cordierite grains and aligned to the S2 foliation, with some flakes defining S3 (Fig. 3e). This textural condition suggests retrograde reaction 4.
The XMg of the biotite is low and ranges from 0.37 to 0.44. The TiO2 in the biotites from the samples of the granulitic gneisses ranges from 3.08 to 3.79 wt % (Table 2).
Representative electron microprobe analysis of biotite from Sonapahar granulitic gneisses

Where, XMg = Mg/(Fe + Mg); r – rim; c – core
4.b.4. Cordierite
Cordierite is characterized by yellow pleochroic haloes with polysynthetic and sector twinning. Cordierite mainly occurs as coarse porphyroblasts (sizes 0.8 to 1.5 mm) and contains inclusions of biotite and sillimanite (Fig. 3c) suggesting reaction 2.
Cordierite also contains xenoblastic to sub-idioblastic garnets, rounded blebs of quartz and sillimanite as inclusions (Fig. 3f). This textural relationship suggests metamorphic reaction 5. Highly corroded garnet also occurs within the cordierite porphyroblasts with adjacent large biotite flakes (Fig. 3g). The textural relationships of the garnet suggest decompression reaction 6.
The cordierite analyses show summations of between 98.04 and 98.83 wt %, suggesting that this mineral may be hydrous, containing 1.17–1.96 wt % H2O and gaseous species. The XMg ranges between 0.62 and 0.64 (Table 3).
Representative electron microprobe analysis of cordierite from Sonapahar granulitic gneisses

Where, XMg = Mg /(Fe + Mg); r – rim; c – core
4.b.5. Spinel
Spinel from Sn-11 appears in garnet-absent cordierite-bearing granulitic gneisses and shows granular exsolution of magnetite. A corona texture forms in which magnetite at the core is rimmed by spinel followed by cordierite porphyroblasts (Fig. 3h) and suggests prograde reaction 7 for the appearance of spinel.
Sharp grain contacts between spinel and sillimanite are observed. Spinel also occurs as inclusions within sillimanite (Fig. 3i). At times, both sillimanite and spinel occur as inclusions within cordierite porphyroblasts, suggesting reaction 8.
The XMg of spinel in the granulitic gneiss ranges from 0.14 to 0.16 (Table 4). This wide range of XMg suggests a solid solution from spinel (MgAl2O4) to hercynite (Fe2+Al2O4).
Representative electron microprobe analysis of spinel from Sonapahar granulitic gneisses

Where, XMg = Mg/(Fe + Mg); r – rim; c – core
4.b.6. Feldspar
K-feldspar is mostly mesoperthitic with lamellar intergrowths of plagioclase in the main masses of K-feldspar characterized by a quadrille structure (Fig. 3j). These grains also form a mosaic fabric with garnet, biotite and quartz. At times, contacts between K-feldspar and biotite are serrated. Myrmekitic intergrowths with vermicules of quartz and clear albite with characteristic lamellar twinning occur between K-feldspar grains and K-feldspar–plagioclase grains. The XCa = Ca/(Na + Ca + K) ratio of the granulitic gneisses ranges from 0.01 to 0.31 (Table 5). A minor component of Fe is observed in the plagioclase, which is present as Fe3+ (0.00 to 0.02 pfu). This component may be due to Al3+ substitution or to extremely fine inclusions of opaque minerals in the plagioclase.
Representative electron microprobe analysis of plagioclase and K-feldspar from Sonapahar granulitic gneisses

Where, XCa = Ca/(Ca + Na + K), r – rim, c – core
The metamorphic reactions 1 to 8 discussed in Sections 4.b.1 to 4.b.5, on the basis of the textural relationships of the coexisting mineral phases, are presented in Section 5 below.
5. Metamorphic evolution
The metamorphic evolution of the granulites from the area around Sonapahar (Riangdo) has been documented based on detailed petrological studies, reaction textures, monazite dating, bulk composition modelling and the P–T path of metamorphism.
5.a. Metamorphic stages and deformation
Detailed petrographic studies on the different types of rocks reveal several diverse mineral assemblages in Sonapahar that exhibit various mineral reaction textures. These textural relationships suggest different mineral reactions, which are discussed in Sections 4.b.1 to 4.b.5.
In the granulitic gneiss, the textural relationships of the garnet suggest two phases of crystallization in which the first prograde garnet formed due to the breakdown of biotite and is related to the first metamorphic event (M1). The following prograde and retrograde/decompression reactions are referred to the M1 and M2 metamorphic events, respectively.
(a) Prograde reactions during M1
(1) $${\rm{biotite }} + {\rm{ sillimanite }} + {\rm{ quartz }} \leftrightarrow {\rm{ garnet }} + {\rm{ K}} {‐} {\rm{feldspar }} + {\rm{ }}{{\rm{H}}_{\rm{2}}}{\rm{O}}$$(2)$$\hskip -21pt{\rm{biotite }} + {\rm{ sillimanite }} + {\rm{ quartz }} \leftrightarrow {\rm{ cordierite }} + {\rm{ K}} {‐} {\rm{feldspar }} + {\rm{ }}{{\rm{H}}_{\rm{2}}}{\rm{O}}$$(3)$$\hskip -20pt{\rm{biotite }} + {\rm{ sillimanite }} + {\rm{ quartz }} \leftrightarrow \,{\rm{ garnet }} + {\rm{ cordierite }} + {\rm{ K}} {‐} {\rm{feldspar }} + {\rm{ melt}$$(7)$${\rm{magnetite }} + {\rm{ sillimanite }} \leftrightarrow {\rm{ spinel }} + {\rm{ quartz }} + {\rm{ }}{{\rm{O}}_{\rm{2}}}$$
(b) Retrograde/decompression reactions during M2
(4)$${\hskip -15pt\rm{cordierite }} + {\rm{ K}} {‐} {\rm{feldspar }} + {\rm{ }}{{\rm{H}}_{\rm{2}}}{\rm{O }} \leftrightarrow {\rm{ biotite }} + {\rm{ sillimanite }} + {\rm{ quartz}}$$(5)$${\rm{garnet }} + {\rm{ sillimanite }} + {\rm{ quartz }} \leftrightarrow {\rm{ cordierite}}$$(6)$$\eqalign{{\rm{garnet }}	 + {\rm{ sillimanite }} + {\rm{ K}} {‐} {\rm{feldspar }} + {\rm{ quartz }} \cr	\hskip -12pt{\leftrightarrow} {\rm{\,\,cordierite }} + {\rm{ biotite }} + {\rm{ melt}}$$(8)$${\hskip -15pt\rm{spinel }} + {\rm{ magnetite }} + {\rm{ sillimanite }} + {\rm{ quartz }} \leftrightarrow {\rm{ cordierite }} + {\rm{ }}{{\rm{O}}_{\rm{2}}}$$


Here, reaction 1 is responsible for the formation of prograde garnet in the absence of cordierite, whereas reactions 3, 5 and 6 appear in the garnet–cordierite-bearing granulitic gneiss, and reactions 2 and 4 are observed in the garnet-absent cordierite-bearing granulitic gneiss; however, reactions 7 and 8 are involved in the cordierite–spinel-bearing granulitic gneiss.
5.b. P–T pseudosection
Based on the mineral assemblages observed for the granulitic gneisses (Sn-3, Sn-26 and Sn-27a, b), a P–T pseudosection for mineral equilibria modelling was calculated using THERMOCALC v.3.33 (Powell & Holland, Reference Powell and Holland1988, updated June 2009). For the granulitic gneiss, the calculations were carried out in the NCKFMASH model system. The average chemical composition (in mol %) of the granulitic gneiss is SiO2 = 67.74, Al2O3 = 10.75, FeO = 5.36, MgO = 6.37, CaO = 0.78, Na2O = 1.39, K2O = 2.26 and H2O = 5.35. The MnO content is very low (0.07 wt %) in these samples, so it is neglected in the modelling. Different mixing models of minerals are used for the calculation of the pseudosection. The NCKFMASH system utilizes garnet, biotite and liquid (melt) from White et al. (Reference White, Powell and Holland2007), cordierite from Holland & Powell (Reference Holland and Powell1998), and alkali-feldspar and plagioclase from Holland & Powell (Reference Holland and Powell2003). The NCKFMASH pseudosection consists of the minerals garnet, cordierite, biotite, K-feldspar and sillimanite, whereas quartz, liquid and plagioclase are taken as saturate phases.
The P–T pseudosection in the NCKFMASH model system is calculated for the specific bulk composition of the Sonapahar granulitic gneisses. The NCKFMASH system is calculated with the addition of Na2O and the appearance of one mineral phase (plagioclase) (White et al. Reference White, Powell and Holland2001), by which we obtain one di-variant, five tri-variant and five tetra-variant fields in a P–T range from 2 to 10 kbar and 650 to 900 °C (Fig. 8). The stable mineral equilibria are calculated for the NCKFMASH system with the peak assemblage (garnet–biotite–sillimanite–K-feldspar–plagioclase–liquid–quartz) stable in the P–T range of 6.7 kbar/774 °C to 8.3 kbar/829 °C, and it also participates in the appearance of prograde garnet through reaction 1. Variation in the modal abundances of some mineral phases in the pseudosection can be observed with changes in pressure and temperature. Garnet- and sillimanite-bearing mineral equilibria are stable at higher pressures, whereas cordierite-bearing mineral equilibria dominate at lower pressures in the pseudosection diagram. The decompression reaction inferred from petrographic observations and due to the decrease in pressure suggests reaction 6. The mineral equilibria of this specific bulk rock composition from Sonapahar exhibit peak metamorphic equilibria at higher pressures, followed by decompression at lower pressures. The mode isopleths of garnet are calculated to examine their nature with changes in P–T and other mineral phases in the equilibria. It is observed that in the narrow di-variant field equilibria (grt–crd–bt–sil–ksp–pl–liq) with two tri-variant fields (grt–bt–sil–ksp–pl–liq and grt–crd–sil–ksp–pl–liq), the mode of garnet increases with increasing pressure. However, in the tri-variant mineral equilibria field (grt–bt–sil–ksp–pl–liq), which represents the peak mineral assemblage (cordierite absent), the mode of garnet increases with temperature.
6. Monazite dating
The EPMA (Th–U–Pb) dating technique is one of the most significant methods for constraining the ages of deformation and metamorphic events in different types of rocks (Suzuki & Adachi, Reference Suzuki and Adachi1991, Reference Suzuki and Adachi1998; Montel et al. Reference Montel, Foret, Veschambre, Christian and Provost1996; Braun et al. Reference Braun, Montel and Nicollet1998; Cocherie et al. Reference Cocherie, Legendre, Peucat and Kouamelan1998; Tickyj et al. Reference Tickyj, Hartmann, Vasconcellos, Philipp and Remus2004; Spear et al. Reference Spear, Pyle and Cherniak2009; Prabhakar, Reference Prabhakar2013). Monazite is a light REE phosphate ((LREE) PO4), rich in U and Th with little initial Pb (Parrish, Reference Parrish1990; Williams et al. Reference Williams, Jercinovic and Hetherington2007; Spear et al. Reference Spear, Pyle and Cherniak2009). Rapid accumulation of radiogenic lead (Pb*) to a required level is possible and can be analysed with an electron microprobe (Montel et al. Reference Montel, Foret, Veschambre, Christian and Provost1996). Thus, by assuming that the total Pb content is radiogenic, dating of monazite with an electron microprobe was performed based on the total abundances of Th, U and Pb (Suzuki & Adachi, Reference Suzuki and Adachi1991, Reference Suzuki and Adachi1994, Reference Suzuki and Adachi1998; Montel et al. Reference Montel, Foret, Veschambre, Christian and Provost1996; Braun et al. Reference Braun, Montel and Nicollet1998; Williams et al. Reference Williams, Jercinovic and Terry1999; Suzuki & Kato, Reference Suzuki and Kato2008; Taylor et al. Reference Taylor, Kirkland and Clark2016; Hazarika et al. Reference Hazarika, Mishra, Ozha and Pruseth2017).
6.a. Sample descriptions and U–Th–Pb systematics
Three samples Sn-11, Sn-24 and Sn-26 were taken from the Sonapahar granulites for detailed analysis. The analysed monazite grains occur as inclusions within garnet, cordierite and in the matrix. Monazite grains G1 and G2 occur as inclusions in the cordierite minerals of sample Sn-24, whereas grain G3 is present within the core of a garnet in Sn-26. Monazite grain G4 contains only younger ages and is found in the matrix of the cordierite–spinel-bearing granulitic gneiss (Sn-11). The mineral chemistry of the monazites from all three samples is given in Table 6. Back-scattered electron (BSE) images are used to identify the monazite grains from the matrix and garnet. Large grains of monazite (100 µm) are commonly found in high-grade metamorphic rocks (Montel et al. Reference Montel, Foret, Veschambre, Christian and Provost1996). All the monazite grains range in size from 50 to 80 µm (Fig. 4a–c). These three grains (G1, G2 and G3) were analysed for detailed study of elemental concentration variations and zoning with X-ray mapping to estimate the age. The monazite grains contain 3.32–7.20 wt % thorium (Th), 0.133–1.172 wt % uranium (U) and 0.101–0.513 wt % lead (Pb) (Table 7). The U and Th with Pb are grouped into the two types of huttonite and brabantite substitution. The brabantite substitution (Th4+ + Ca2+ = 2REE3+; Rose, Reference Rose1980) shows the compositional variation between Th (+Ca and Si) and Y (+HREE). The variations in the brabantite versus huttonite exchange operation in monazite are represented on the plot of Th+U+Si versus REE+Y+P (Fig. 5a–d). Three samples were used for monazite dating viz. Sn-24 (Fig. 6a, b), Sn-26 (Fig. 6c) and Sn-11 (Fig. 6d). In sample Sn-11, a monazite grain was examined in which Si varies from 0.01 to 0.04 pfu and Ca ranges from 0.04 to 0.06 pfu. From Sn-24, two monazite grains were selected for EPMA mineral dating; whereas Si contents are low compared to sample Sn-11, Ca is slightly higher. In sample Sn-26, G3 contains Si from 0.01 to 0.04 pfu and Ca from 0.04 to 0.07 pfu. All the monazite grains from the different samples contain very much less Si than Ca. However, they provide an appropriate amount of Ca to quantify the brabantite (Th/U + Ca↔2REE) substitution. The G1, G2 and G3 monazite grains show compositional zoning patterns in X-ray mapping of the Th Mα element; however, G3 shows the most prominent zoning pattern (Figs 4c, 6c). There is no zoning pattern in the G4 monazite grain from Sn-11. Zonation of monazite in a metamorphic rock is a well-recognized phenomenon (Parrish, Reference Parrish1990; DeWolf et al. Reference DeWolf, Belshaw and O’Nions1993; Zhu et al. Reference Zhu, O’Nions, Belshaw and Gibb1997; Zhu & O’Nions, Reference Zhu and O’Nions1999; Bingen & van Breemen, Reference Bingen and van Breemen1998; Dahl et al. Reference Dahl, Hamilton, Jercinovic, Terry, Williams and Frei2005; Mahan et al. Reference Mahan, Goncalves, Williams and Jercinovic2006; Bhowmik et al. Reference Bhowmik, Wilde, Bhandari and Sarbadhikari2014; Taylor et al. Reference Taylor, Kirkland and Clark2016). The compositional zonation of monazite grains is important because the heterogeneity of monazite can reveal multistage growth and possible diffusion or partial recrystallization of Pb and Th (Scherrer et al. Reference Scherrer, Engi, Gnos, Jakob and Liechti2000; Taylor et al. Reference Taylor, Clark, Fitzsimons, Santosh, Hand, Evans and McDonald2014), and these processes can record several significant events in a single grain (Zhu & O’Nions, Reference Zhu and O’Nions1999; Spear & Pyle, Reference Spear and Pyle2002; Williams et al. Reference Williams, Jercinovic and Hetherington2007; Taylor et al. Reference Taylor, Kirkland and Clark2016).
Representative mineral chemistry data of monazite from Sonapahar granulitic gneisses

X-ray elemental mapping of the three monazite grains G1, G2, G3 for U, Ce, Th and Y: (a) grain G1; (b) grain G2; (c) grain G3; prominent zoning is visible for Th.

EPMA dating age of Monazite grain of granulitic gneisses from the Sonapahar area

Bivariate plot depicting the variation in composition of monazite from Sonapahar (SMGC). (a) For sample S-11, the monazite grain is enriched in brabantite (Th/U + Ca↔2REE) substitution. (b) For sample Sn-24, all grains are enriched in brabantite substitution. (c) For sample Sn-26, the monazite grain shows brabantite (Th/U + Ca↔2REE) substitution. (d) Bivariate plot showing the age distribution; ∼1.5 Ga, ∼1.0 Ga and ∼0.5 Ga age domains are enriched in brabantite substitution as marked on the diagram.

Magnified BSE images of monazites showing chemical age (Ma) determined at spots on the monazite grains for each representative age. (a, b) Grains G1 and G2 of sample Sn-24 show an intermediate age at the core and the youngest age towards the rim. (c) Grain G3 of sample Sn-26 shows three distinct ages with the oldest age at the core, the youngest age towards the rim and the intermediate age located in the middle portion of the monazite grain. (d) Grain G4 of Sn-11 shows only the youngest age throughout the monazite grain.

7. Results
7.a. Monazite dating
The Th–U–Pb values from these three rock samples are given in Table 7. The probe analysis reveals that the ages of the rock range from Mesoproterozoic to Neoproterozoic, with older ages (1571 ± 22 Ma) located in the cores and younger ages (478 ± 7 Ma) towards the rims of the monazite grains. A few spots from the monazite grains also yield intermediate ages between the older and younger ages, ranging from 1166 ± 63 to 901 ± 63 Ma (Fig. 6a–c). These calculated ages are well correlated with the ages reported by Chatterjee et al. (Reference Chatterjee, Mazumder, Bhattacharya and Saikia2007) and Yin et al. (Reference Yin, Dubey, Webb, Kelty, Grove, Gehrels and Burgess2010). Weighted mean age distributions and cumulative histograms plotted using the Isoplot program (Ludwig, Reference Ludwig2003) for the garnet-present (Sn-26) and garnet-absent (Sn-24) cordierite-bearing granulitic gneisses are presented in Figure 7a–c. The calculated weighted mean ages are 1571 ± 22 Ma (n = 18, MSWD = 1.2, probability = 0.22), 1034 ± 91 Ma (n = 7, MSWD = 2.9, probability = 0.007) and 478 ± 7 Ma (n = 55, MSWD = 1.7, probability = 0.001). Cordierite–spinel-bearing granulitic gneiss (Sn-11) has a single age domain (Fig. 7d), and the calculated weighted mean age is 457 ± 11 Ma (n = 20, MSWD = 1.3, probability = 0.16). The grains G1 and G2 from sample Sn-24 show ∼1.0 Ga and 0.5 Ga age domains, whereas G3 from sample Sn-26 shows ∼1.5 Ga, 1.0 Ga and ∼0.5 Ga age domains; grain G4 from Sn-11 produced only a ∼0.5 Ga age domain.
Chemical age of monazite from Sonapahar granulitic gneisses (Sn-24 and Sn-26). Isoplot weighted mean age distributions with cumulative histograms (Ludwig, Reference Ludwig2003): (a) older age; (b) intermediate age; (c) younger age; (d) younger age of cordierite–spinel-bearing granulitic gneisses (Sn-11).

Garnet mode isopleths on NCKFMASH P–T pseudosection for Sonapahar granulitic gneiss (Sn-26) depict calculated mineral equilibria for the mineral assemblage grt–crd–pl–sil–kfs–bt–q–liq (mineral abbreviations from Whitney & Evans, Reference Whitney and Evans2010).

7.b. P–T conditions of metamorphism
The observed mineral equilibrium assemblages garnet–biotite–sillimanite–K-feldspar–plagioclase–liquid–quartz and garnet–cordierite–biotite–K-feldspar–plagioclase–liquid–quartz are obtained at the P–T range of 6.7 kbar/774 °C to 8.3 kbar/829°C and at a low pressure of 5.9 kbar/754 °C, respectively, in the NCKFMASH system. The mineral equilibria of this specific bulk rock composition from Sonapahar exhibit peak metamorphic equilibrium at higher pressure, followed by decompression to lower pressure. This type of pseudosection diagram, which represents the equilibria experienced by a particular bulk composition, is important in representing the mineral equilibria and allows us to decipher the mineral assemblages and relationships observed in the rock (White et al. Reference White, Powell and Holland2001). The equilibrium mineral phases calculated for the Sonapahar granulitic gneisses lie in the P–T range from 5.9 kbar/754 °C to 8.3 kbar/829 °C in the NCKFMASH system (Fig. 8). The P–T condition for spinel-bearing equilibria is not discussed in Figure 8; therefore, the P–T conditions of all rock types of the Sonapahar granulitic gneisses are estimated through THERMOCALC v.3.33 using the internally consistent dataset of Powell & Holland (Reference Powell and Holland1988). The P–T av mode was calculated with phases involving garnet, biotite, sillimanite, K-feldspar, plagioclase, quartz, rutile, ilmenite; cordierite, spinel, magnetite, biotite, sillimanite, K-feldspar, quartz; and garnet, cordierite, biotite, K-feldspar, plagioclase, quartz, ilmenite, rutile at 0.5 H2O activity. The result of these three types of coexisting phases is presented in Tables 8–10. The P–T av estimates are consistent with the P–T estimate of mineral equilibria from the pseudosection (Fig. 8). A metamorphic evolution P–T path (Fig. 9) is deduced on the basis of textural relationships, metamorphic reactions, coexisting mineral phases and the NCKFMASH pseudosection. The pressure and temperature conditions of the granulitic gneiss emphasize the following points:
(a) The peak mineral assemblage garnet–biotite–K-feldspar–plagioclase–sillimanite–quartz–rutile–ilmenite–liquid formed during M1 (peak) metamorphism in the P–T range from 7.5 kbar/677 °C to 8.2 kbar/713 °C with an average P–T of 7.9 ± 0.8 kbar/697 ± 41 °C.
(b) Cordierite–spinel-bearing granulitic gneiss includes the mineral assemblage cordierite–spinel–sillimanite–biotite–magnetite–K-feldspar–plagioclase–quartz–ilmenite–liquid, in which the P–T conditions range from 5.8 kbar/815 °C to 5.9 kbar/817 °C with an average P–T of 5.9 ± 1.9 kbar/816 ± 93 °C.
(c) The P–T values for the retrograde mineral assemblage garnet–cordierite–biotite–sillimanite–plagioclase–K-feldspar–quartz–rutile–ilmenite–liquid, formed during M2 (post-peak) metamorphism, lie in the P–T range from 3.9 kbar/701 °C to 4.2 kbar/715 °C with an average P–T of 4.0 ± 0.8 kbar/706 ± 54 °C.
The P–T values of the granulitic gneiss trace a clockwise P–T path (Fig. 9) during the maximum pressure, which is achieved during the M1 (peak) metamorphic stage represented by peak coexisting mineral assemblages of the prograde garnet-forming reaction at the P–T condition of 8.2 kbar/713 °C. With further decompression (3.9 kbar/701 °C) garnet–sillimanite–biotite–quartz and spinel–quartz break down to form cordierite during the M2 (post-peak) metamorphic stage; this is the dominant metamorphic event in the study area. The metamorphic evolution of the granulitic gneisses progresses through an isothermal decompression path.
Average P–T condition for garnet–cordierite–biotite–sillimanite–plagioclase–K-feldspar–ilmenite–quartz–melt at H2O activity of 0.5

Average P–T condition for garnet–biotite–sillimanite–plagioclase–K-feldspar–ilmenite–quartz–rutile–melt at H2O activity of 0.5

Average P–T condition for cordierite–spinel–biotite–magnetite–sillimanite–plagioclase–K-feldspar–ilmenite–quartz–melt at H2O activity of 0.5

Clockwise retrograde/decompression pressure–temperature (P–T) path at 0.5 H2O activity (using internally consistent dataset of Holland & Powell, Reference Holland and Powell1998) shown on P–T diagram indicating the metamorphic evolution of granulitic gneisses in the study area based on geothermobarometry, the pseudosection and reactions from textural relationships.

8. Discussion
Chemical dating of monazite grains from the Sonapahar area was performed because it has been successfully applied to constrain the ages of deformation and metamorphic events. Three monazite-bearing granulitic samples were analysed, yielding three distinct ages from the prominent zoning of the monazite grains (478 ± 7 Ma; 1034 ± 91 Ma; 1571 ± 22 Ma). The growth stages of monazite are recognized when an individual grain contains distinct age domains in the core and the rim. The distinct compositional zoning domains in grain G3 from sample Sn-26 are one of the most important characteristics of the monazite, because these domains can be interpreted with regard to the generation of monazite growth (Williams et al. Reference Williams, Jercinovic, Goncalves and Mahan2006 and references therein). The monazite grain G3, which occurs as an inclusion within a garnet core, provides three different age domains (478 ± 7 Ma; 1034 ± 91 Ma; 1571 ± 22 Ma) that may be due to the effect of three different types of tectonic activity that occurred in the study area. Monazite is also found as inclusions in cordierite, suggesting that the younger age of ∼0.5 Ga was dominant during the Pan-African orogeny when decompression occurred in the cordierite-bearing assemblages of the granulitic gneisses. A number of studies of the monazite population and single grains of monazite in metamorphic rocks have noted that monazite may grow stepwise along the prograde path of a P–T loop. The prograde monazite grains are generated during the formation of melt, whereas post-peak monazite grains are recrystallization products of pre-existing grains (Johnson et al. Reference Johnson, Clark, Taylor, Santosh and Collins2015). Monazite also develops stepwise during decompression (Franz et al. Reference Franz, Andrehs and Rhede1996; Pyle & Spear, Reference Pyle and Spear2003; Foster et al. Reference Foster, Gibson, Parrish, Horstwood, Fraser and Tindle2004; Gibson et al. Reference Gibson, Carr, Brown and Hamilton2004). The Sonapahar metapelitic granulites reveal the post-S1/pre-S2 stage of metamorphism at ∼1.5 Ga with poorly preserved 1.0–1.3 Ga ages in the rim of a monazite grain in contact with a syn-S2 feature, which may be due to an extended period of cooling along the retrograde metamorphic path, and the more significant occurrence of 649–524 Ma ages, both of which are considered post-S2 stages of metamorphism (Chatterjee et al. Reference Chatterjee, Mazumder, Bhattacharya and Saikia2007, Reference Chatterjee, Bhattacharya, Duarah and Mazumdar2011; Chatterjee, Reference Chatterjee2017). The analysis of the zoned monazite suggests that the three distinct ages (1571 ± 22 Ma; 1034 ± 91 Ma; 478 ± 7 Ma) from the Mesoproterozoic to Neoproterozoic can be correlated with the ages of peak and two post-peak metamorphic stages that must have influenced the Sonapahar granulites, which is similar to the conclusions of Chatterjee et al. (Reference Chatterjee, Mazumder, Bhattacharya and Saikia2007). It is predicted that the dominant metamorphic event is the Pan-African orogeny (478 ± 7 Ma), which might affect the rim portion of the monazite grains, because the ‘1034 Ma age’ is poorly obtained in the analytical data. The crust formation of the Meghalaya massif started during Archaean time and experienced a protracted and episodic evolution (Bidyananda & Deomurari, Reference Bidyananda and Deomurari2007). The Mesoproterozoic age of 1571 ± 22 Ma is considered peak metamorphism, during which prograde garnet is formed through reaction 1, which might be related to the maximum pressure conditions in the granulite of the study area. Although the intermediate age of 1034 ± 91 Ma is poorly preserved, it may be related to the Grenvillian orogenic event during the formation of the Rodinia supercontinent and represents the post-peak metamorphic stage at Sonapahar, or it may be a mixing artefact of the Grenvillian and Pan-African orogenies. The youngest age (478 ± 7 Ma), which is associated with the Pan-African orogeny, suggests that the Sonapahar granulites were part of an accretionary event of the Gondwana supercontinent; it also correlates with the amphibolite- to granulite-facies metamorphism of the Pinjarra orogenic belt and represents the dominant post-peak (M2) metamorphism in the Sonapahar area.
The SMGC is an isolated part of the Indian Peninsula (Evans, Reference Evans1964), the northern extension of the Eastern Ghats Mobile Belt (Crawford, Reference Crawford1974) and the NE extension of the CGC (Desikachar, Reference Desikachar1974). Recent studies in the SMGC (Bidyananda & Deomurari, Reference Bidyananda and Deomurari2007; Chatterjee et al. Reference Chatterjee, Mazumder, Bhattacharya and Saikia2007, Reference Chatterjee, Bhattacharya, Duarah and Mazumdar2011; Yin et al. Reference Yin, Dubey, Webb, Kelty, Grove, Gehrels and Burgess2010; Chatterjee, Reference Chatterjee2017; Borah et al. Reference Borah, Hazarika, Mazumdar and Rabha2019) and CGC (Chatterjee et al. Reference Chatterjee, Crowley and Ghose2008, Reference Chatterjee, Banerjee, Bhattacharya and Maji2010; Maji et al. Reference Maji, Goon, Bhattacharya, Mishra, Mahato and Bernhardt2008; Sanyal & Sengupta, Reference Sanyal, Sengupta, Mazumder and Saha2012; Mukherjee et al. Reference Mukherjee, Dey, Sanyal, Ibanez-Mejia, Dutta, Sengupta, Pant and Dasgupta2017, Reference Mukherjee, Dey, Ibanez-Mejia, Sanyal and Sengupta2018; Kumar & Dwivedi, Reference Kumar and Dwivedi2019) have observed the same geochronological age from the basement of the SMGC and the CGC and established a significant relationship between the Mesoproterozoic metamorphic terrain and the CGC. Similar coeval metamorphism has been reported in the Proterozoic gneissic complexes of central India during 1.61–1.57 Ga where supra-crustal granulites were metamorphosed under ultra-high-temperature conditions along the southern margin of the CITZ (Bhowmik et al. Reference Bhowmik, Sarbadhikari, Spiering and Raith2005, Reference Bhowmik, Wilde, Bhandari and Sarbadhikari2014). These authors concluded that collisional tectonism occurred between the SIB and NIB at 1.57–1.54 Ga when the oceanic lithospheric of the SIB was subducted beneath the NIB to form an island arc, whereas episodic magmatic injection intruded in the back-arc to form the granulite-facies rocks. Similar lithological and metamorphic trends are reported in the SMGC, which indicates the possibility that the northern Garo Hills rocks formed in a back-arc environment (Chatterjee, Reference Chatterjee2017).
9. Conclusions
Petrological and mineralogical data reveal that three distinct ages (1571 ± 22 Ma; 1034 ± 91 Ma and 478 ± 7 Ma) from the Mesoproterozoic to Neoproterozoic can be correlated with peak and two post-peak stages of metamorphism that must have influenced the Sonapahar granulitic rocks. Stable mineral equilibria are calculated for the NCKFMASH system with the peak assemblage stable in the P–T range of 6.7 kbar/774 °C to 8.3 kbar/829 °C. The P–T av values of the granulitic gneiss trace a clockwise P–T path. The maximum pressure and moderate temperature were achieved during the peak (M1) metamorphic stage represented by peak mineral assemblages of the prograde garnet-forming reaction (8.2 kbar/713 °C), followed by decompression reactions through which garnet–sillimanite and spinel–quartz broke down to form cordierite during the post-peak (M2) metamorphic stage (3.9 kbar/701 °C). The granulites of Sonapahar were exhumed along an isothermal decompression path. The oldest age of 1571 ± 22 Ma is considered to represent a peak metamorphic assemblage. The intermediate age of 1034 ± 91 Ma may be a mixing artefact and represents post-peak metamorphism, and the most dominant youngest age (478 ± 7 Ma) from the granulitic gneisses of the study area, related to the Pan-African orogeny, suggests that the Sonapahar granulites were part of the accretionary process of the Gondwana supercontinent and represents the dominant post-peak (M2) metamorphism. The Pan-African orogeny overprinted the evidence of a mixing artefact in Sonapahar, which is dominated by post-peak (M2) metamorphic events. The Sonapahar granulitic gneisses of the Shillong Plateau contain Mesoproterozoic ages of 1571 Ma in the core parts of monazite grains and 1034 Ma in the intermediate portions of the monazite grains (mixing artefact); this evidence strongly shows the extension of the CITZ and Eastern Ghats Mobile Belt in the Shillong Plateau.
Supplementary Material
To view supplementary material for this article, please visit https://doi.org/10.1017/S0016756819001389
Acknowledgements
S.B. Dwivedi is thankful to the Department of Science and Technology for the funding of DST project ESS/16/304/2005, through which EPMA and XRF analysis were carried out. We are also grateful to the Director of the Indian Institute of Technology (BHU) for providing infrastructure to complete this work. We appreciate Dr. Rich Taylor and an anonymous reviewer for their comments to improve the manuscript.