Introduction
The Cognitive Abilities Screening Instrument (CASI), because of its simplicity and short time requirement, has been used as a screening tool for dementia (Graves et al., Reference Graves1996; McCurry et al., Reference McCurry1999).
The Cognitive Abilities Screening Instrument Chinese version (CASI C-2.0) consists of 20 item sets which can be divided into nine domains, including long-term memory (LTM), short-term memory (STM), attention (Att), concentration or mental manipulation (Conc), orientation (Ori), abstraction and judgment (AJ), language abilities (Lang), visual construction (VC), and category fluency (Flu). The CASI C-2.0 can usually be administered within 15–20 minutes and its total score ranges from 0 to 100, with a higher score indicating better cognitive ability. When CASI C-2.0 was first developed, its aims were three-fold: (1) the sum of a small subset of the items of the test can be used for screening purposes; (2) the all-domain-total-score can be used to assess the change in a patient's cognitive ability longitudinally; and (3) the nine-domain structure of CASI C-2.0 makes it possible to profile and compare the cognitive abilities of a person (Teng et al., Reference Teng1994a). As a result, the total CASI score is thought to represent the underlying cognitive ability of the patient and the subdomain scores provide an informative profile of the cognitive abilities of the examinee. To assess whether a patient has dementia or other cognitive impairments, the clinician usually compares his or her profile to the norm with a similar demographic background.
It has been shown that using only a few items or domain scores can provide almost as good or even better precision than using the total CASI score in screening dementia (Folstein et al., Reference Folstein, Folstein and McHugh1975; Liu et al., Reference Liu, Teng, Chuang, Lin, Fuh and Wang2002b; Teng et al., Reference Teng1994a; Reference Tsai, Lin, Wu and Liu1994b; Tsai et al., Reference Tsai, Lin, Wu and Liu2004). For example, Folstein et al. (Reference Folstein, Folstein and McHugh1975) showed that the Mini-mental State Examination (MMSE) instrument which contains only a subset of items in CASI can be used for screening dementia with acceptable sensitivity, specificity, validity and reliability. However, Funabiki and his colleagues (2002) showed that it was difficult to screen for very mild dementia using MMSE and that it might be better to evaluate not the total score but only the subscales such as orientation or short-term memory. In clinical practice, the total CASI score has also been shown to be an effective cognitive test with acceptable sensitivity, specificity, validity and reliability (McCurry et al., Reference McCurry1999; Sherrell et al., Reference Sherrell, Buckwalter, Bode and Strozdas1999; Teng et al., Reference Teng, Lin, Chou, Wang, Fuh and Liu1994b; Lin et al., Reference Lin, Wang, Liu, Chen, Lee and Liu2002; Liu et al., Reference Liu1994; Reference Liu1998; Reference Liu2002a; Reference Liu, Teng, Chuang, Lin, Fuh and Wang2002b). In other words, the total score and the domain scores of CASI are useful either in evaluating the patients’ cognitive ability or screening for dementia or in both. However, the double role of CASI as an overall measure and a profile provider for the patient's cognitive abilities has never been carefully examined. To justify the use of the total of the nine domain scores as an overall measure of the cognitive abilities as well as using the individual domain scores to identify suspicious cases, it is necessary to investigate the suitability of such uses. The purpose of the study was to examine whether the uses of CASI as an overall measure and a profile provider for the patient's cognitive abilities is reasonable and supported by the data. By evaluating whether the data were consistent with the hypothesized second-order model and closely inspecting for salient loadings of the items to their designated constructs or domains, it was possible to check whether the data yielded some support for the uses of both the total score and the domain scores.
Methods
Data from 608 patients (289 males, 319 females), who visited the Memory Clinic of the Neurological Institute of the Taipei Veterans General Hospital (Taipei VGH), were included in the study. The data have previously been examined and a tighter way of combining the nine domains was found to improve the efficacy of CASI (Tsai et al., Reference Tsai, Lin, Wu and Liu2004). The ages of the patients ranged from 34 to 95 years (mean = 73.57; SD = 8.10). In clinical use, once dementia is diagnosed, the severity of dementia is determined using the Clinical Dementia Rating (CDR) scale with the degrees of 0.5, 1, 2, 3, 4, and 5 which respectively indicate questionable, mild, moderate, severe, profound and terminal dementia (Hughes et al., Reference Hughes, Berg, Danziger, Coben and Martin1982; Lin and Liu, Reference Lin and Liu2003). Of the 608 patients in the study, 68 were normal and 540 were diagnosed with Alzheimer's disease (AD), including 284 with CDR = 1; 171 with CDR = 2; 82 with CDR = 3, and 3 patients with CDR = 4.
The numbers of items, as intended in the CASI C-2.0 test, belonging to the nine domains are respectively 1, 3, 3, 5, 6, 6, 6, 7, and 8 items for category fluency (Flu), attention (Att), visual construction (VC), long-term memory (LTM), concentration or mental manipulation (Conc), abstraction and judgment (AJ), language abilities (Lang), short-term memory (STM), and orientation (Ori), with a total of 45 items. To justify the use of summation of the scores of each item as the overall cognitive ability of the patient, a confirmatory factor analysis was performed to examine whether the items in CASI contributed significantly to a common underlying construct.
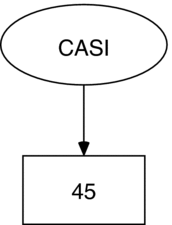
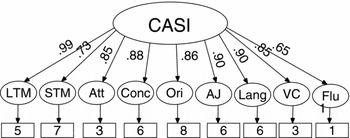
Confirmatory factor analysis provides a means of validating the hypothesized underlying structure of the items in a test. Since our observed variables were measured and scored on ordinal instead of interval scale, it was recommended that a polychoric correlation matrix of all the variables be estimated followed by fitting the hypothesized structure model to such a matrix. In this analysis, the Mplus statistical package (Muthèn and Muthèn, Reference Muthèn and Muthèn1998) was used to fit the three models under consideration: (a) the single-factor model, which hypothesized that there is only one general factor underlying all the items (Figure 1); (b) the nine-correlated-factor model, which assumes that the domains could be correlated, but their associations are not due to sharing a common factor, CASI (Figure 2); (c) the second-order hierarchical model, which hypothesized that the intercorrelations among the nine domain factors could be absorbed by a second-order factor, i.e. the overall cognitive ability, CASI (Figure 3). If model (a) appears to fit the data well and all the standardized loadings appear to be salient (> 0.3 or 0.4) as adopted in McDonald (Reference McDonald1999), the use of the total score as an overall cognitive measure would be supported. In addition, a reasonable fit of model (c) would imply that the data are consistent with the second-order structure which would be supportive in forming a total score for the test when the loadings on the common underlying construct are all large enough. The main difference between models (a) and (c) was that one can examine the salience of the nine-domain structure of CASI C-2.0 under model (c), not model (a). If both models (b) and (c) yield reasonable fit to the data and the standardized loadings of the items on the nine domains appear to be salient for all the domains, the data are said to be consistent with the underlying nine-domain representation. In other words, a reasonable fit of model (c) to the data with salient standardized loadings on the domain factors and common factor would provide some evidence that the items of the CASI C-2.0 were useful not only in profiling the nine correlated cognitive domain scores, but also in evaluating an overall measure of the underlying cognitive ability of the patients.
Model (a): single-factor model.

Model (b): nine-correlated-factor model.

Model (c): second-order hierarchical model.

A number of goodness-of-fit indices are available to assess the fit of the various models to the data. However, so far no index has been shown to perform uniformly well across all cases. We report here four fit indices: χ2 value, comparative fit index (CFI), Tucker-Lewis index (TLI), and the root mean square error of approximation (RMSEA), which have been shown to be useful in assessing model goodness-of-fit for data with both continuous and categorical outcomes.
The χ2 statistic is defined as  , where
 is defined as half of the weighted least-squares discrepancy between the sample and the hypothesized covariance matrices, and n is the sample size (Muthén, Reference Muthén1998–2004). χ2 statistic is a badness-of-fit measure that a large value of χ2 statistic indicates misfit of the model. In general, the p-value of χ2 statistic above 0.1 is considered acceptable. However, it is well known that the chi-square statistics are highly sensitive to sample size and therefore the decision of rejecting or retaining a model should not depend solely on such statistics.
The TLI (Tucker and Lewis, Reference Tucker and Lewis1973; Bentler and Bonett, Reference Bentler and Bonett1980) has the form:

where χb2 and χm2 respectively are the χ2 statistics of the baseline and the hypothesized models with dfb and dfm as their corresponding degrees of freedom.
The CFI (Bentler, Reference Bentler1990, 1995) is defined as follows:

The value of CFI ranges from 0 to 1, where 1 indicates a good fit.
The value of RMSEA (Browne and Cudeck, Reference Browne, Cudeck, Bollen and Long1993; Steiger and Lind, Reference Steiger and Lind1980) is estimated as:

where and n are defined above, df is the degree of freedom of the model.
Yu and Muthèn (Reference Yu and Muthèn2001) and Hu and Bentler (Reference Hu and Bentler1999) suggested the following index cut-off value guideline for good models: TLI > 0.95, CFI > 0.95, and RMSEA < 0.06 for both continuous and/or categorical data. However, the results of their simulations in the categorical case were based on data with 15 dichotomous items rather than, in our case, having more items and also both dichotomous and polytomous items. For continuous outcomes, there are rules of thumb for acceptance of model fit, such as that CFI and TLI should be at least 0.90, and consequently such principles have been adopted in evaluating the fit of the hypothesized models by many researchers (see McDonald and Ho (Reference McDonald and Ho2002) for a relatively comprehensive survey). Moreover, an RMSEA value in a range of 0 to 0.08 is considered an acceptable fit, between 0.08 and 0.10 a mediocre fit, whereas values larger than 1 would suggest serious misfit problems with the model (Bagozzi and Yi, Reference Bagozzi and Yi1988; Browne and Cudeck, Reference Browne, Cudeck, Bollen and Long1993).
Results
The data were analyzed through a confirmatory factor analysis using the Mplus statistical software (Muthèn and Muthèn, Reference Muthèn and Muthèn1998). Because ANML (= name animals with four legs in 30 seconds) was the only item associated with the fluency domain (Flu) and its score ranged from 0 to 10, in the following analysis we therefore decided to treat ANML as a continuous rather than a categorical outcome variable.
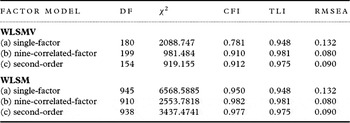
In Table 1, we report the goodness-of-fit indices of the various tested models to the CASI data. We distinguished two cases which varied in the way the χ2 value was defined: WLSM and WLSMV. WLSM and WLSMV are both the weighted least square estimates using a diagonal weight matrix with the robust standard errors. Their difference is that WLSMV uses both the mean- and variance-adjusted test statistic whereas WLSM only uses the mean-adjusted test statistic. The departure of the data from the specified model was first tested for statistically significant χ2 values by means of χ2 likelihood ratio tests. However, the high sensitivity of χ2 tests to sample size makes it a less appealing choice for assessing the overall fit of the model (Sörbom Reference Sörbom1989; Bentler, Reference Bentler1993). Although the models were not nested in the sense that models (a) and (b) were not restricted versions of model (c) by constraining certain parameters to be equal or fixed to particular values – and consequently a χ2 test or adjusted χ2 test of nested models was not directly applicable – the comparison between models in terms of their χ2-statistics or likelihoods and degrees of freedom can still be informative. For example, in the case of WLSMV, the comparison between models (a) and (b) showed a considerable reduction of 1107.263 in their χ2 values with a difference of 19 degrees of freedom. In addition, the comparison between models (b) and (c) showed only some relatively less decrease in χ2 values with 45 degrees of freedom. Similar patterns could be observed for WLSM as well. Inspection of other fit indices such as CFI and TLI indicated the second-order model (c) as the closest fit among the three, though model (b) was considered to yield a similar fit to model (c). In particular, having the TLI values larger than 0.95 and the RMSEA value of 0.090(<0.10) for model (c) yielded some support for the model. Although the significant chi-square value was indicative of a poor fit and thus not supportive of this model, the CFI values of 0.912 and 0.977 for WLSMV and WLSM were somewhat supportive of the second-order model.
Chi-square and goodness-of-fit indices for tested models of CASI C-2.0

df: degrees of freedom; χ2: chi-square value; CFI: comparative fit index; TLI: Tucker-Lewis index; RMSEA: root mean square error of approximation.
The above results showed that the second-order model was reasonable for the CASI data and confirmed the hierarchical structure of the nine domain factors and the common higher order factor. To justify the use of the all-domain-total-score as an overall measure of cognitive ability, we further examined the magnitudes of the standardized loadings of each item on the common factor and on the nine domain factors for model (c) (McDonald, Reference McDonald1999). The descriptions of all the abbreviations for the items are reported in the appendix. For illustration, we showed how the standardized loadings of the items on the second-order common factor as well as on their designated domains were obtained. For example, the estimated first-order loadings of the five indicator items for the long-term memory (LTM) in model (c) were

where E1 to E5 were the measurement errors associated with the items of LTM. All the standardized loadings appeared to be larger than .8 and satisfied the criterion for salience (>.3 or.4). For the second-order loadings of the nine domains on the common factor CASI, we could see on Figure 3 that

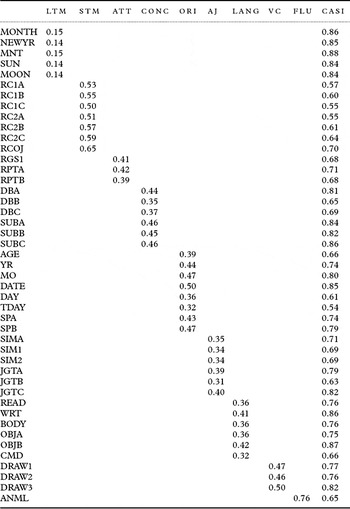
where ϵ 1 to ϵ 9 contain the unique parts of each domain. All the standardized loadings for the second-order structure are again salient. To justify the use of total score, we reported in Table 2 all the standardized loadings for the items on the higher-order factor CASI and on the unique and uncorrelated parts of the nine domains. For example, the standardized loading of item MONTH on the common factor CASI was obtained such that

where LTMu and E1* are respectively the unique part of LTM and the measurement error unaccounted for by LTM which includes the unique part of LTM and its common part in CASI. Note that the numbers might not be exact due to rounding errors.
Upon inspecting the standardized loadings of each item on the common underlying construct CASI in Table 2, we found all the loadings to be salient (> 0.3), which in turn justified forming the total score of the overall cognitive ability. Moreover, the standardized loadings of all items, except for those LTM ones, appeared to be salient as well and therefore the use of the domain scores for the other eight domains were also justified. Although we would expect the standardized loadings of the items MONTH, NEWYR, MNT, SUN, and MOON to be salient on the unique part of LTM, they were all smaller than 0.30 with values 0.15, 0.14, 0.15, 0.14, and 0.14, respectively. In other words, those LTM items seemed to measure the overall cognitive ability CASI rather than the long-term memory itself. One could conclude that the ability measured by items MONTH, NEWYR, MNT, SUN, and MOON were not solely the long-term memory, but some latent construct shared by other domains as well. The construct measured by those items therefore should not be defined as the LTM domain. That is, more abilities in addition to LTM are required to answer those items and if the measure of LTM ability itself is of interest, another choice of items would be necessary. Secondly, LTM relates most closely to the overall cognitive ability CASI than the rest of the domains with its large standardized loading of 0.99 on CASI. With the goodness-of-fit indices CFI, TLI and RMESA having the values 0.91/0.98, 0.98, and 0.08, the fit of model (b) was very similar to that of model (c) and therefore the nine-domain structure of CASI was supported in model (b). Moreover, with salient loadings on all the items in model (b) (not shown here), the results conformed to the domain scores. Therefore, we would conclude that the use of the domain score of LTM was still justified with the reasonable fit of model (b). However, much of the measured LTM ability seemed to come from or at least was highly correlated with the common cognitive ability. The current results call for further investigation on those items which were said to measure the LTM domain and it would be useful to check whether such results were simply due to sampling variability by analyzing data from other clinical settings.
Standardized loadings for the second-order model (c) with unique parts of the nine domain factors and common factor CASI

CASI: the common factor of the nine domains.
To sum up, the results obtained not only justified forming an overall measure of cognitive ability, but also supported the claim of providing a profile for the nine subdomain scores of the patients for CASI C-2.0.
Discussion
The results were obtained under the assumption that a single item ANML was a direct measure of the category fluency domain (Flu) without measurement error. Such an assumption is easily violated and it is reasonable to include more indicator variables to measure the latent construct, Flu. In particular, to ensure that CASI C-2.0 provides a reliable profile for the cognitive abilities of the nine domains, it is highly recommended that at least three items are included for each domain. It is to be expected that with a better measure of the domain factor, Flu, the second-order model would likely provide a better fit.
Another major limitation of this study is that the data only included patients from Taipei VGH, and the patients with dementia all have AD. More investigation is needed to further generalize the results. For example, it is possible that patients from other hospital settings or with different causes of dementia might perform differently from those from VGH on the test. However, data containing patients’ responses on each single item are seldom available nowadays because in clinical use only total scores and/or at most the individual domain scores are recorded. Although samples that include people without AD are desirable, we currently do not have such item data available in a larger homogeneous sample.
The loadings of the items MONTH, NEWYR, MNT, SUN, and MOON of long-term memory domain are shown to behave differently from the rest of the items in the way that they do not seem to be a salient indicator of long-term memory alone after accounting for the contribution from the common factor CASI. In other words, the LTM domain and the CASI factor are highly correlated with each other and future work is needed to investigate their common and unique parts.
To sum up, in the present study three factor models were constructed based on different underlying item structures and evaluated using confirmatory factor analysis. We found that the items in CASI C-2.0 conformed to the second-order structure of the instrument and justified forming an overall measure of cognitive ability. The uses of the nine subdomain scores are also supported in the claim of providing a profile for the nine subdomain abilities of the patients for CASI C-2.0, as intended in Teng et al. (Reference Teng, Lin, Chou, Wang, Fuh and Liu1994b).
Appendix
Descriptions of the item names (listed in the order they appear in the CASI questionnaire)

Conflict of interest
None.
Description of authors' roles
R-C. Tsai carried out the analysis and wrote the paper, with assistance from H-J. Wang on the statistical analyses. K-N. Lin and H-C. Liu designed the study, supervised the data collection and also collected some of the data. In addition, K-N. Lin checked the consistency of the results with what is normally observed clinically.
Acknowledgments
The authors are indebted to the reviewers for their extremely constructive comments and suggestions which greatly improved the quality of this work. The authors would also like to thank Chiu-Ying Fu for her assistance in drawing the figures. This research was supported by a grant from the National Science Council of Taiwan (NSC 92–2413-H-003–068) and partly supported by a grant from Taipei Veterans General Hospital (VGH 92–310).