I. INTRODUCTION
A small, uniform, and well-dispersed barium titanate (BaTiO3, BT) powder is needed for use as the dielectric material in multilayer ceramic capacitors (MLCCs) with ultrathin active layers.Reference Pithan, Hennings and Waser1–Reference Mizuno, Hagiwara and Kishi5 Two main challenges in the current development of MLCCs are the trends for both smaller size (miniaturization) and greater capacitance values. For example, the number of dielectric layers in one capacitor now often exceeds 1000, and a thickness of less than 1 μm for each active layer is required.
Solid-state BT has the advantages of good crystallinity, low cost, and high precision of stoichiometric control. The phase evolution of solid-state BT has been studied by many researchers.Reference Trzebiatowski, Wojciechowska and Damm6–Reference Lee, Huang, Chang, Lin, Su, Lee and Fujimoto17 Beauger et al.Reference Beauger, Mutin and Niepce10, Reference Beauger, Mutin and Niepce11 built a model that explains how barium ions diffuse though the TiO2 surface and control BT growth. Rössel et al.Reference Rössel, Höche, Leipner, Völtzke, Abicht, Hollricher, Müller and Gablenz15 used Raman spectral imaging to confirm the mechanism by which the BT layer continues to form and consumes the TiO2 surface. Kobayashi and LeeReference Kobayashi, Suzuki and Mizuno16, Reference Lee, Huang, Chang, Lin, Su, Lee and Fujimoto17 reported the presence of a thin layer of BT on a rutile TiO2 surface and confirmed the existence of Ba–Ti–O precursor and nucleation through in situ transmission electron microscopy (TEM) observations. With regard to the mixing mechanism used to prepare the solid-state BT, Hennings et al.Reference Pithan, Hennings and Waser1, Reference Lee, Hennings and Tseng18, Reference Hennings, Seriyati Schreinemacher and Schreinemacher19 reported that BT with a low calcination temperature and a pure crystal phase (without the secondary phase, Ba2TiO4) can achieve the viscosity stability of an aqueous slurry in the MLCC process. Ando et al.Reference Ando, Yanagawa, Chazono, Kishi and Senna20, Reference Yanagawa, Senna, Ando, Chazono and Kishi21 used high-energy bead milling to prepare finer BT and proposed a two-step (nucleation → BT particle growth) schematic model of BT formation. Three important factors for solid-state BT synthesis have been proposed: an increase in contact point density between BaCO3 and TiO2, the enhanced formation rate of nucleation, and a decrease in the diffusion path due to the size reduction of the starting material after mixing. Buscaglia et al.Reference Buscaglia, Bassoli, Buscaglia and Alessio22, Reference Buscaglia, Bassoli, Buscaglia and Vormberg23 prepared nanocrystalline BT with a single phase and high tetragonality using starting materials with different particle sizes and the traditional ball milling method. They also introduced a kinetic model of nucleation and growth to explain the three steps (nucleation → BT particle growth → final reaction for TiO2 agglomerate residual) of solid-state BT formation derived from the weight loss curves. In our previous work,Reference Lee, Huang, Chang, Lin, Su, Lee and Fujimoto17 we observed the phase evolution of solid-state BT with the standard-sized BaCO3 (2 m2/g) and TiO2 (7 m2/g) and prepared 500-nm BT particles. We also observed the formation of an intermediate phase of Ba2TiO4, nucleation of BT, and the physical properties of their sintered ceramics. According to the reports of Hennings et al.Reference Hennings, Seriyati Schreinemacher and Schreinemacher19 and Buscaglia et al.,Reference Buscaglia, Bassoli, Buscaglia and Alessio22 a low calcination temperature of about 800 °C can suppress the formation of Ba2TiO4.
The aim of this study was the preparation of solid-state BT (with an average particle size of less than 250 nm) with high tetragonality with the use of ultrafine starting materials, BaCO3 (27 m2/g) and TiO2 (190 m2/g). We anticipated that the relatively low synthesized temperature could prevent the formation of a secondary phase. We are also interested in the phase evolution and morphology of BT, which are examined using in situ TEM analysis. Furthermore, the dielectric properties of the ceramics should satisfy the X7R-MLCCs’ requirement (Electric Industries Association standard: the tolerance of capacitance from −55 to +125 °C is ±15%), and these are also examined in this work.
II. EXPERIMENTAL
The starting materials, i.e., reagent grade BaCO3 (needle type, S BET = 27 m2/g) and TiO2 (S BET = 190 m2/g for 100% rutile phase), were mixed in water with a commercial high-energy bead mill with 0.1 mm media. Low molecular weight ammonium polyacrylate (Antiprex A40; Ciba, Switzerland) was used for dispersion. The Ba/Ti molar ratio was set at 1.001 through the stoichiometric method. The mixed slurry was dried at 130 °C for 24 h and pulverized. The raw powder mixture was investigated for its kinetic reaction by simultaneous thermogravimetry and differential scanning calorimetry (DSC, STA449C; Netzsch, Selb, Germany) after sieving with a 50 mesh. To examine BT formation, the raw mixture powder was loaded in a ceramic crucible and calcined at different peak temperatures (400–1000 °C) for 2 h with an air atmosphere in a batch furnace (heating rate 8 °C/min). The specific surface areas (SSAs) (S BET) of the raw mixture powder and BT were detected using Brunauer, Emmett, and Teller’s (BET) method (Model ASAP 2010; Micromeritics, Norcross, GA). The 6/ρS BET equation was used to obtain the equivalent BET diameter (d BET). The morphology, chemical composition, particle size, and microstructure of the BT raw mixture and sintered ceramics were then determined by cold field-emission (scanning) TEM with high-angle annular dark field imaging (HAADF) and an energy-dispersive x-ray spectroscope (EDS) (HF3300, Hitachi America, Pleasanton, CA) and field-emission gun scanning electron microscopy (FE-SEM, Nova Nano-SEM 230; FEI, Hillsboro, OR). A dispersed powder sample on a carbon-coated microgrid was also used for TEM sample preparation. A focused ion beam system was one of the methods used in this work for the TEM sample preparation of thin section of sintered ceramics. The phase identification of the raw material and calcined powder was undertaken by x-ray diffraction (XRD; PW3040, X’Pert MPD, PANalytical, Almelo, Netherlands) analysis. Diffractive data were refined using TOPAS 3.0 (Bruker AXS, Karlsruhe, Germany) to obtain the crystal structure and lattice parameter calculation. The Ba/Ti molar ratio of the BT sample was identified using a sequential x-ray fluorescence spectrometer (XRF, S8 TIGER/A15-X10; Bruker AXS). Calcined BT powder was mixed with commercial dopant oxides of X7R formulation, including Y, Mn, and Si. Drying, granulation, and isostatic pressing were used for the preparation of ceramic pellets. Green pellets were sintered at 1250 °C for 2 h in wet H2 (P O2 = 10−13–10−14 atm) by a base metal electrode MLCC process. The sintering conditions were optimized to reveal the grain size and core–shell structure. The density of the fired ceramics was obtained by Archimedes’ method. A Cu electrode covered both sides of the pellet at 800 °C. The temperature coefficient of capacitance (TCC) was measured at 1 kHz and 1 Vrms from −55 to 150 °C using an automated system for heating (VTM7044; Vötsch, Berlin, Germany) and capacitance detection (LCR meter E4980A, Agilent, Santa Clara, CA). The capacitance and loss factor (εr tan δ) were measured using a LCR meter 4268A. The insulation resistance (IR) was measured with a high-resistance meter (Agilent 4339B).
III. RESULTS AND DISCUSSION
A. Derivative thermogravimetry/DSC analysis
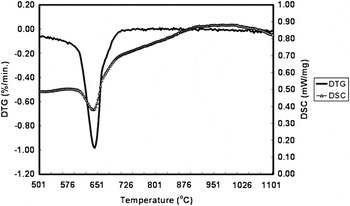
The DSC and derivative thermogravimetry (DTG) (first derivative of weight loss) curves of the mixture with a constant heating rate (5 °C/min) are reported in Fig. 1. The DSC peak position can fit the position of the DTG peak. Only one endothermic peak is shown at 640 °C. In previous report,Reference Kobayashi, Suzuki and Mizuno16–Reference Buscaglia, Bassoli, Buscaglia and Vormberg23 the presence of residual and agglomerates of TiO2 in the mixture should dominate the existence of surplus DTG peaks and the agglomerates will need a higher temperature for calcination to obtain a pure BT. In our starting material, the equivalent BET diameter of TiO2 (190 m2/g) is 8 nm, and for BaCO3 (27 m2/g), it is 52 nm. Compared with the DTG reactions proposed in the previous reports, no surplus reactions occurring over 600 °C were observed in our mixture system. A single step reaction of BT formation is obtained in this study through the decrease in particle size and the mixing process using a high-energy bead mill.
DSC and DTG curves for BaCO3 and TiO2 mixtures. Heating rate: 5 °C/min.

Kubo and ShinrikiReference Kubo and Shinriki7, Reference Kubo and Shinriki8 and Niepce and ThomasReference Niepce and Thomas14 reported a three-step reaction to synthesize BT: a thin layer of BT was first observed on the surface of TiO2, then the Ba2TiO4 phase was formed between BT and BaCO3 during the solid-state reaction of BaCO3 and TiO2, and then BT was fully synthesized. In our previous work, the presence of a thin layer of BT on a rutile TiO2 surface was also reported based on TEM observations.Reference Lee, Huang, Chang, Lin, Su, Lee and Fujimoto17 According to these reports, 600 °C may be a critical point for the first step of BT formation in solid-state synthesis, regardless of the effects of the particle size of the starting material or mixing mechanism used, as the solid-state reaction and nucleation of BT may occur at this temperature. In this study, the results of the XRD and TEM analyses will help to clarify the process of BT formation at a lower calcination temperature of 400–600 °C with an ultrafine starting material.
B. Characterization of raw mixture and calcined powders
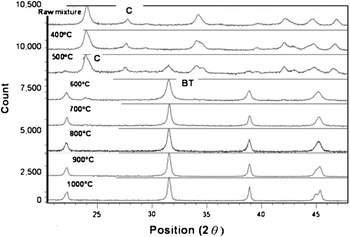
1.001 of the Ba/Ti molar ratio was detected at different calcination temperatures by XRF. The raw mixture was calcined from 400 to 1000 °C for 2 h in air, and the XRD patterns for phase identification are shown in Fig. 2. Two phases, i.e., BaCO3 and BT, were detected. The intensity of ultrafine TiO2 (rutile phase) became weaker, and the broadened (110) peak of TiO2 was not separated easily from the (021) peak of BaCO3. In the second phase, Ba2TiO4 was clearly observed during the solid-state reaction by the traditional mixing process, but it was not detected in our raw mixture system by XRD. The starting materials were only detected at temperatures of 400 °C, and no intermediate phases were observed. The BT crystal phase started to form at 500 °C, and significant decreases in the intensities of BaCO3 were observed at 600 °C. At the same time, the intensity of the BT phase dramatically increased. A pure cubic phase of BT was obtained at 800 °C, and a pure tetragonal phase (c/a ratio > 1.006) of BT was obtained at 900 °C with separate (002) and (200) peaks. Finally, tetragonal BT (c/a > 1.007) was obtained at 1000 °C.
XRD patterns of BT raw mixture at different calcination temperatures in air atmosphere (400–1000 °C) for 2 h. C, BaCO3; BT, BaTiO3.

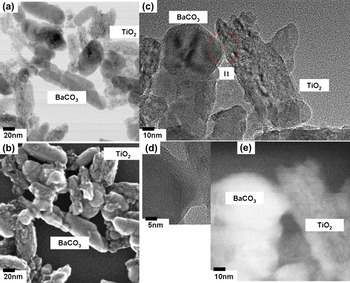
The TEM images clearly show the morphologies of the raw mixture with different calcination temperatures (Fig. 3). Figures 3(a) and 3(b) show the different morphologies of the BaCO3 and TiO2 particles in the raw mixture. The TEM images show that the BaCO3 was composed of two or three columnar particles with smooth surfaces. After the bead milling, the BaCO3 particles were crushed and cut into shorter and broken particles with a size of about 30 nm. The TiO2 was found as agglomerate particles with a spindle shape composed of many 2–3 nm spherical particles. With calcination at 400 °C, necking between the BaCO3 and TiO2 particles was observed under high resolution and HAADF imaging [Figs. 3(c) and 3(d)]. In Fig. 3(e), the bright and dark areas indicate the surface diffusion between BaCO3 and TiO2 particles (I1 area). Because barium (Ba) has an atomic number of 56, which is higher than that of titanium (Ti), which is 22, a different mass-contrast image was used for analysis of the qualitative element distribution. The results show a clear diffusion layer at 400 °C due to the surface diffusion between BaCO3 and TiO2.
TEM images of powder sample: (a) transmitted electron, (b) secondary electron images of raw mixture, (c) transmitted electron, (d) high resolution, and (e) HAADF images of the sample calcined at 400 °C in I1 area.

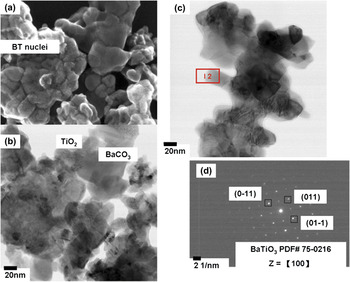
When the calcination temperature increased to 500 °C, a clear (110) peak was observed by XRD (Fig. 2), indicating the cubic BT phase. Significant BT nucleation was also observed in Fig. 4(a). In the TEM image [Fig. (4b)], we can separate the BaCO3 and TiO2 based on their distinctive morphologies, and many nanoparticles and defects were observed in these BT nuclei. A broadening (110) peak of XRD can also be seen, indicating that fine crystallites of BT formed at 500 °C compared to the sample produced at a higher calcination temperature, based on Scherrer’s equation. BT formation and growth occurs at this stage, even though we can not obtain a clear selected diffraction pattern from the TEM analysis to confirm whether these BT nuclei were cubic BT. However, the data from DTG and XRD analyses suggest that the rapid formation of BT occurred due to the use of ultrafine TiO2.
TEM images of powder sample: (a) secondary electron, (b) transmitted electron images of sample calcined at 500 °C, (c) transmitted electron image, and (d) selected area diffraction pattern of the sample calcined at 600 °C.

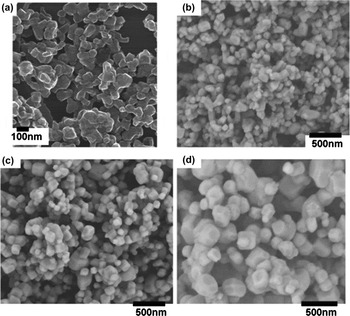
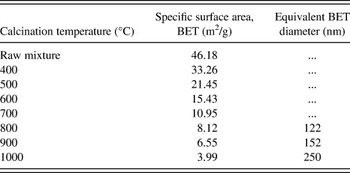
Twenty-nanometer cubic BT without lattice defects was obtained at 600 °C [Fig. 4(c)], while a weak BaCO3 peak was still detected at this calcination temperature (Fig. 2). The selected area diffraction pattern shown in Fig. 4(d) demonstrates that the unitary particles of cubic BT formed with a spot pattern belonging to the space group Pm3m (No. 75-0216). At 700 °C, BT particles were grown with a size ranging from 50 to 80 nm with a narrow particle size distribution [Fig. 5(a)], and the nuclei crystallites disappeared at this temperature. The XRD results show that a residual BaCO3 peak was still detected at this calcination (Fig. 2). FE-SEM was used to observe the BT morphology from 800 to 1000 °C. When the calcination temperature rose to 800 °C, a pure cubic BT phase with an average particle size of 120 nm was obtained [Fig. 5(b)]. A pure tetragonal phase (c/a ratio > 1.006) of BT was obtained at 900 °C, with an average particle size of 150 nm [Fig. 5(c)]. Finally, a pure tetragonal BT (c/a > 1.007) was obtained at 1000 °C, with an average particle size of 250 nm [Fig. 5(d)]. The SSA and equivalent BET diameters of the raw mixture and calcined BT are shown in Table I.
Morphologies (obtained by TEM and FE-SEM) of powder sample calcined at (a) 700 °C, (b) 800 °C, (c) 900 °C, and (d) 1000 °C for 2 h.

SSAs of calcined BT powders.

C. Electric properties of ceramics
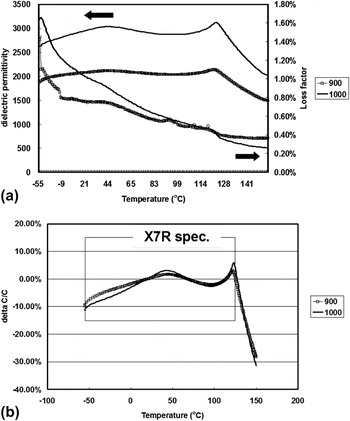
Relative densities of more than 95% are shown in Table II for the sintered ceramics prepared from the BT samples obtained at calcination temperatures of 900 and 1000 °C because the pure tetragonal BT phase was obtained at these two conditions. The theoretical density was assumed to be 6.02 g/cm3. According to the temperatures of the relative dielectric permittivity curves and TCC curves [Figs. 6(a) and 6(b)], the 900 and 1000 °C calcination samples have the typical core–shell properties of the X7R ceramic.Reference Hennings and Rosenstein24–Reference Wang, Wang, Wen and Li27 The Curie point was at 125 °C for both samples, while the dielectric loss curves show clear turning points at −53 and 125 °C, and these should belong to the phase transition of BT. The two samples showed a similar trend that the dielectric loss decreased with the increase in temperature. With 900 °C sample, there are two more turn points at −9 and 95 °C in the dielectric loss curve, and these may show the dielectric properties of the solid solution during the diffuse phase transition between the finer BT and the dopants.Reference Hennings28 However, both the two samples could satisfy the X7R specifications [Fig. 6(b)]. A relative permittivity of 2100 and a loss factor of 0.4% at room temperature were obtained for the 900 °C sample. The 1000 °C calcined sample had a higher dielectric permittivity (εr ∼ 3000), but a higher loss factor (0.7%) was detected at room temperature. The dielectric permittivity and loss factor increased along with the BT calcination temperature. Tsurumi et al.Reference Tsurumi, Sekine, Kakemoto, Hoshina, Nam, Yasuno and Wada4 reported that greater dielectric permittivity was obtained with a higher density and tetragonality of fine BT particles. The defects that cause a low dielectric permittivity, such as grain boundary, internal surfaces and nanopores, dislocations, and OH lattice defects, should not be found inside the BT particles. At the solid state synthesized BT samples in this study, all these defects may be eliminated with calcination at temperatures from 600 °C up. Furthermore, both the samples had an IR that was higher than 106 MΩ.
(a) Temperature dependences of the relative dielectric permittivity and loss factor and (b) TCC curves. The ceramic pellets were from the powder samples calcined at 900 and 1000 °C.

Characteristics of ceramic pellets from different calcined BT powders sintered at 1250 °C for 2 h in wet H2.

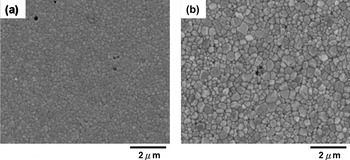
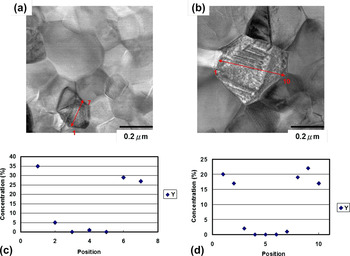
Figures 7 and 8 are SEM and TEM micrographs, respectively, which show the grain size distribution and core–shell structure in a BT grain sintered in a reducing atmosphere (1250 °C for 2 h in wet H2). The grain size is clearly revealed after effective thermal etching (1100 °C for 30 min), and the average grain size is 189 nm for the 900 °C sample and 313 nm for the 1000 °C sample. A fully dense and homogeneous grain size distribution was obtained in both samples. The grain growth occurred during the sintering. Compared to the particle size of BT powder (Table I), the increase in grain size is 24% and 25% for 900 and 1000 °C samples, respectively. The core–shell structure in a BT grain, as observed by TEM, is shown in Fig. 8. Base on previous reports,Reference Tsurumi, Sekine, Kakemoto, Hoshina, Nam, Yasuno and Wada4, Reference Mizuno, Hagiwara and Kishi5, Reference Hennings and Rosenstein24–Reference Chazono and Fujimoto29 the core region reveals a pure tetragonal BT with ferroelectric properties, and the paraelectric pseudocubic shell is consists of solid solution with BT and dopants. In typical TCC curves of X7R material, the high dielectric permittivity of the Curie point is a property of the core, whereas the shell has low dielectric permittivity at room temperature. The diffuse phase transition leads to the X7R feature of a stable dielectric constant with regard to temperature. In Fig. 8(b), a core region with a domain structure that is covered by a shell without a domain structure can be clearly seen in the 1000 °C sample. Compared to the 900 °C sample [Fig. 8(a)], it is slightly easier to find a complete core–shell structure in the 1000 °C sample. One of the dopant elements, Yttrium (Y), is detected by scanning-transmission electron microscopy with energy dispersive x-ray spectroscopy (STEM-EDS), and its distribution is shown in Figs. 8(c) and 8(d). Y is located in the shell region and grain boundary, whereas the absence of Y is observed in the core region. In previous reports,Reference Mizuno, Hagiwara and Kishi5, Reference Kishi, Okino, Honda, Iguchi, Imada, Takahashi, Ohsato and Kuda25, Reference Wang, Wang, Wen and Li27 Mg and Y were the basic elements forming the shell region in a BT grain through the solid-state diffusion or a dissolution/precipitation mechanism.Reference Hennings and Rosenstein24, Reference Randall, Wang, Laubscher, Dougherty and Huebner26 In our observation, the finer grain distribution of the 900 °C sample has a lower dielectric constant with fewer domain walls in the core–shell structure, and the nonhomogeneous distribution of the shell and core regions may be one of reasons for this. A good dispersion between dopants and finer BT particles, and a suitable sintering process, should thus be helpful to improve the dielectric properties in finer BT system.
FE-SEM micrographs of the ceramic pellets sintered at 1250 °C for 2 h in wet H2 for the powder samples calcined at (a) 900 °C and (b) 1000 °C.

TEM micrographs of the ceramic pellets sintered at 1250 °C for 2 h in wet H2 for the powder samples calcined at (a) 900 °C and (b) 1000 °C; their STEM-EDS line profiles for the core–shell structures: (c) 900 °C and (d) 1000 °C, showing the distribution of Y.

In conclusion, using the approach described in this work, BT particles with an average particle size of 250 nm and high tetragonality were prepared by solid-state synthesis, which produced X7R ceramics with high dielectric permittivity, high IR, and a clear core–shell structure.
IV. CONCLUSIONS
The present study investigated the phase evolution and nuclei growth of solid-state BT powder and the dielectric properties of the related ceramics with an ultrafine starting material. The results of the DTG curve for a mixture of BaCO3 and TiO2 clearly showed that there was only one reaction step at 600 °C. Surface diffusion between BaCO3 and TiO2 was clearly observed at a relatively low temperature of 400 °C. The rapid formation of BT nuclei and the cubic BT phase was observed at 500 °C by XRD and TEM. At 800 °C, a pure cubic BT phase with an average particle size of 120 nm was obtained. A pure tetragonal phase (c/a ratio > 1.006) of BT was obtained at 900 °C, with an average particle size of 150 nm. Finally, a pure tetragonal BT phase (c/a > 1.007) was obtained at 1000 °C, with an average particle size of 250 nm. The temperature–dielectric permittivity and TCC curves reveal the X7R (core/shell) dielectric properties of the 900 and 1000 °C sample ceramics. A relative permittivity of 2100 and a loss factor of 0.4% at room temperature were found for the 900 °C sample. The 1000 °C calcined sample had higher dielectric permittivity (εr ∼ 3000) and a greater loss factor (0.7%) at room temperature, and a high IR of 106 MΩ was obtained. A core–shell structure rich in Y in the shell region was also observed in this study. In short, single phase 120-nm cubic BT and 250-nm tetragonal BT particles, which produced ceramics with high dielectric permittivity and IR, were obtained in this study.
ACKNOWLEDGMENTS
T-T.L. would like to thank Yageo Corporation for supporting the Ph.D. program. This work was supported by the National Science Council of Taiwan under Contract No. NSC 100-2221-E-006-134-MY3.