Introduction
Upon exposure to radiation environments, materials typically experience damage in the forms of defects such as vacancies, interstitial defects, dislocation loops, point defect clusters, voids, and cavities, each associated with their distinct dimensionality. Over time, the accumulation of such defects can severely degrade a material’s mechanical, physical, and chemical performance. Regardless of its crystal structure (FCC, BCC, or HCP), the engineering of radiation resistance materials focuses primarily mostly on the management rather than the prevention of radiation-induced defects. Grain and phase boundaries are key microstructural elements in the management of radiation-induced defects in crystalline materials. Indeed, these boundaries can be considered as preexisting microstructural defect sinks capable of trapping and potentially eliminating small-scale radiation-induced defects. Due to their abundance of grain and phase boundaries, nanostructured materials have been identified as one ossible class of materials possessing radiation resistance superior to conventional materials [Reference Zhang, Hattar, Chen, Shao, Li, Sun, Yu, Li, Taheri, Wang, Wang and Nastasi1]. Numerous examples of nanostructured materials take advantage of the defect sink capacities of boundaries to alleviate radiation damage, including nanocrystalline materials with a high density of small grains [Reference Rose, Balogh and Hahn2, Reference Radiguet, Etienne, Pareige, Sauvage and Valiev3], nanotwinned metals with a high density of twin boundaries [Reference Demkowicz, Anderoglu, Zhang and Misra4, Reference Li, Yu, Chen, Song, Wang, Kirk, Li and Zhang5], multilayer nanocomposites with a high density of stacked heterophase boundaries [Reference Demkowicz, Hoagland and Hirth6, Reference Chen, Tang, Yang, Huang, Liu, Li and Chen7], and nanoporous materials containing a large number of free surfaces [Reference Sun, Bufford, Chen, Kirk, Wang, Li, Wang, Maloy and Zhang8, Reference Li, Fan, Ding, Xue, Chen, Li, Wang and Zhang9].
Of particular interest to this study are metallic nanocomposites with heterophase layer interfaces [Reference Demkowicz, Hoagland and Hirth6, Reference Chen, Tang, Yang, Huang, Liu, Li and Chen7, Reference Beyerlein, Mayeur, Zheng, Mara, Wang and Misra10, Reference Beyerlein, Demkowicz, Misra and Uberuaga11] acting as defect sinks to improve radiation tolerance. Layered nanocomposites are unique in terms of the multiplicity of length scales available to design and optimize their radiation resistance. Geometrically speaking, the layer thickness of each constituent provides an extrinsic length scale that can be controlled down to a few nanometers to devise the overall and effective sink strength and sink efficiency of the nanocomposite. Alternatively, the physical structure of the heterophase boundaries and the chemical nature of the chemical bonds formed across interface planes [Reference Chen, Dingreville and Deo12] provide intrinsic length scales that can be leveraged to manage radiation-induced defects. At the intersection of these length scales, there is also the inherent length scale associated with the interactions between the defects and the boundaries, the complexity of which cannot be understated. In this study, we primarily explore intrinsic size effects of the defect–boundary interactions.
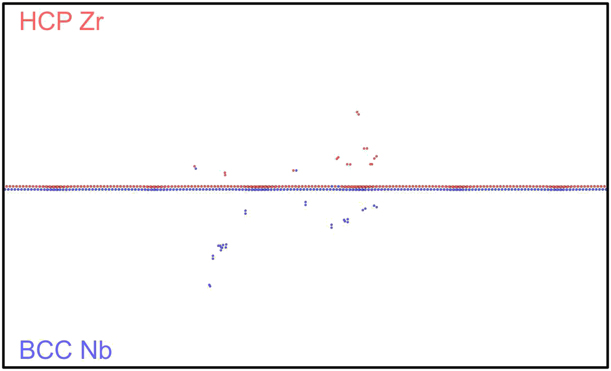
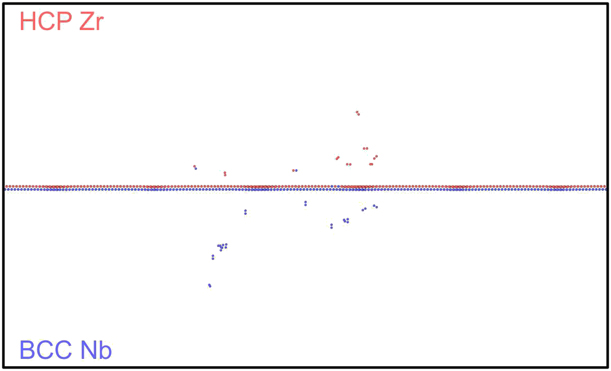
Due to the atomic nature of the radiation-induced damage production, researchers have used molecular dynamics (MD) and atomic kinetic Monte Carlo (akMC) models to study intrinsic size effect phenomena of defect–interface interactions. Many researchers have focused on the role of phase boundaries as a microstructural component to enhance sink efficiency and sink strength. They studied the effects of either misfit dislocation arrays [Reference Wang, Zhang, Zhou, Beyerlein and Misra13, Reference Chen, Shao, Liu, Yadav, Li, Mara and Wang14] or elastic interactions (coherency stresses) [Reference Vattré, Jourdan, Ding, Marinica and Demkowicz15, Reference Zarnas, Dingreville and Qu16] to draw conclusions on defect sink characteristics based on thermodynamic considerations of point defect energetics near these boundaries. Other researchers [Reference Demkowicz, Hoagland and Hirth6] have explicitly investigated defect–boundary interactions between pristine boundaries and isolated or few cascade(s). However, these studies only capture the extremely early stage of defect–boundary interactions. For instance, Fig. 1 shows the result of a 10-keV cascade interacting with a pristine Zr–Nb boundary. This example illustrates not only that the defects produced are few and far between, but also that the interfacial structure remains largely intact. While a few researchers [Reference Chen, Tang, Yang, Huang, Liu, Li and Chen7, Reference Heinisch, Gao and Kurtz17, Reference Zhang and Demkowicz18, Reference Zhang and Demkowicz19] have studied the morphological evolution of phase boundary structures as triggered by irradiation-induced intermixing, to our knowledge, none thus far have considered how the morphology changes the defect–boundary interactions.
Remaining point defects after a 10 keV Primary Knock-on Atom (PKA) collision cascade in the vicinity of a Zr–Nb phase boundary. Atoms colored in blue correspond to the point defect in BCC Nb. Atoms colored in red correspond to the point defect in HCP Zr.
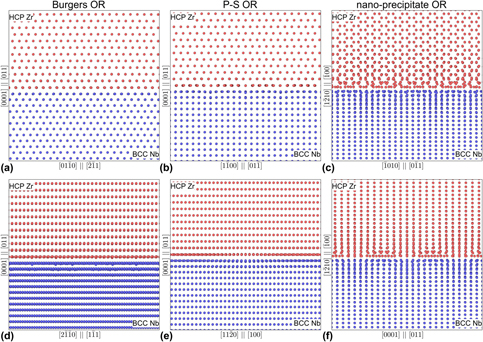
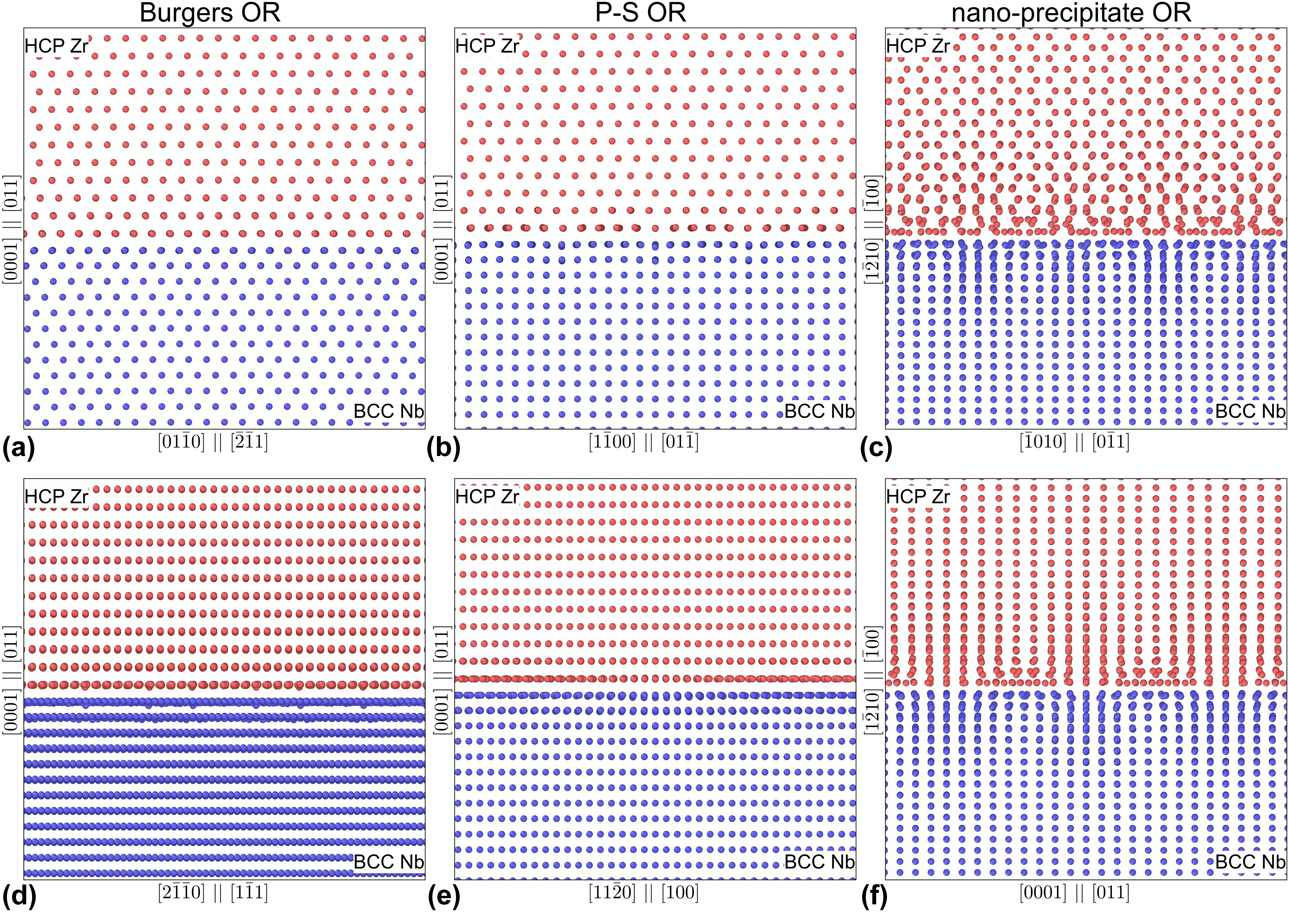
In this study, we simultaneously examine the morphological evolution of both the phase boundary structures and the irradiation defects. Using Zr–Nb [Reference Nikulina20] as a case study, we investigate how defect–boundary interactions and their associated intrinsic length scales change over a large dose range. We consider three common interfacial stacking orientation relationships (ORs) for HCP (Zr) and BCC (Nb) multilayers. The first two ORs share similar stacking interfacial planes of (0001)‖(011), with the  $\left[ {2\bar{1}\bar{1}0} \right]{\parallel} \left[ {1\bar{1}1} \right]$ and the
 $\left[ {11\bar{2}0} \right]{\parallel} \left[ {100} \right]$ alignments known as the Burgers [Reference Burgers21] and Pitsch–Schrader (P–S) [Reference Pitsch and Schrader22], respectively. These two stacking orientations have been observed experimentally in similar HCP–BCC Mg–Nb multilayers by Chen et al. [Reference Chen, Shao, Liu, Yadav, Li, Mara and Wang14]. The third OR consists of
 $\left( {1\bar{2}10} \right){\parallel} \left( {\bar{1}00} \right)$ and
 $\left[ {\bar{1}010} \right]{\parallel} \left[ {0\bar{1}1} \right]$ orientations and is taken directly from high-resolution transmission electron microscopy (TEM) studies of Nb nanoprecipitates in Zr [Reference Ribis, Doriot and Onimus23]. All three structured interfaces are illustrated in Fig. 2.
Structured multilayer interfaces for Burgers OR (a) and (d), P–S OR (b) and (e) and nanoprecipitate OR (c) and (f).
The paper is organized as follows. In section “Mechanisms for defect accumulation in bulk phases,” we establish the mechanisms for defect accumulation in both bulk phases. In section “Mechanisms of defect accumulation in multilayer heterophase boundaries,” we quantify the boundary effect on the defect evolution. In section “Discussions,” we discuss the effect of irradiation intermixing on the morphology of the interfaces. Lastly, in the section “Methods,” we describe the novel atomistic technique, known as the Frenkel pair accumulation (FPA) method. This technique consists of cumulatively introducing point defects in the atomistic system to accelerate the simulation of irradiation processes and defect evolution.
Results
Mechanisms for defect accumulation in bulk phases
To understand the morphology evolution of both the phase boundary structure and the irradiation-induced defects, we must first examine the defect accumulation in isolated bulk metals.
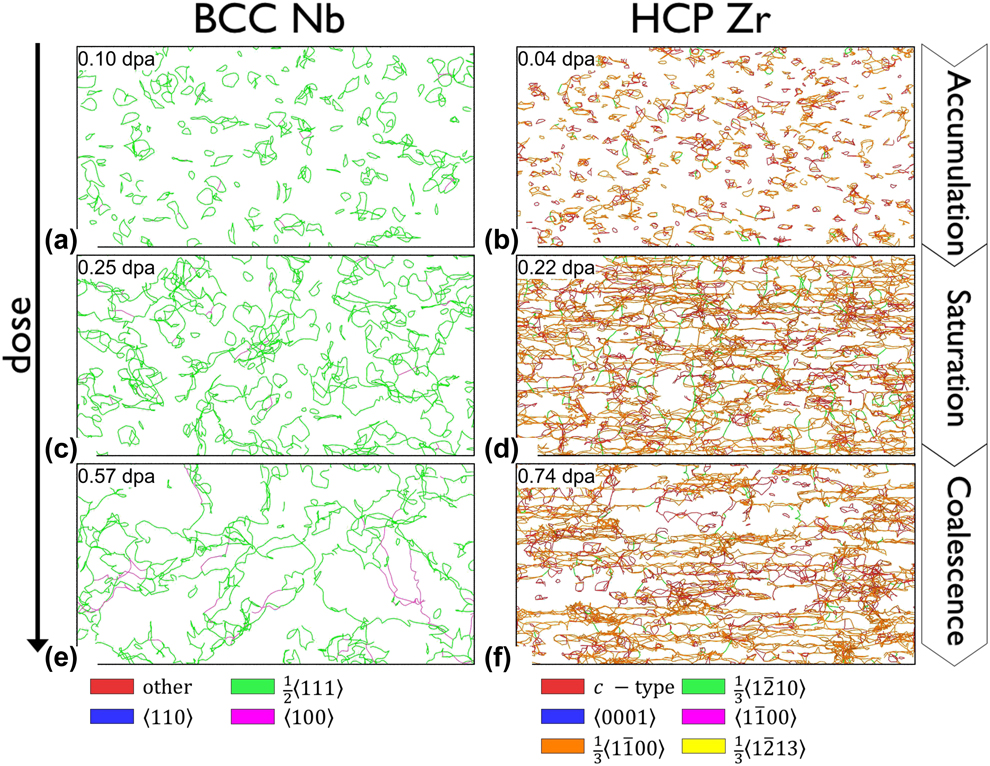
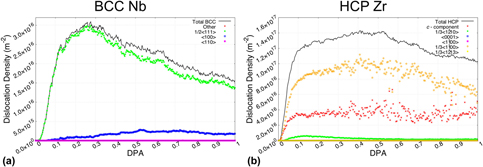
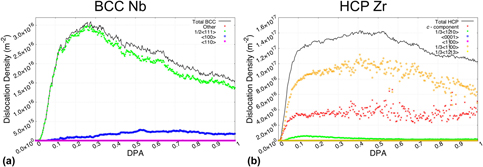
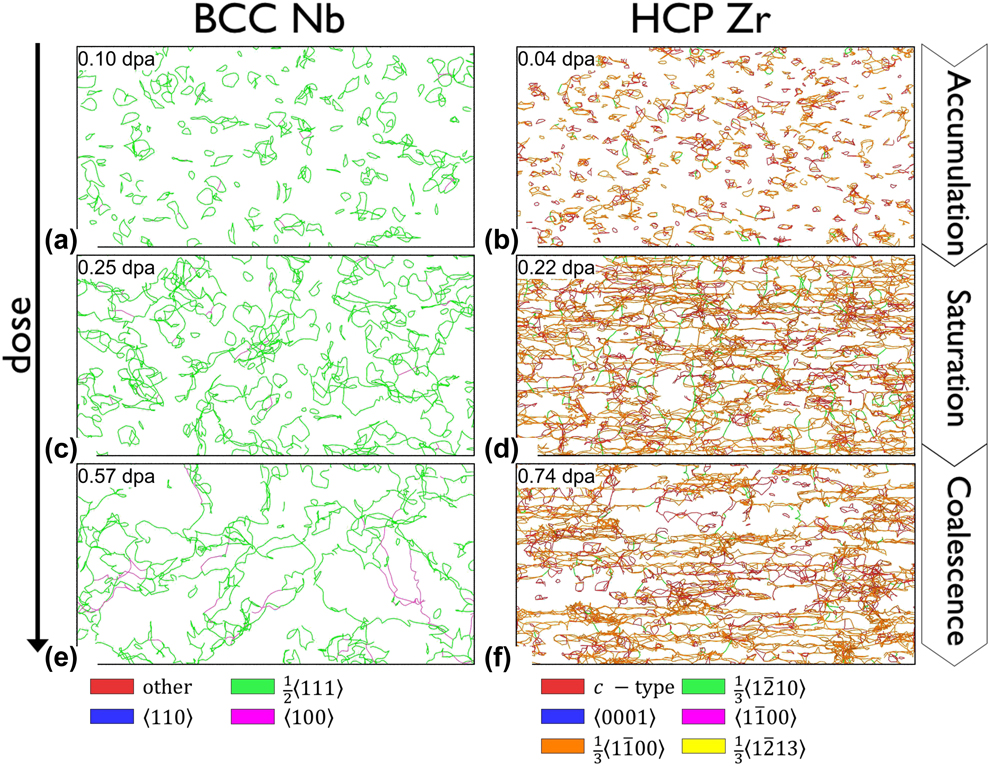
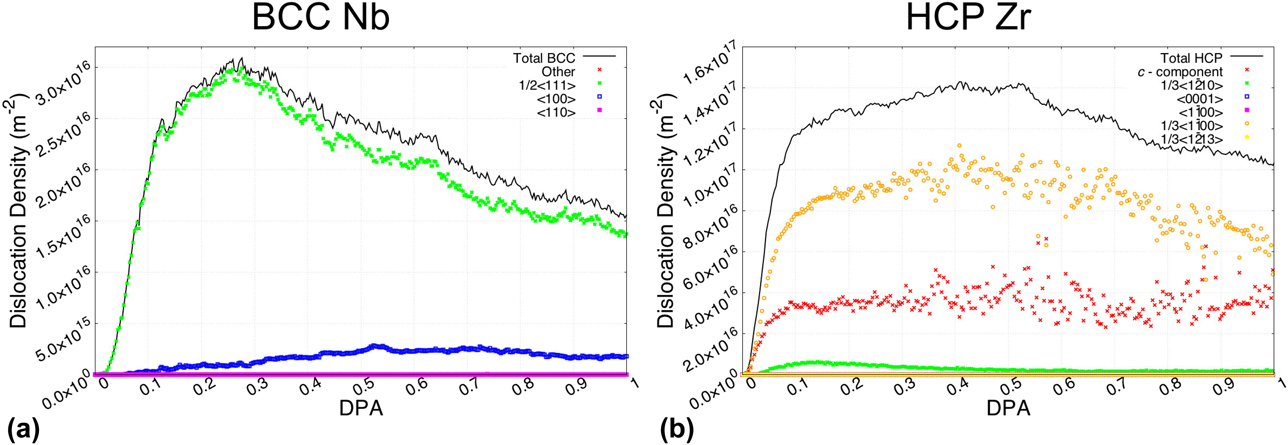
To this end, we have simulated defect accumulation up to a damage level of 1 dpa in the two bulk systems of HCP Zr (1,347,840 atoms) and BCC Nb (1,756,512 atoms), respectively. Note that over the large dose/damage level examined, the primary defects generated are dislocations. While point defect accumulation and clustering processes are present, they are not explicitly shown. We illustrate in Fig. 3 the three primary stages of dislocation defect evolution in bulk Zr and bulk Nb: (i) accumulation, (ii) saturation, and (iii) coalescence. In complement, we also provide in Fig. 4 the quantification of dislocation density, by type, as a function of the dose.
Process of the defect accumulation in Nb and Zr bulk phases: (a) and (b) correspond to the defect accumulation stage; (c) and (d) correspond to the defect saturation stage; and (e) and (f) correspond to the defect coalescence stage.
Dislocation density versus displacement-per-atom (dpa) in (a) BCC Nb bulk phase and (b) HCP bulk phase Zr. The total dislocation density is partitioned as a function of the nature of the dislocation loops as indicated by the various symbols.
For ease of comparison with the multilayer systems, we assume each bulk metal acting as a half volume of a reference multilayer. Dislocation densities in bulk metals are calculated as:
 $${\rho _{{\rm{Zr|Nb}}}} = {{{N_{{\rm{Zr|Nb}}}}} \over {{V_{{\rm{Zr}}}} + {V_{{\rm{Nb}}}}}}\quad {\rm{and}}\quad {V_{{\rm{zr}}}} = {V_{{\rm{Nb}}}}\quad ,$$
where N Zr|Nb is total length of dislocation segments in Zr and Nb, respectively, and V Zr and V Nb are the volumes of the bulk Zr and Nb phases, respectively.
Throughout the process of dislocation generation and evolution, each stage can be associated with an intrinsic size scale related to the defect evolution:
(i) The first stage consists of the production exclusively of small dislocation loops, formed by the clustering of point defects. Due to the relatively sparse distribution of dislocations, interactions between neighboring defects are infrequent. Consequently, small loops do not experience any growth and simply accumulate in quantity at a constant rate. In Figs. 4(a) and 4(b), this first stage is identified by the initial sharp rise in dislocation density from 0.0 to 0.1 dpa.
(ii) The second stage begins when the dislocation density reaches a sufficient concentration, and interactions between neighboring small dislocations loops become more frequent. Initial interactions between small dislocation loops tend to form compound dislocation structures, which over time (i.e., as the damage level increases) collapse into larger, more stable dislocation loops. This process is what is referred to as coalescence. As a result, the second stage contains both small and medium dislocation loops. With the coalescence process, there is some loss of dislocation content due to the reorganization of compound dislocations. This counteracts the effect of dislocation accumulation, slowing the growth of the dislocation densities. At that moment, the balance remains in favor of accumulation, as dislocation densities slowly climb to peak saturations. For BCC Nb [Fig. 4(a)] and HCP Zr [Fig. 4(b)], the second stage occurs at 0.1 dpa → 0.3 dpa and 0.1 dpa → 0.5 dpa, respectively.
(iii) By the time the defect evolution reaches the third and last stage, significant coalescence between dislocation loops has already occurred to form large sprawling dislocation forests, nanometers in size. While small dislocation accumulations are not apparent at this stage, they are still present. The only difference here is that the newly nucleated small dislocation loops quickly latch onto and merge with the existing large dislocations. Further coalescence of medium and large dislocation loops continues to lower the dislocation densities at this stage. At higher doses, the depletion of dislocations also becomes visually apparent, as seen in Figs. 3(e) and 3(f).
Overall, the accumulation of defects is not a simple matter of density, but rather a complex evolution of defect sizes with two competing processes of accumulation and coalescence. It should be noted that all three stages described above can also be found in other material systems [Reference Chartier, Onofri, Van Brutzel, Sabathier, Dorosh and Jagielski24].
One unique feature of the HCP phase is the nature of the dislocations generated based on the type of irradiation condition [Reference Jostsons and Farrell25, Reference Griffiths26]. Particularly, in the well-studied case of zirconium [Reference Northwood, Gilbert, Bahen, Kelly, Blake, Jostsons, Madden, Faulkner, Bell and Adamson27, Reference Griffiths, Loretto and Smallman28, Reference Griffiths29], the dislocation types and quantities can be directly compared against experimental results. As plotted in Fig. 4(b), the three main types of dislocations are c-component,  ${1 / {3\left\langle {1\bar{1}00} \right\rangle }}$, and
 ${1 / {3\left\langle {1\bar{2}10} \right\rangle }}$, in decreasing order of concentrations. The c-component-type dislocations can be further categorized into subtype classifications, namely
 ${1 / {6\left\langle {20\bar{2}\bar{3}} \right\rangle }}$,
 ${1 / {9\left\langle {1\bar{1}03} \right\rangle }}$,
 ${1 / {18\left\langle {\bar{2}\bar{4}63} \right\rangle }}$, and
 ${1 / {18\left\langle {\bar{4}043} \right\rangle }}$. The presence of c-component-type dislocations and the absence of 〈a〉-type
 $\left( {{1 / {3\left\langle {\bar{1}\bar{1}20} \right\rangle }}} \right)$ dislocations provide a fairly close match to the experimental case of high-dose electron irradiation [Reference Griffiths29, Reference Griffiths30]. This validation is not entirely surprising, as the FPA method used to introduce radiation-induced damage (see section “Methods”) is tailored to rapidly generate dispersed point defects, much like electron irradiation.
Mechanisms of defect accumulation in multilayer heterophase boundaries
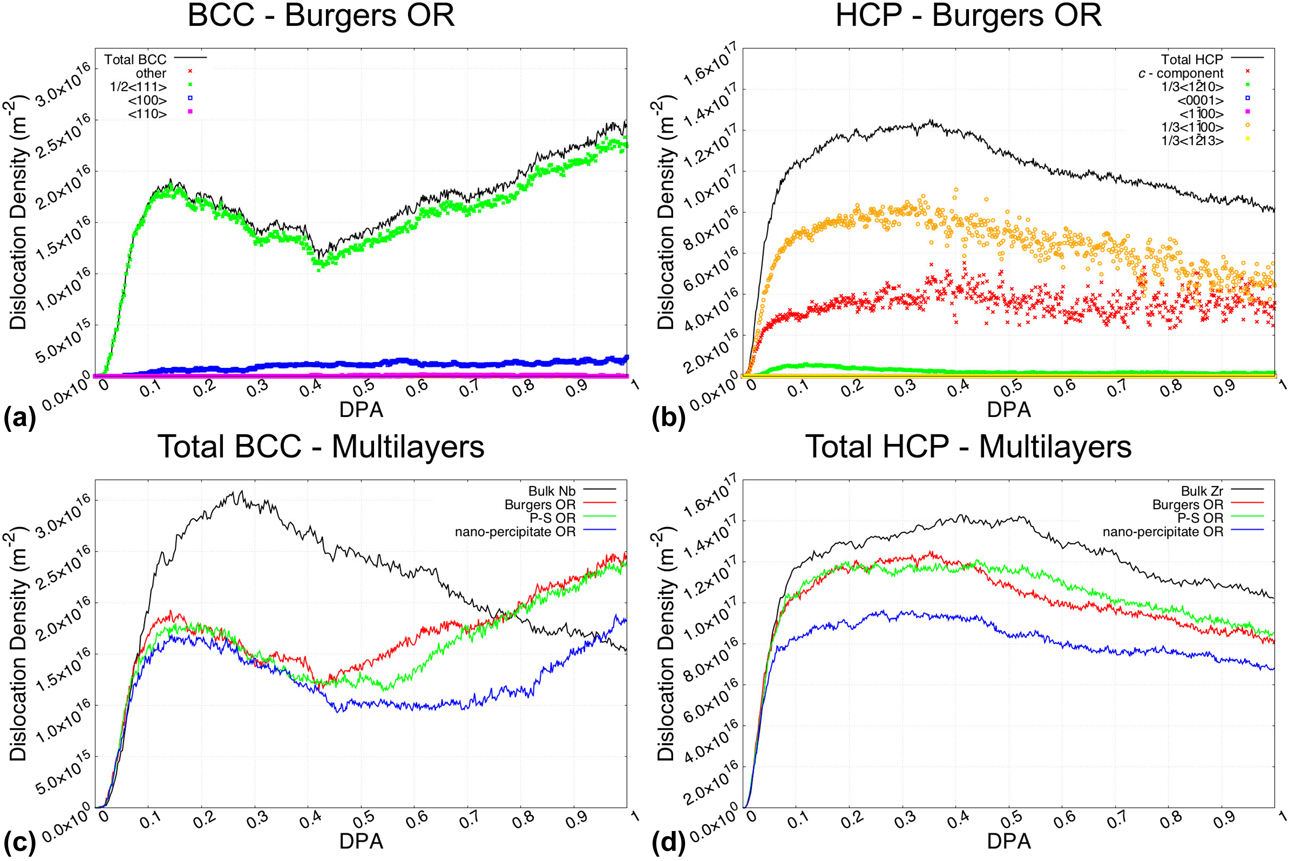
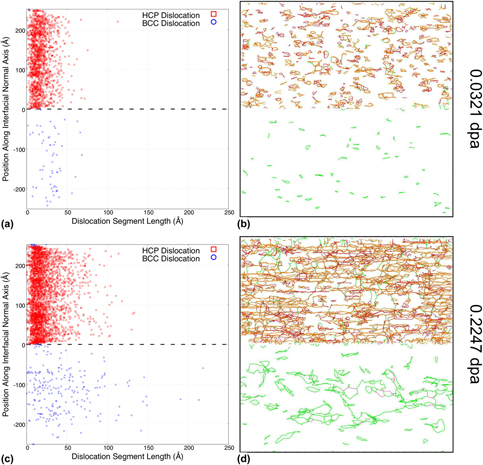
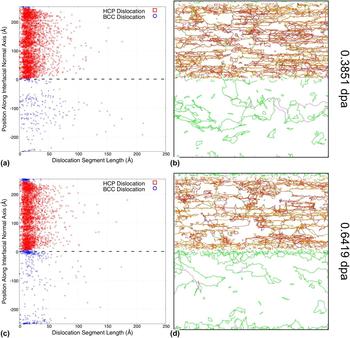
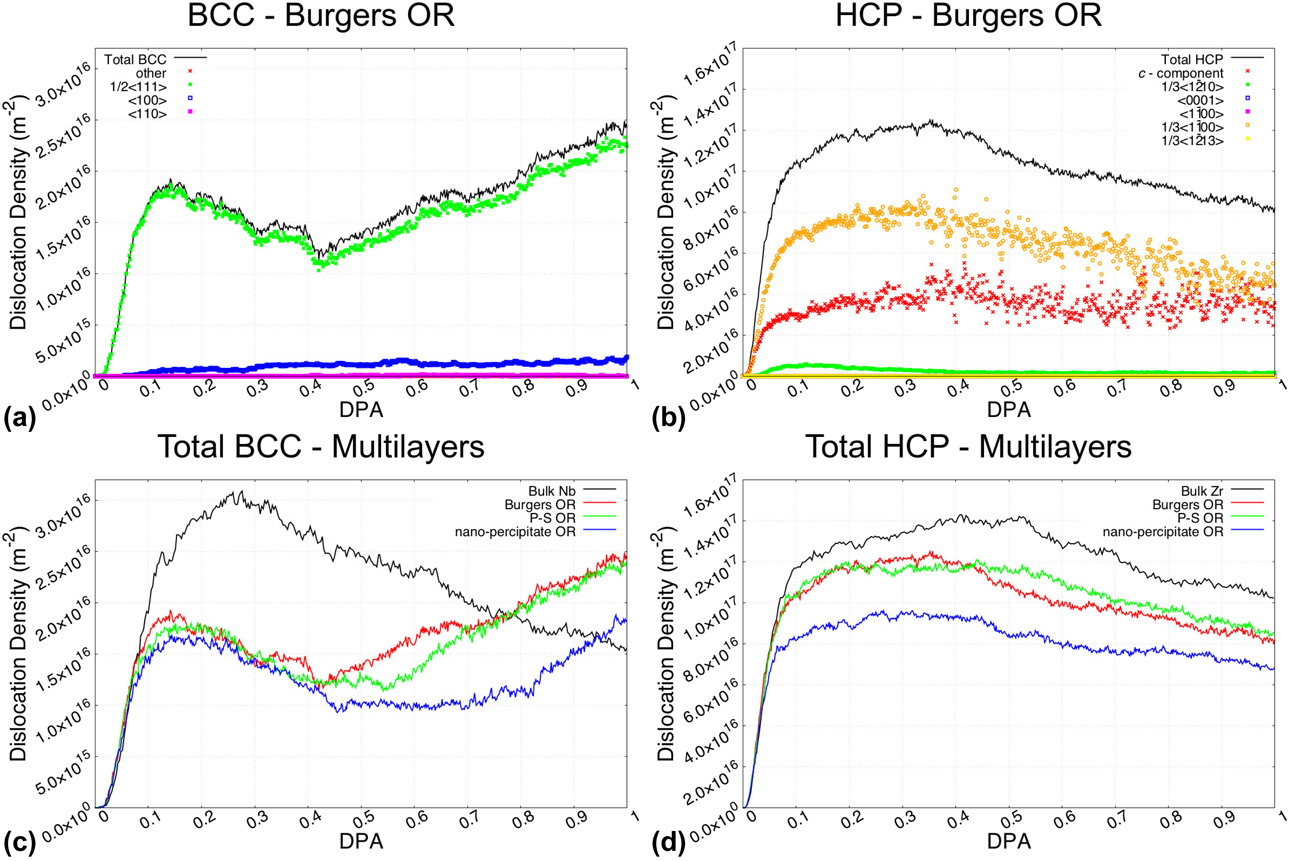
Having established the mechanisms for defect evolution in each respective bulk phase, we now examine the mechanisms of defect accumulation in the corresponding multilayer heterophase boundaries. In Fig. 5, we present the evolution of the dislocation densities as a function of the damage level for the three multilayer ORs considered. For reference, we compare the total dislocation densities against those of the bulk phases. Using the Burgers OR multilayer as a representative example, we show in Figs. 6 and 7 the evolution of the dislocation contents as a function of the damage level, along with the set of dislocation position versus length (PvL) scatterplots. We focus the majority of the discussion in this subsection on the evolution of the BCC dislocation contents, as there are significant differences in defect accumulations compared to that of the bulk Nb.
Dislocation density evolution in Zr–Nb phase multilayers. (a) Dislocation density in Burgers OR multilayer in the BCC phase. (b) Dislocation density in Burgers OR multilayer in the HCP phase. (c) Comparison of total BCC dislocation densities in bulk Nb with the Nb phase of the multilayered nanocomposite for all orientations studied. (d) Comparison of total HCP dislocation densities in bulk Zr with the Zr phase of the multilayered nanocomposite for all orientations studied.
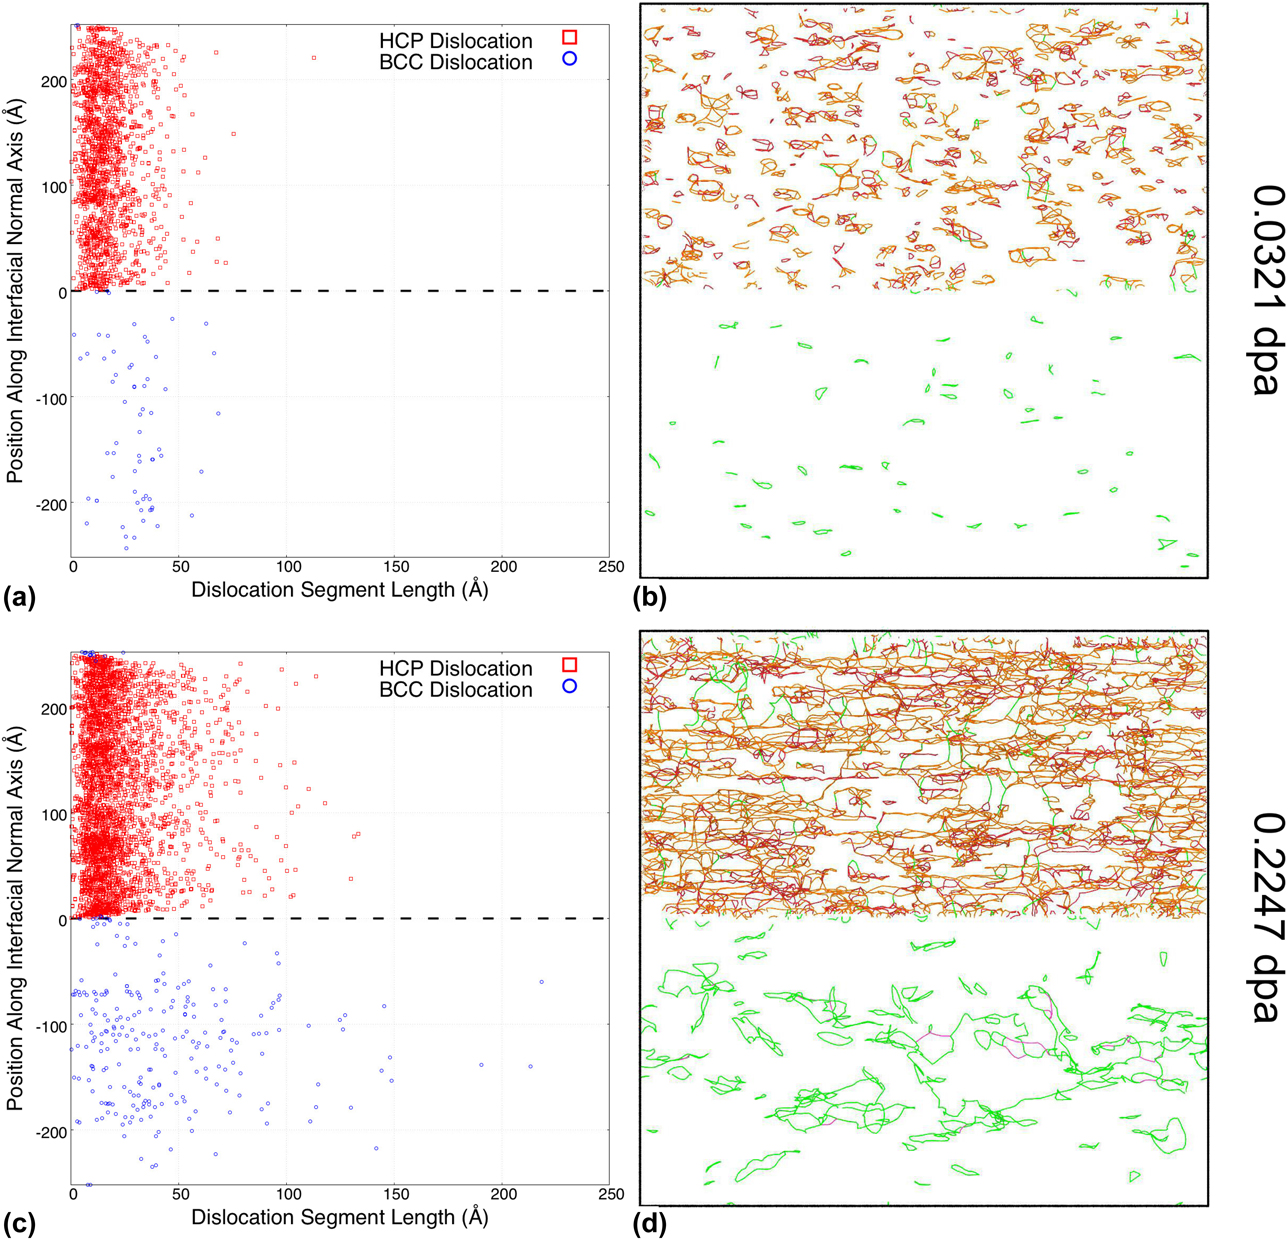
Early stages of dislocation evolution at the Burgers OR phase boundary. Scatter plots (a) and (c) correspond to the dislocation segment length location along the direction normal to the interface at a dose of 0.0321 dpa and 0.2247 dpa, respectively. (b) and (d) Illustrate the distribution of dislocation loops in the vicinity of the Zr–Nb multilayer Burgers OR phase boundary at a dose of 0.0321 dpa and 0.2247 dpa, respectively.
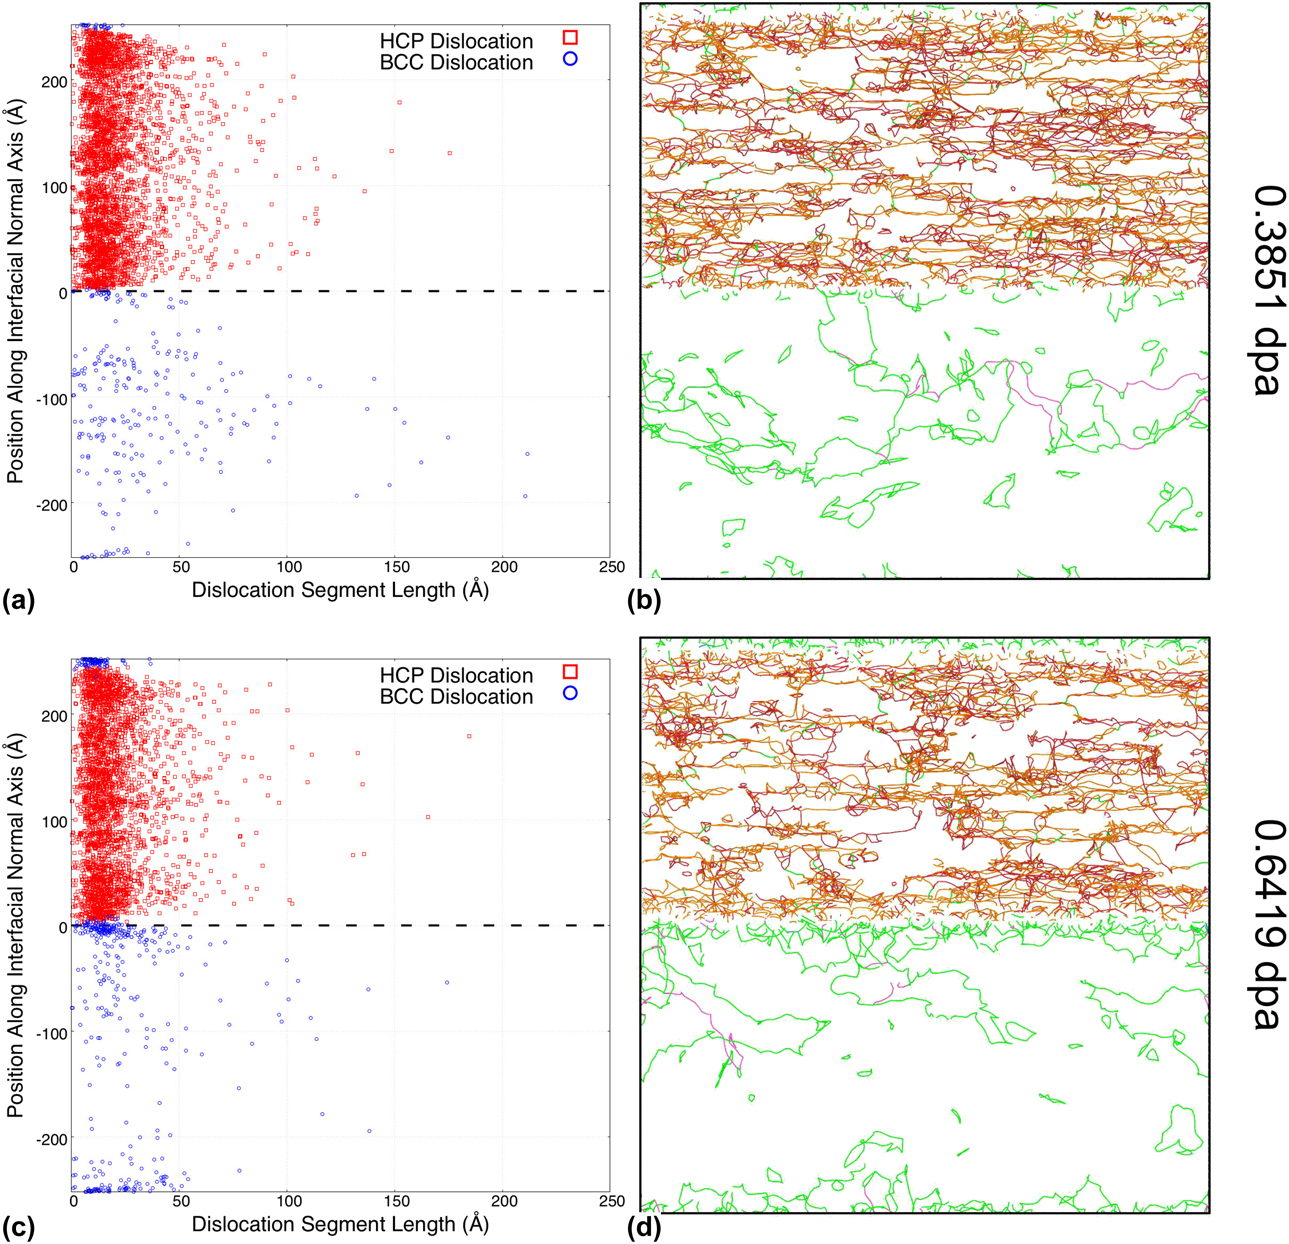
Intermediate and late stages of dislocation evolution at the Burgers OR phase boundary. (a) and (c) Correspond to the dislocation segment length location along the direction normal to the interface at a dose of 0.3851 dpa and 0.6419 dpa, respectively. (b) and (d) Illustrate the distribution of dislocation loops in the vicinity of the Zr–Nb multilayer Burgers OR phase boundary at a dose of 0.3851 dpa and 0.6419 dpa, respectively.
At a first glance, the distribution of BCC dislocation types remains fairly similar to those observed in the bulk phase within the low dose range. However, we observe a secondary increase in the dislocation density when the damage level reaches approximately 0.428 dpa. As discussed later, this evolution is actually a feature of the complex interaction between defect accumulation and boundary morphology.
For the quantitative comparison of phase boundary effects, we plot the total BCC dislocation densities of the multilayers and bulk Nb in Fig. 5(c). In addition to confirming the ubiquitous appearance of the secondary increase in dislocation density, this plot also reveals a significant drop in initial dislocation density for the multilayered nanocomposite case. This, however, falls within the range of expectation, since the grain boundaries are known to act as sinks that absorb small-sized defects.
Unlike those shown for BCC, the HCP dislocation densities in the Zr phase of the multilayered nanocomposite presented in Figs. 5(b) and 5(d) remain largely similar to that of the bulk Zr phase. The distributions of dislocation types in all three multilayers also do not deviate significantly from those in the bulk cases shown in Fig. 4(b). The only discernible effect of the phase boundaries is a slight decrease in the total dislocation densities. There is no counterpart to the secondary increase in dislocation density feature observed in the BCC phase.
It is important to note that there do exist a significant overlap in dislocation evolutions in the Burgers and P–S OR multilayered nanocomposite configurations. This is perhaps a case against the effect of phase boundary microstructures, as the only difference between the two (0001)‖(011) ORs is their stacking order. Conversely, the outlier nanoprecipitate OR points to a significant dependence of defect accumulation on the bulk crystalline orientations.
Defect absorption by the phase boundary
To better illustrate the boundary absorption mechanism, we illustrate two early stages of defect accumulation in the Burgers OR multilayer in Fig. 6. Here, we primarily focus on the dislocation evolution in the BCC sublattice. We illustrate the initial stage of small dislocation loop accumulation corresponding to 0.0321 dpa in Figs. 6(a) and 6(b). At this dose level, the dislocation loops are all relatively small and evenly distributed throughout the bulk volumes, much like those observed in the bulk phase. Obvious deviations from the bulk behavior do not appear until the coalescence of larger dislocation loops, as shown in Figs. 6(c) and 6(d). At a damage level of 0.2247 dpa, we observe that large dislocation loops tend to form at the center of the bulk lattice, away from the interfaces. This is due to the cumulative effect of the boundary absorption mechanism. As dislocation loops continue to form with increasing dose, some of these dislocations migrate away from the phase boundaries, coalesce, and grow in size, while others migrate toward the phase boundaries and become trapped and absorbed. Over time, this process results not only in a decrease in the total defect content, but also in a position-dependent distribution of defect sizes.
Emergent defects near the phase boundary
While boundary absorption is very prevalent in the early stage of defect accumulation, it is quickly overshadowed by the emergence of a large quantity of dislocations near the phase boundary. It is important to note that these newly emerging BCC defects are not directly generated by the static boundaries. Rather, they are the byproduct of the change of the phase boundary morphology, in which the BCC lattice near the interface has shifted into HCP lattice [Reference Abriata and Bolcich31]. This can be inferred from the PvL scatterplots at 0.3851 dpa [Fig. 7(a)] and 0.6419 dpa [Fig. 7(c)], in which the BCC dislocations (blue circle) not only grow in quantity, but also intrude into previously HCP positions. BCC dislocations emerging during this structural transformation are intrinsically small in size and form disjointed segments instead of complete loops. Due to both the attachment to the interfaces and the change in the Nb–Zr compositions, these new BCC dislocations are also less mobile than those of the Nb bulk phase. As a result, the nucleated boundary dislocation segments tend to form denser clusters instead of coalescing and reorganizing into larger dislocation loops.
Indeed, these emergent dislocations are the cause of the secondary increase in BCC dislocation densities observed across all multilayer ORs. Finally, there are few early signs of larger dislocations latching onto and becoming trapped at the boundaries, as shown in Fig. 7(c). The examination of such second-order interaction between defect mechanisms, however, would need to be expanded upon in a separate study.
As expected, the inclusion of the effects of the morphological evolution of the phase boundary in the metallic multilayers has significantly changed the defect accumulation process. The interactions of multiple dislocation evolution mechanisms affect not only the quantity but also the intrinsic size scale of resultant dislocations. The process of boundary emission does warrant more studies at high doses, as there are some interesting engineering implications.
Discussions
Irradiation-induced phase transformation
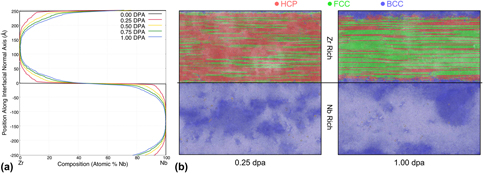
Given the established growth of a finite thickness BCC lattice structure into the HCP lattice and the role it plays in the management of defect concentration in the studied phase boundary systems, we turn our attention to understanding the mechanisms behind such a phase transformation. The two most common explanations are the defect-induced instability and the boundary-induced transformation [Reference Khachaturyan, Shapiro and Semenovskaya32]. Our simulations indicate that the cause of the HCP to BCC transformation is actually related to the irradiation-induced intermixing [Reference Zhang and Demkowicz19, Reference Paine and Averback33, Reference Averback34], a largely dose-dependent process that occurs at phase boundaries. Using the Burgers OR phase boundary as an illustration, we illustrate in Fig. 8 the correlation between the intermixing and phase transformation phenomena.
Intermixing and phase transformation at the Burgers OR phase boundary. (a) Atomic composition versus interfacial normal distance at various damage levels. (b) Atomic structure types at 0.25 dpa and 1.0 dpa, as identified by Common Neighbor Analysis. *Note that with the presence of defects in the system, distorted HCP structures are frequently identified as the similarly closed-packed FCC structure.

In Fig. 8(a), we plot the atomic compositions across the simulation cell at different stages of radiation damage. Starting from a pristine composition at 0 dpa, the original sharp interface becomes more and more diffused with increasing exposure to radiation damage. For the FPA modeling technique used in the present study, direct atom displacements most closely replicate the effects of ballistic mixing. As such, the evolution of the composition profile of Nb across the interface, C Nb(z, t), can be approximated by the functional form [Reference Was35]:
 $${C_{{\rm{Nb}}}}\left( {z,t} \right) = {{{{C'}_{{\rm{Nb}}}}} \over 2}\left[ {1 - {\rm{erf}}\left( {{z \over {\sqrt {4Dt} }}} \right)} \right]\quad ,$$
where z is the distance normal to the interface plane, C′Nb is the initial concentration of niobium in the Nb bulk (i.e., 100%), D is an effective diffusion coefficient, and t is the diffusion time. Additionally, when dealing with predominately ballistic mixing, the factor 4Dt becomes directly proportional to the dose φ (i.e., dpa), as shown by Nastasi et al. [Reference Nastasi, Michael, Mayer, Hirvonen and James36]. Therefore, the composition profile in Eq. (2) can also be expressed in terms of dose:
 $${C_{{\rm{Nb}}}}\left( {z,t} \right) = {{{{C'}_{{\rm{Nb}}}}} \over 2}\left[ {1 - {\rm{erf}}\left( {{z \over {\sqrt {\alpha \phi } }}} \right)} \right]\quad ,$$
where α is the proportionality constant. The functional form in Eq. (3) closely matches the intermixing evolution shown in Fig. 8(a).
As a result of the intermixing, composition changes can sometimes trigger structural transformations in the crystalline lattices. This is especially prevalent near phase boundaries, where intermixing occurs most heavily. For phases with low miscibility, i.e., Cu–Nb [Reference Zhang and Demkowicz19], the intermixing has been shown to form growing layers of amorphous mixtures. Vice versa, for metals with high miscibility, the intermixing instead promotes alloying. In the case of Zr–Nb, the alloying process triggers the transformation from hexagon zirconium into a BCC Zr–Nb alloy phase [Reference Fernandez37]. This transformation process is also visible in Fig. 8(b), in which the BCC sublattice at 1.0 dpa grows far beyond the original location of the dividing interface when the interfacial intermixing has not occurred.
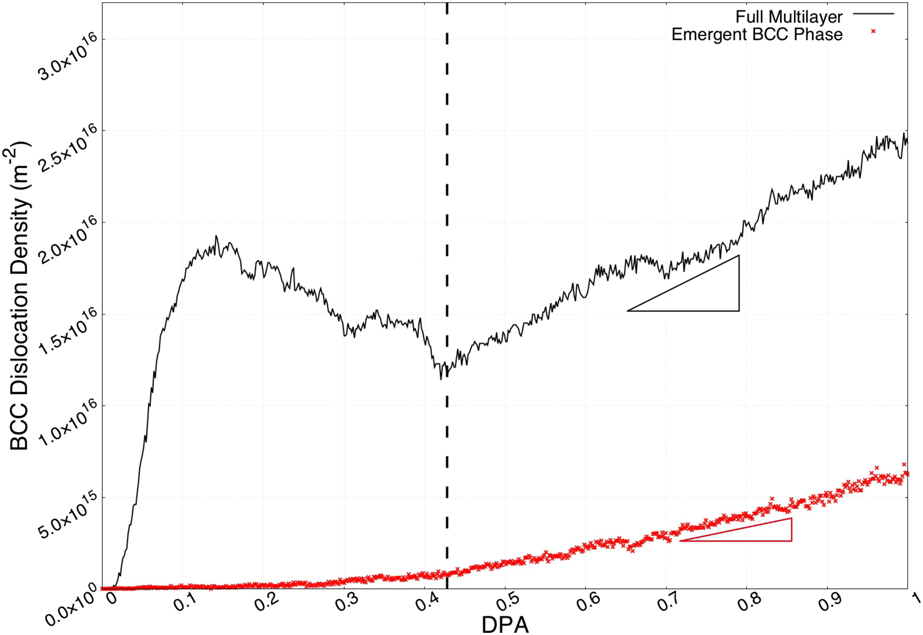
Since phase transformations occur exclusively in initially HCP sublattice, the newly formed (emergent) BCC phase can be easily identified by the position relative to the pristine phase boundaries, as illustrated in Fig. 8. Plotted in Fig. 9 is the dislocation density within this emergent BCC phase, representing the defects generated by the phase transformation process. The total BCC dislocations in the whole simulation volume are shown alongside for reference. The dislocation density in the emergent BCC phase experiences very slow growth in the early stage, which is expected. Phase transformation requires both sufficient concentration and volume of mixing to be triggered. Comparing the two dislocation density evolutions, it is also clear that only a portion of the secondary increase in the total dislocation density is directly generated in the emergent BCC phase. The additional total dislocation density growth is attributed to the secondary interactions caused by the emergent defects, i.e., the increased boundary trapping of dislocations in the Nb-rich bulk.
Dislocation density in the emergent BCC phase at the Burgers OR phase boundary. Emergent BCC phase is identified as volumes initially occupied by HCP structures at 0 dpa. Dislocation density growth rate in the full multilayer is greater than that in the emergent BCC phase.
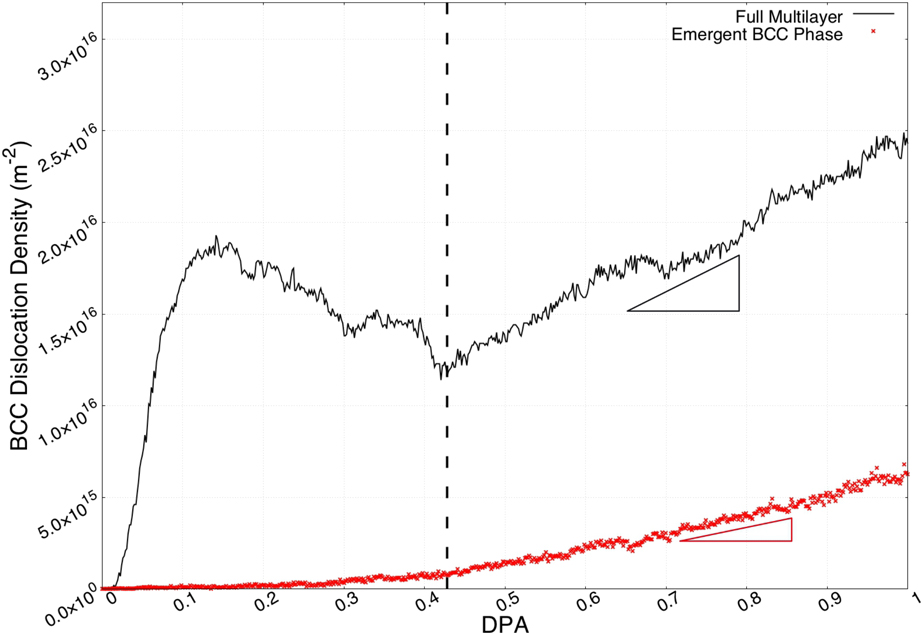
Further examining the composition trigger of the phase transformations, we have tracked both the emergent point of the BCC dislocations and the fading point of the HCP dislocations to ∼20% and ∼ 35% Nb, respectively. Within this composition range, the Zircaloy mixture has been observed to exist in both HCP and BCC phases. The variation in phase transformation rates between the various interface structures (Burgers, P–S, and nanoprecipitates) is attributed primarily to the differences in bulk lattice orientations rather than the interface structures themselves. This is evident in Fig. 5(c), in which the total BCC dislocation density for the nanoprecipitate OR grows significantly slower than those at the Burgers and P–S ORs.
It is important to acknowledge that while the morphology of Zr–Nb multilayers seems to favor phase transformation and emission of small dislocation loops, it cannot be accepted as a general rule. Boundary amorphization between immiscible metals can also be beneficial for defect management and reduce local stress. In either case, our results indicate that the defect–boundary interaction is not a steady-state process that can be examined in its isolated components. It is instead a larger dose-dependent problem that needs to be investigated in its entirety.
Simulation dose rates
To replicate the defect accumulation and evolution process at atomistic timescale, the simulated dose rates are accelerated far beyond what can be replicated experimentally. Consequently, this does result in the omission of some large timescale mechanisms, namely point defect diffusion. It is generally understood that defect diffusion is the mechanism by which defects interact with grain boundaries. Due to the presence of long range elastic fields, mobile defects slowly diffuse toward to boundary defect sinks [Reference Balluffi38, Reference Han, Demkowicz, Fu, Wang and Misra39] and eventually get absorbed [Reference Misra, Demkowicz, Zhang and Hoagland40]. The inability for the atomistic timescale to contain the diffusion process does restrict the defect boundary interaction at low dose/damage levels. Fortunately, small defects quickly cluster, grow in size, and become immobile upon further irradiation, reducing the concern of diffusion over time. As a result, the dose and interfacial effects on defect evolution should remain largely unaffected by the dose rate, except the very early stages of point defect accumulation.
Conclusion
In this study, we have simulated the accumulation of irradiation defects in various orientation configurations of Zr–Nb multilayers. By using a novel technique based on the cumulative introduction of Frenkel pairs, we accelerated the simulations of irradiation processes faster than tradition collision cascade to study dose effects on defect evolutions near phase boundaries.
The process of the defect accumulation in bulk phases has been separated into three evolutionary stages: (i) accumulation, (ii) saturation, and (iii) coalescence. Each stage is associated with an intrinsic defect size and correlated with dislocation populations.
Expanding the study into multilayer heterophase boundaries, we also identified two additional defect accumulation mechanisms at these interfacial systems: We observed a boundary absorption mechanism early on, significantly restricting the accumulation of dislocations near the boundaries. As dose/damage builds up, the initial absorption is instead overtaken by the emission of a large quantity of immobile small size scale dislocations. Our simulations enabled us to identify the emergent defects near the boundaries as byproducts of the phase transformations caused by irradiation-induced intermixing. Interestingly, at any relevant damage level, the initial interfacial microstructures seem to have little influence on defect accumulation.
Methods
In this study, we used the atomistic simulation code LAMMPS (Large-scale Atomic/Molecular Massively Parallel Simulator [Reference Plimpton41]) to study the radiation resistance of Zr–Nb heterophase boundaries. We selected and employed the Angular Dependent Potential (ADP) developed by Smirnova and Starikov [Reference Smirnova and Starikov42] to model the interatomic interactions in Zr–Nb metallic multilayers. This potential, fitted to ab initio results, is able to accurately replicate point defect formation and diffusion in multiple phases of Zr, BCC Nb, as well as the mixed alloys. Since we were not using the Primary Knock on Atom (PKA) technique to generate radiation-induced damage, no modification (nuclear or electronic stopping) was added to this interatomic potential [Reference Sand, Dequeker, Becquart, Domain and Nordlund43]. We performed the identification and quantification of the irradiation defects using the Dislocation Extraction Algorithm (DXA) [Reference Stukowski, Bulatov and Arsenlis44] as implemented in the OVITO software package [Reference Stukowski45]. Our simulation technique is composed of two steps: (i) the construction of the three stacking orientations for Zr–Nb heterophase boundaries and (ii) the accelerated introduction and evolution of irradiation defects in the vicinity of these boundaries.
Zr–Nb multilayer construction
The atomistic construction of Zr–Nb heterophase (incoherent) boundaries consists of two stacking bulk crystals with periodic boundary conditions applied in all directions. Periodicity in the stacking normal direction transforms the two bulk crystals into alternating multilayers. To achieve the correct stacking ORs, both bulk crystals are rotated with respect to one another. As lattice periodicities in the simulation frame shift upon rotation, atom numbers are slightly adjusted to eliminate any noninterfacial mis-stacking defects.
For the Burgers and P–S ORs considered in this study, we constructed our simulation cells to be approximately 250 × 500 × 500 Å, with each bulk layer taken as approximately 250 Å in thickness. In the case of the Burgers OR multilayer, our simulation contains 1,347,840 Zr atoms and 1,767,744 Nb atoms, respectively; in the case of the P–S OR multilayer, our simulation contains 1,347,840 Zr atoms and 1,756,512 Nb atoms, respectively; and in the case of the nanoprecipitate OR multilayer, our simulation contains 1,347,840 Zr atoms and 1,772,928 Nb atoms, respectively.
To allow for the relaxation of misfit stacking strains and the formation of interfacial microstructures, we performed an energy minimization step with isobaric (P = 0) constraint to the three individual constructed multilayers. Figure 2 illustrates the relaxed atomic structures near the three phase boundaries. Periodic clustering of atoms at the boundary layers clearly indicates the existence of various interfacial dislocation networks, as reported elsewhere [Reference Chen, Dingreville and Deo12, Reference Chen, Shao, Liu, Yadav, Li, Mara and Wang14].
FPA
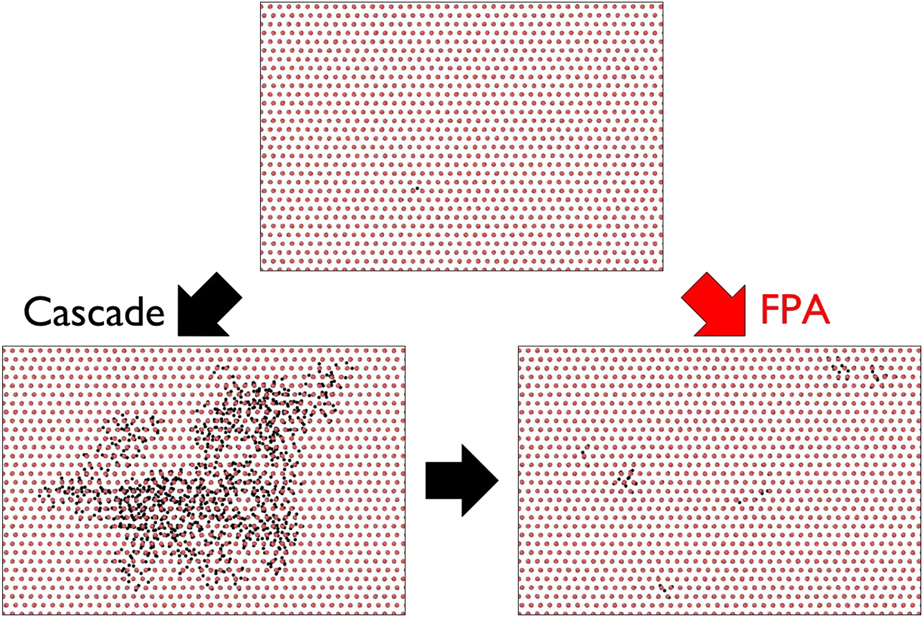
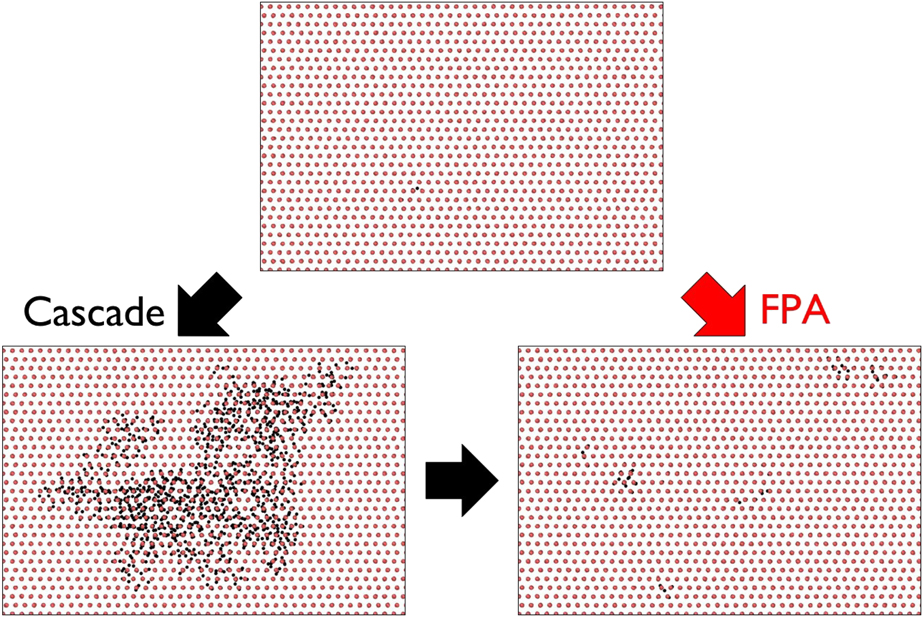
To simulate the evolution of irradiation defects over a significant dose range, we adopted the FPA method [Reference Chartier, Onofri, Van Brutzel, Sabathier, Dorosh and Jagielski24, Reference Crocombette, Chartier and Weber46, Reference Balboa, Van Brutzel, Chartier and Le Bouar47]. The schematic for the FPA method is shown in Fig. 10. The FPA method introduces radiation damage directly as interstitial vacancy point defect (Frenkel) pairs as observed at the end of the collision event, bypassing the various stages of cascade evolution. Each Frenkel pair is generated within the simulation cell by randomly selecting and displacing an atom from its initial lattice site. In turn, the initial atom site becomes a vacancy site, and the displaced atom becomes an interstitial site, thus creating a Frenkel pair. Since the original method presented by Chartier et al. [Reference Chartier, Onofri, Van Brutzel, Sabathier, Dorosh and Jagielski24] was developed for ceramic systems with large sparse lattices, we included an additional optimization step for the denser metallic system, i.e., Zr–Nb. In this additional step, at each interstitial defect site, the nearest neighbors of the displaced atom are nudged radially up to 2 Å away from the center of the interstitial site. This nudging adjustment is intended to perform three primary functions: (i) preventing atom position overlap, (ii) reducing local heating from close-range repulsion, and (iii) allowing more defect pairs to be introduced simultaneously.
Schematics of Frenkel pair accumulation [Reference Chartier, Onofri, Van Brutzel, Sabathier, Dorosh and Jagielski24] (FPA) method.
To better match the radiation-induced damage introduced using the FPA method to that of a collision cascade, we have parameterized the maximum allowed displacement distance using the Stopping and Range of Ions in Matter (SRIM) software [Reference Ziegler, Ziegler and Biersack48]. Using SRIM, we calculated the first collision range in both Zr and Nb target mediums for a maximum incident energy of 20 keV. We simulated same-specie collisions to approximate collision cascades initiated well within the respective bulk. In addition, we also simulated cross-species collisions to approximate collision cascades initiated in the vicinity of the heterophase boundaries. SRIM calculations yielded the first collision range of Zr → Zr, Nb → Nb, Zr → Nb, and Nb → Zr to be 104 Å, 77 Å, 78 Å, and 103 Å, respectively. Taking the approximate average of the four test cases, the upper bound on atom displacement range is set to 90 Å. To reduce the possibility of spontaneous recombination and elimination of the new Frenkel pairs, the lower bound of the atom displacement is set to the value of 20 Å. The large separation of vacancy and interstitial defects is also a characteristic feature of high-energy irradiation, in which the interstitial defects cluster at the outer edge and the vacancy defects cluster at the inner core of the collision cascade [Reference Nordlund, Zinkle, Sand, Granberg, Averback, Stoller, Suzudo, Malerba, Banhart, Weber, Willaime, Dudarev and Simeone49].
At each time interval, we introduced n fp = 5000 randomly generated Frenkel pairs. To offset the localized heating at the new interstitial sites and allow for defect evolutions, we subsequently relax our interfacial atomic system for 2 ps using an isobaric NPT ensemble. This process is repeated until the total dose/damage reaches the damage level of 1 dpa (displacement-per-atom), where  ${\rm{dpa}} = {{{n_{{\rm{fp}}}}} \over {{N_{{\rm{atoms}}}}}}$, with N atoms being the total number of atoms in the entire atomic system considered. Effective dose/damage rates in bulk Zr, bulk Nb, and larger multilayer systems are approximately 0.00371 dpa/ps, 0.00285 dpa/ps, and 0.00080 dpa/ps, respectively.
Acknowledgments
This work was performed in part at the Center for Integrated Nanotechnologies, an Office of Science user facility operated for the U.S. Department of Energy. This work was also supported by the Laboratory Directed Research and Development program at Sandia National Laboratories. Sandia National Laboratories is a multi-mission laboratory managed and operated by National Technology and Engineering Solutions of Sandia, LLC., a wholly owned subsidiary of Honeywell International, Inc., for the U.S. Department of Energy National Nuclear Security Administration under contract DE-NA0003525. The views expressed in the article do not necessarily represent the views of the U.S. Department of Energy or the U.S. Government. C.D. was supported by a DOE-NEUP subcontract, the Woodruff Faculty Fellowship at Georgia Institute of Technology and Sandia Academic Alliance program.