I. INTRODUCTION
Phosphor conversion light-emitting diodes (LEDs) emit white light by converting the primary blue light from a single LED chip by additive color mixing of the emitted yellow light, designated nowadays as solid state lighting. The first LED was developed in 1961 with low efficiency,Reference Holonyak and Bevacqua1 whereas the highly efficient GaN-based blue LED was invented in 1994,Reference Nakamura, Fasol and Pearton2 followed by the first single chip white LED in 1996.Reference Schlotter, Schmidt and Schneider3 Today's standard white LEDs are based on a blue-emitting AlGaInN LED chip pumping a typically yellow-emitting phosphor. White light is then generated by additive color mixing of the phosphor emission with the partly transmitted blue light from the LED. The most common yellow phosphor is the yttrium–aluminum garnet (Y3Al5O12, YAG) with a cerium doping.Reference Nishiura, Tanabe, Fujioka, Fujimoto and Nakatsuka4 Dispensed in a resin, polymer, or silicone, this phosphor is coated on or stacked above the blue chip. The use of an organic matrix for the converter is a major drawback of the phosphor coating, because in case of high-power LEDs, with increased heat generation, this matrix is aging and therefore the durability of the whole LED is decreased. To solve the problem of thermal degradation, an entirely inorganic converter with a high thermal conductivity is in the focus of research and development. One approach to prepare such a converter is to sinter a polycrystalline ceramic based on YAG phosphor powder.Reference Bechtel, Schmidt, Tücks, Heidemann, Chamberlin, Mueller-Mach, Mueller and Shchekin5
Polycrystalline YAG ceramics for optical application were described first by Ikesue et al.Reference Ikesue, Furusato and Kamata6 in the middle of the 1990s by mixing Al2O3 and Y2O3 powders using vacuum sintering. These first ceramics were clearly transparent with about 80% transmittance for visible light without any dopant. In the following years, the YAG was doped with neodymium and the resulting ceramics were used as laser material with properties comparable to YAG:Nd single crystals.Reference Ikesue and Aung7 Nowadays, instead of phosphor-in-silicone composites, polycrystalline YAG:Ce ceramics, with different levels of transparency, mounted on top of a blue-emitting LED are described for high-power white LEDs (also known as “remote phosphor”).Reference Krames, Shchekin, Mueller-Mach, Mueller, Zhou, Harbers and Craford8 Compared to the phosphor-in-silicone composites the ceramic phosphors have a lower concentration of the expensive cerium dopant, and in addition exhibit excellent optical and thermal stability. The optical properties and the content of scattering centers can be engineered by varying the degree of porosity, the grain structure, and the minority phases.Reference Raukas, Kelso, Zheng, Bergenek, Eisert, Linkov and Jermann9 But the main advantage compared to silicone-based converters is the high thermal conductivity of the ceramic (>5 W/mK) that allows an efficient dissipation of the heat caused by the Stokes losses within the phosphor, thus diminishing the thermal effects on the optical performance. Most recently, the optical properties of transparent, polycrystalline YAG:Ce ceramics were discussed in the literature and Raukas et al.Reference Raukas, Kelso, Zheng, Bergenek, Eisert, Linkov and Jermann9 described that the intrinsic scattering by pores induces backscattering, thus leading to absorption within the converter or the LED chip, which should be reduced to achieve a maximum optical conversion efficiency (CE). On the other hand, scattering is required for a homogeneous mixing of transmitted blue and converted yellow light and can be achieved by extrinsic scattering at a rough or structured surface. In combination with a blue (460 nm) LED and under the requirement that 35% blue is transmitted to create white light with ∼5000 K color temperature, the calculated theoretical maximum optical down-CE is 283 lm/Wopt (refer to the blue light, not to the whole LED).Reference Krames, Shchekin, Mueller-Mach, Mueller, Zhou, Harbers and Craford8 The result published in the literature for the luminous efficacy of a 0.63 mm thick YAG:Ce ceramic disk with 0.1 mol% Ce doping was 73.5 lm/W for the complete LED.Reference Nishiura, Tanabe, Fujioka and Fujimoto10 The transmittance of this ceramic was about 70% in the visible range with a 10% transmittance in the blue absorption band at a wavelength of 460 nm and a grain size of about 10 µm with residual pores on the grain boundaries.
The data published so far in the literature report on whether the thickness of the specimen or the concentration is a crucial factor, but the data are mostly not clearly comparable and seem to depend on the individual properties, such as increased optical path length due to pore scattering, of the specimen. To study the influence of dopant concentration and sample thickness, our ceramics have been applied as converters in conjunction with a blue LED and the effects of concentration as well as the thickness of the polycrystalline disks on the optical properties of the resulting PC LEDs have been investigated.
II. EXPERIMENTAL
A. Processing of ceramic
The yttrium–aluminum garnet (Y3Al5O12, YAG) polycrystalline disks were prepared by reaction sintering of yttria (99.99%), alumina (99.999%), and cerium oxide (99.995%) in a ratio of Y:Al of 3:5 and with an addition of a different concentration of cerium oxide of 0.1, 0.5, or 1 mol% as well as a sintering aid (tetraethyl orthosilicate) under vacuum at a temperature of 1800 °C for 5 h in a furnace with molybdenum lining. The powder mixtures were pressed uniaxially at about 50 MPa and cold isostatically at about 700 MPa to form cylindrical disks. The resulting polycrystalline bulk disks were grinded and polished to different thicknesses of 0.5 and 0.8 mm.
B. LED demonstrator setup with blue-emitting chip and ceramic phosphor
To investigate the optical properties of the ceramic, remote conversion LEDs were prepared. For this purpose a blue thin-film power LED in a surface mount device package (Osram Golden Dragon LD W5SM, Osram Opto Semiconductors, Regensburg, Germany) with a dominant wavelength of 455 nm and an optical output power of 0.88 W at a drive current of 1 A and a voltage of 3.6 V was soldered on a metal core board. A Polytetrafluorethene (PTFE) spacer ring was used to attach the ceramic plate above the LED in proximity to its silicone encapsulation. The resulting thin air gap was filled with optical silicone gel with a refraction index of 1.48 at 460 nm.
C. Characterization
The phase composition of the resulting disks was analyzed using a powder x-ray diffractometer by Bruker (D8 Advance and with TOPAS software11, Bruker AXS GmbH, Karlsruhe, Germany). The bulk density of the sintered disks was determined by Archimedes method. Scanning electron micrographs were taken with a field-effect-assisted Gemini DSM 982 from Zeiss equipped with an ISIS EDX spectrometer from Oxford Instruments (Abingdon, UK) with a Si(Li) detector. The total forward transmittance (TFT) (with a wavelength in the range 250–800 nm) of the polished samples was measured with a Cary 4000 spectrometer (Varian Medical Systems, Inc., Palo Alto, CA) with an aperture angle of 5° and an integrating sphere to measure the complete transmitted light including the portion of the forward-scattered light. The fluorescence data were obtained in air using an FS920 from Edinburgh Instruments spectrometer with a xenon arc lamp as the light source. The emission spectra in a wavelength range of 470–700 nm were measured at an excitation wavelength of 460 nm while the excitation spectra between 280 and 500 nm were measured at an emission wavelength of 530 nm. The electroluminescence emission of the ceramic phosphor converted LEDs was analyzed by spectral photometry using a 250 mm integrating sphere with 2π detection geometry attached to a thermoelectric cooled calibrated array spectrometer (CAS140CT with ISP250 from Instrument Systems). The LEDs were mounted with their metal core board onto a thermoelectric cooler (Arroyo 264) stabilized to a temperature of 25 °C and operated in DC mode at a stabilized drive current of 1 A and a voltage of 3.6 V.
III. RESULTS AND DISCUSSION
A. Phase analysis and optical properties of ceramic
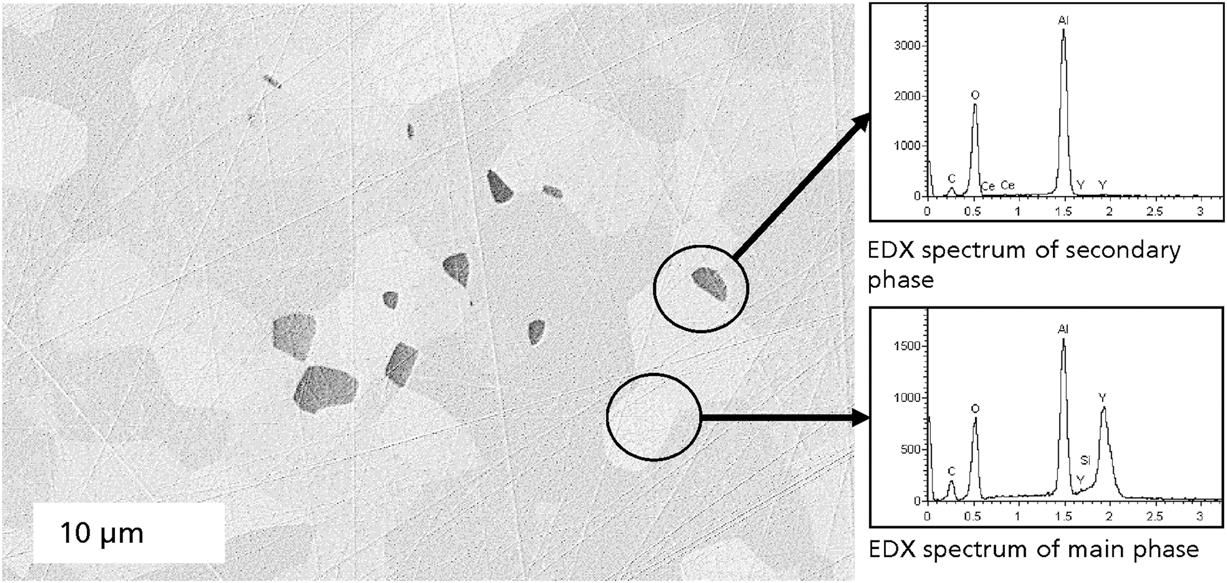
The cubic garnet Y3Al5O12 (YAG) was prepared by the reaction sintering of Y2O3 and Al2O3 with a ratio of Y to Al of 3:5 with 1 mol% cerium doping to a polycrystalline translucent ceramic (Fig. 1). The bulk density of the disks was comparable in the range between 4.55 and 4.56 g/cm³, showing that the optical properties were not influenced by different grade of densification. Although no secondary phase was found by x-ray diffraction (XRD), the field emission scanning electron microscopy (FESEM) picture of the mechanically polished disk reveals a polycrystalline microstructure in the cross-section of the ceramic disk with two different phases (Fig. 2). The microstructure is dominated by a main phase with a grain size of less than 10 µm and is interrupted by grains of a secondary phase with a grain size smaller than 3 µm. The grain size of this microstructure is comparable to the data reported of the transparent sample by Nishiura et al.Reference Nishiura, Tanabe, Fujioka and Fujimoto10 using similar sintering conditions. Nishiura et al.Reference Nishiura, Tanabe, Fujioka and Fujimoto10 described a microstructure of single-phased YAG with intra- and intergranular, small pores in contrast to our fully densified ceramic with secondary phase. The EDX analysis gave an indication of the composition and shows for the main phase three strong peaks associated with the elements Al, Y, and O (Fig. 1), while in the secondary phase only Al and O could be detected, indicating alumina to be the secondary phase. Although the reason for the crystallization of the secondary phase is not known, the evaporation of yttria during the sintering process under vacuum at the high temperature of 1800 °C resulting in a stoichiometric shift of the composition was conceivable.
XRD pattern of YAG:Ce ceramic with 1 mol% cerium doping.

FESEM picture and EDX spectra of mechanically polished YAG:Ce ceramic.
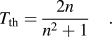
The difference in refractive indices of these two phases in the polycrystalline microstructure causes light scattering during transmission at the grain boundaries. This results in “translucency” rather than “transparency” of the ceramic, which can be observed visibly by the blurring occurring at a larger distance between the background and the sample, whereas the specimen seems to be purely transparent at the proximity of the disk and the background image (Fig. 3). The translucency caused by forward scattering is an effect intended for YAG:Ce ceramics to be used for luminescence conversion, since a better mixing of the transmitted blue and converted yellow light is achieved. For the characterization of the transparency, the integrated transmitted light (= TFT) through the sample was measured and compared to the theoretical transmittance of the material. The theoretical transmittance can be calculated by knowing the refractive index n of the materialReference Krell, Hutzler and Klimke12:
 $${T_{{\rm{th}}}} = {{2n} \over {{n^2} + 1}}\quad .$$
Photograph of translucent YAG:Ce ceramics with 0.5 mm thickness and different content of Ce doping; (a) lying and (b) standing on the background.
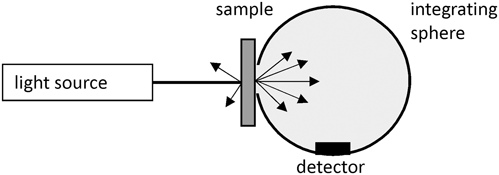
In case of YAG:Ce, the refractive index is 1.84 (Ref. Reference Krames, Shchekin, Mueller-Mach, Mueller, Zhou, Harbers and Craford8) and, therefore, the theoretical transmittance can be calculated as 83.9%. Here, the TFT including the inline transmittance and the forward-scattered light was measured with an integrating sphere in 2π forward detection geometry (Fig. 4). This setup allows characterizing the whole transmitted light, but gives no information on whether the residual light is backscattered or absorbed by the material itself. The TFTs of the differently – 0.1, 0.5, and 1 mol% – doped samples with 0.5 mm thickness ranges from 75 to 78% (Fig. 5). The residual light is most likely backscattered because of the high content of scattering secondary phase and less likely absorbed by defect centers such as oxygen vacancies originating from the vacuum atmosphere during the sintering process. Additionally, the absorption bands of the YAG activated with cerium at 330 and 460 nm wavelengths can be observed in the TFT spectra (Figs. 5 and 6). The intensity of these bands grows with increasing specimen thicknesses and Ce-doping levels. The sample with a 0.5 mm thickness and 0.1 mol% doping transmits 44% of blue light at a wavelength of 460 nm, while the specimen with an equal thickness but 0.5 mol% doping transmits 22% of the blue light. When the phosphor is excited at a wavelength of 460 nm within the dominating absorption band a greenish yellow light with the maximum intensity at 530 nm is emitted (Fig. 7).
Measurement setup for TFT.
TFT of YAG:Ce ceramics with 0.5 mm thickness and 0.1, 0.5, and 1 mol% cerium doping.
TFT of YAG:Ce ceramics with 0.5 and 0.8 mm thickness (d) for 0.1 and 0.5 mol% cerium doping.
Emission and excitation spectra of YAG:Ce ceramic with 0.1 and 1 mol%.
B. Characterization of the ceramic conversion LEDs
The application of ceramics in a converted LED setup is visualized in Fig. 8 and shows a 0.1 mol% ceramic under blue light excitation [Figs. 8(a) and 8(c)]. In Fig. 8(b) the arrangement of the blue LED (λ = 455 nm, P opt = 0.88 W) and the ceramic disk attached to a PTFE spacer ring in the same size of the ceramic is displayed [Fig. 8(b)]. A far-field pattern of the LED [Fig. 8(c)] with 0.1 mol% shows a bluish forward emission with a yellow ring at 90° from the axis. This is an indication of a strong wave guiding due to the total reflection of the yellow light within the ceramic disk caused by the high transparency of the ceramic. In Fig. 9 the spectral light output power for a fixed thickness of 0.5 mm and variation of the Ce concentration of 0.1, 0.5, and 1 mol% is shown. In Fig. 10 the thickness of the ceramic disks were varied with a fixed Ce concentration of 0.5%.
Photographs of (a) YAG:Ce ceramic with 0.7 mm thickness and 0.1 mol% cerium doping under 458 nm laser excitation, (b) arrangement of the blue LED and the YAG:Ce ceramic applied on a PTFE spacer, and (c) far-field emission characteristics of the conversion LED shown in figure (b).
Light output power distribution of YAG:Ce ceramic with 0.5 mm thickness and 0.1, 0.5, and 1 mol% cerium doping excited with a blue LED (λ = 456 nm, P opt = 0.88 W).
Light output power distribution of YAG:Ce ceramic with 0.5 and 0.8 mm thickness and 0.5 mol% cerium doping excited with a blue LED (λ = 456 nm, P opt = 0.88 W).
The spectral distribution of the emitted LED light with the applied ceramic converter is in line with the transmittance data. This means that the content of the transmitted blue light (blue leakage) is higher with a lower concentration of doping and smaller ceramic thickness. In the same way, the content of the converted yellow light decreases with reduced Ce activator concentration and ceramic thickness. Figure 9 also indicates that upon further increase of the Ce concentration from 0.5 to 1% the blue absorption increases, while the yellow band actually decreases again. This is an indication of concentration quenching at such high Ce concentration levels. The chromaticity color coordinates (CIE1931, 2°) of the measured YAG:Ce ceramic LEDs fall onto a line spanned between the greenish yellow of the YAG:Ce converter itself and the color of the pure blue pumped LED (Fig. 11, Table I). The intended color point for a white LED (x = y = 1/3) is close to the blackbody curve at a color temperature of ∼5000 K. In our case the blue leakage of the ceramics with 0.1 mol% is too high because of the low content of the converted yellow light. Increasing the Ce concentration to 0.5 mol% increases the yellow part of the emitted light and the chromaticity color coordinates move toward pure yellow light (λ = 560 nm). This means the content of the transmitted blue light with 17.4 and 22.3% for 0.8 and 0.5 mm thick samples is too low. Therefore, either the thickness at a fixed Ce dopant concentration has to be reduced or the Ce concentration with fixed thickness should be decreased to achieve pure white light. For pure white light, the optimized YAG:Ce ceramics should be doped approximately with 0.3 mol% cerium with a thickness of 0.5 mm.
Chromaticity color coordinates (CIE1931 2°) of YAG:Ce ceramics with 0.1, 0.5, and 1 mol% cerium doping with 0.5 and/or 0.8 mm sample thickness.
Optical data of YAG:Ce ceramics arranged on a blue LED (λ = 456 nm, P = 3 W) depending on the content of cerium and thickness of specimen (*determined at λ = 460 nm of TFT).
In Fig. 12 the dependence of the integrated luminous flux and the luminous efficacy on the ceramic thickness and the Ce concentration is shown. The point at zero ceramic thickness is the value from the pure pumped LED. Upon increasing the ceramic thickness, the luminous flux increases since more blue light is converted into yellow light, to which the human eye is more sensitive. At a low Ce concentration of 0.1 mol% the luminous flux is limited due to the remaining high blue light content. With an increase of the Ce concentration to 0.5 mol% the luminous flux increases considerably. The highest luminous flux of 276 lm at a luminous efficiency of 76.6 lm/W was reached by the LED with the 0.5 mol% doped ceramics and a thickness of 0.8 mm, yielding in a conversion to yellowish white light (x = 0.401, y = 0.519) with high efficiency for this particular LED. For reference purposes a commercially available white reference LED with similar pumped chip and same package, but with a traditional silicone-matrix converter, is plotted in Fig. 12. For this reference LED a luminous flux of 270 lm at an efficiency of 75 lm/W is measured with color coordinates close to the white point (x = y = 1/3). Upon further increase of the Ce concentration to 1 mol% the luminous flux as well as the luminous efficacy is strongly reduced again due to concentration quenching.
Luminous flux (lm) and luminous efficacy (lm/W) of blue LED pumped YAG:Ce ceramics with 0.1, 0.5, and 1 mol% cerium doping depending on the sample thickness of 0.5 and 0.8 mm.
IV. SUMMARY
Translucent, polycrystalline YAG:Ce ceramics with 0.1, 0.5, and 1 mol% cerium were prepared by vacuum sintering at a temperature of 1800 °C. Remote phosphor conversion LEDs were developed based upon a high power blue LED pumped chip (λ = 455 nm, P opt = 0.88 W, I LED = 1 A) and the ceramic disk to characterize the chromaticity color coordinates and the luminous efficiency.
The microstructure of the completely densified ceramics was dominated by the main phase of Y3Al5O12 with less than 10 µm grain size. The scattering effect of the translucent ceramic was the result of a secondary phase of alumina located at the grain boundaries. Upon increasing cerium concentration from 0.1 to 0.5 to 1% and sample thickness, the intensity of the transmitted blue light (blue leakage) decreased. Accordingly the LED chromaticity color coordinates were strongly changed depending on the activator content and the thickness of the converter. A yellowish white light was achieved with 0.5 mol% Ce concentration and a ceramic disk thickness of 0.5 mm. By decreasing the thickness or the dopant content it is possible to prepare white LEDs with a color temperature of ∼5000 K. The highest luminous flux of 276 lm at an efficiency of 76.6 lm/W was achieved with the 0.5 mol% doped and 0.8 mm thick YAG:Ce ceramic with a yellowish white-emitting light.
ACKNOWLEDGMENTS
The authors would like to thank S. Liu for the spectral photometry measurements, R. Schmidt for technical assistance in LED preparation and Th. Passow and J. Wagner for helpful comments and discussions. This work was supported by Fraunhofer internal program Attract (Grant No. 692077).