The Five Factor Model, including dimensions of Extraversion, Agreeableness, Conscientiousness, Neuroticism, and Openness to Experience (John and Srivastava, Reference John, Srivastava, Pervin and John1999), has been widely accepted as a description of normative personality. These normative personality traits (NPTs), typically assessed by self-report questionnaires, are moderately heritable in twin studies (McGue, Reference McGue, Rimoin, Pyeritz and Korf2002; Livesley and Jang, Reference Livesley and Jang2008; South et al., Reference South, Reichborn-Kjennerud, Eaton, Krueger, Mikulincer, Shaver, Cooper and Larsen2015). Assessments for maladaptive/abnormal personality traits (APTs), based on the same Five Factor Model, have been developed (Clark, Reference Clark1993; Clark et al., Reference Clark, Vorhies, McEwen, Costa and Widiger1994; Livesley and Jackson, Reference Livesley and Jackson2009; Krueger et al., Reference Krueger, Derringer, Markon, Watson and Skodol2012), studied in twin populations, and also found to be heritable (Livesley et al., Reference Livesley, Jang, Jackson and Vernon1993; Jang et al., Reference Jang, Livesley, Vernon and Jackson1996; South et al., Reference South, Krueger, Knudsen, Ystrom, Czajkowski, Aggen, Neale, Gillespie, Kendler and Reichborn-Kjennerud2016). The DSM criteria for personality disorders (PDs) as first proposed in DSM-III (American Psychiatric Association, 1980), modestly modified in DSM-III-R (American Psychiatric Association, 1987) and DSM-IV (American Psychiatric Association, 2000), and now included in DSM-5 (American Psychiatric Association, 2013), have also been examined in twin samples – most often as ‘criteria counts’ – and shown to be heritable (Livesley et al., Reference Livesley, Jang, Jackson and Vernon1993; Torgersen et al., Reference Torgersen, Lygren, Oien, Skre, Onstad, Edvardsen, Tambs and Kringlen2000; Jang and Vernon, Reference Jang, Vernon and Livesley2001; Kendler et al., Reference Kendler, Aggen, Czajkowski, Roysamb, Tambs, Torgersen, Neale and Reichborn-Kjennerud2008; Livesley and Jang, Reference Livesley and Jang2008; Reichborn-Kjennerud, Reference Reichborn-Kjennerud2008).
What is the nature of the etiologic relationship between NPTs, APTs, and PDs? Some studies suggest that DSM PDs, while not equivalent to NPYs, are nonetheless well represented by the Five Factor Model (Costa and Widiger, Reference Costa and Widiger2002; Saulsman and Page, Reference Saulsman and Page2004; Samuel and Widiger, Reference Samuel and Widiger2008) suggesting that the traits of normal and abnormal personality exist on a single normally distributed continuum with NPTs, APTs, and PDs located at increasingly extreme locations (Livesley, Reference Livesley2007). Others contend that a four-factor structure is more appropriate as openness has little relationship with the DSM PDs (Dyce and O'Connor, Reference Dyce and O'Connor1998; Livesley et al., Reference Livesley, Jang and Vernon1998; Austin and Deary, Reference Austin and Deary2000; Markon et al., Reference Markon, Krueger and Watson2005).
Since the seminal publication by Robins and Guze (Reference Robins and Guze1970), familial/genetic factors have played a central role in the evaluation of psychiatric diagnostic classifications. A few studies have investigated common genetic influences on normal and abnormal personality with variable results (Jang and Livesley, Reference Jang and Livesley1999; Wright et al., Reference Wright, Pahlen and Krueger2017).
In Norwegian population-based twins, we obtained measures of NPTs, APTs, and PDs. Three prior publications from our group on this sample have focused on the relationship between two of these three dimensions: NPTs and APTs (Kendler et al., Reference Kendler, Aggen, Gillespie, Neale, Knudsen, Krueger, Czajkowski, Ystrom and Reichborn-Kjennerud2017), APTs and PDs (Reichborn-Kjennerud et al., Reference Reichborn-Kjennerud, Krueger, Ystrom, Torvik, Rosenstrom, Aggen, South, Neale, Knudsen, Kendler and Czajkowski2017), and NPTs and PDs (Czajkowski et al., Reference Czajkowski, Aggen, Krueger, Kendler, Neale, Knudsen, Gillespie, Røysamb, Tambs and Reichborn-Kjennerud2018). In this report, for the first time, we conduct a computationally demanding multivariate twin analysis of all three of these personality domains with the specific goal of determining the degree of cross-domain coherence in their genetic and environmental determinants.
We seek to evaluate two hypotheses. A high congruence model predicts four or five genetic and environmental factors each anchored by one of the big-five dimensions of normal personality and reflected in parallel measures of APTs and PDs. Such results would reflect a close relationship between the genetic and environmental influences on NPTs, APTs, and PDs. A low congruence model, by contrast, predicts factors that largely index these three distinct domains of personality and which would therefore reflect limited etiologic continuity between NPTs, APTs, and PDs.
Methods
Our sample came from the Norwegian Institute of Public Health (NIPH) Twin Panel (Harris et al., Reference Harris, Magnus and Tambs2006). Twins born 1967–1979 (N = 15 370) were identified through the Norwegian National Medical Birth Registry. Repeated contact with them began in 1992. Data used here came from an interview (1999–2004, wave 1) that assessed DSM-IV Axis I and Axis II disorders, and a self-report follow-up questionnaire (2010–2011, wave 2) including items assessing normative and maladaptive personality. Of the 3221 twin pairs eligible for wave 1, 1391 complete pairs (43.2%) and 19 single twins (0.6% pairwise) participated (63% female; mean age = 28.2 years, range = 19–36). Of the 2801 twins eligible for wave 2, 2393 twins (86.8%, 1063 twin pairs and 267 single twins) participated (64% female, mean age = 37.8 years, range = 30–44). Wave 1 interviews were administered by advanced psychology students or psychiatric nurses who received standardized training and supervision. Written informed consent was obtained from all participants. Ethical approval was granted by The Norwegian Data Inspectorate and the Regional Ethical Committee.
Measures
In the wave 2 self-report twin questionnaire, normative personality domains were assessed by the 44-item Big Five Inventory (BFI) (John et al., Reference John, Donahue and Kentle1991). A single common factor model was fitted to the five-point Likert-type item response option sets to test the unidimensionality of each BFI constructs. Based on satisfactory single-factor model fits, item aggregate sum score variables were constructed for each BFI construct. Six maladaptive personality domain constructs (Negative Emotion, Detachment, Antagonism, Disinhibition, Psychoticism, and Compulsivity) were assessed using a shortened 36-item version of the PID-5: the PID-5-Norwegian Brief Form (PID-5-NBF) (Krueger et al., Reference Krueger, Derringer, Markon, Watson and Skodol2012). These items used a four-point Likert-type response format. Item integer scores were reverse coded and anchored at zero so that higher values indicated greater levels of maladaptive behavior. Similar psychometric modeling was conducted to verify the unidimensionality of each of the PID-5-NBF constructs. The resulting sum score aggregate variables were often highly positively skewed. Log transformations were applied to each sum score incremented by one prior to twin modeling.
All criteria for lifetime DSM-IV Axis II PDs were assessed using a Norwegian version of the Structured Interview for DSM-IV Personality (SIDP-IV) at wave 1 (Pfohl et al., Reference Pfohl, Blum and Zimmerman1995). As detailed previously, inter-rater reliability of these assessments was high with a mean intra-class correlation of the endorsed criteria across the PDs equal to +0.89 (Kendler et al., Reference Kendler, Aggen, Czajkowski, Roysamb, Tambs, Torgersen, Neale and Reichborn-Kjennerud2008).
Six of these 10 core PDs were also reassessed at a wave 2 interview 10 years later. The SIDP-IV used non-pejorative questions organized into topical sections rather than by individual PDs to facilitate the flow of the interview. The SIDP-IV interview was conducted after the Composite International Diagnostic Interview (CIDI) to aid interviewers in distinguishing between persistent long-term patterns of behavior and temporary states due to existing Axis I disorders. A 5-year rule was used to ensure the persistence of each of the PD criteria as representing the expression of a more trait-like personality pathology. Each symptom criterion was scored on an ordered four-point scale (0 = absent, 1 = sub-threshold, 2 = present, and 3 = strongly present). Due to the low prevalence of full PD diagnoses, a dimensional approach was adopted scaling PD liability using a count of the positively endorsed criterion and a model for ordered thresholds. First, each PD criterion was dichotomized based on a sub-threshold cut-off (0 = absent v. 1 = sub-threshold or greater). These binary criteria were then summed for each respective PD to form aggregate variables. Due to strong positive skewness of these sum scores, each count variable was reorganized into a four-category (three threshold) ordinal scale (0 = 0 criteria, 1 = 1–2 criteria, 2 = 3–4 criteria, and 3 = 4 or more criteria) for each PD. We have previously examined the validity of this rescaling approach by testing whether a multiple threshold model is consistent with an assumption of bivariate normality to determine whether these categorized counts of endorsed criteria reflected ordered differences in severity on a single, normally distributed continuum of liability. This assumption was empirically supported for all 10 PDs examined.
Twin modeling
A Cholesky decomposition was specified for the full set of five NPTs, six APTs, and 10 PDs. Due to the size of this decomposition, the Cholesky was fit to a two-group MZ/DZ twin data structure with sexes combined. Model optimization was carried out using a Full Information Maximum Likelihood (FIML) raw data method as implemented in the R 3.1.2 (R Development Core Team, 2014) OpenMx package (Boker et al., Reference Boker, Neale, Maes, Wilde, Spiegel, Brick, Spies, Estabrook, Kenny, Bates, Mehta and Fox2011; Neale et al., Reference Neale, Hunter, Pritikin, Zahery, Brick, Kirkpatrick, Estabrook, Bates, Maes and Boker2016). To fit a Cholesky decomposition to twin data with so many variables (42 total), variables of different scale types were specified to facilitate optimization. The five BFI sum score variables were symmetrically distributed and treated as quasi-continuous. The six log-transformed PID-5-NBF variables were also treated as quasi-continuous. The 10 rescaled PD symptom count variables were treated as ordinal. However, rather than estimating all three thresholds per PD, a specification using fixed and free thresholds was implemented. With three thresholds per PD, the first threshold is fixed to 0, the second to 1, and the third estimated. This parameterization allows for a mean and variance to be estimated for each ordinal PD variable (Mehta et al., Reference Mehta, Neale and Flay2004). This approach reduces the computational demands of threshold integration and allows all the observed variables to be modeled as continuously distributed using a FIML approach. Additionally, FIML makes use of all the available data providing more robust inference against missing data.
The main Cholesky decompositions included all A (additive genetic) and E (unshared environment-error) paths. Next, the Cholesky non-zero lower diagonal A and E path estimates were converted into covariance matrices and then rescaled to 21 × 21 correlation matrices. These additive genetic and unique environmental correlation matrices were then submitted to exploratory factor analyses (EFA) in which different numbers of factors were extracted using an oblique Geomin rotation in the R Psych Package (Revelle, Reference Revelle2015). The number of factors to be extracted was guided by Scree plots and content analyses (Horn, Reference Horn1965). The minimum residual factor extraction method in the R psych package was used for all EFA solutions, since in some cases, the correlation matrices derived from the Cholesky path estimates resulted in non-positive definite conditions. This required adjustments to the Eigen values of the original derived correlation matrix to obtain a rotated EFA solution.
Due to the large number of freely estimated parameters in these Cholesky decompositions (755 Cholesky paths plus MZ and DZ means and thresholds parameterized as previously described for the full ACE model and 524 for the AE model) and the amount of computational time required to carry out FIML optimization, it became apparent that relying on a conventional single estimate of global fit to evaluate models was not practical. An alternative strategy was adopted where the degree of consistency of the end results of the EFA rotated solutions would be compared across a series of separate Cholesky optimizations obtained using different sets of reasonably bounded random starting values. Run times on a Unix multi-cluster server using parallel processing across multiple cores varied for the full ACE and reduced AE Cholesky decomposition but were in general much longer than typical optimization problems (e.g. 10 or fewer variables). Model fit was evaluated by the Akaike (AIC) and Bayesian information criteria (BIC) (Akaike, Reference Akaike1987; Raftery, Reference Raftery, Bollen and Long1993).
Results
Model fitting
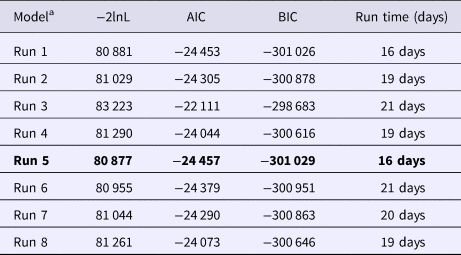
We ran 10 models each with different random start values. Two models did not converge and were not further considered. Results of the remaining eight models, which took a mean (s.d.) of 18.9 (1.8) days to converge, are seen in Table 1. The fifth run produced the best fit by both indices and therefore became our best-fit model. Runs 1 and 6 produced the second and third best-fit models.
Model fit statistics and run times for models run with random start values

a Five hundred and twenty-four estimated parameters, 1410 observations.
Bolded – best-fit model by both AIC and BIC.
Genetic factors
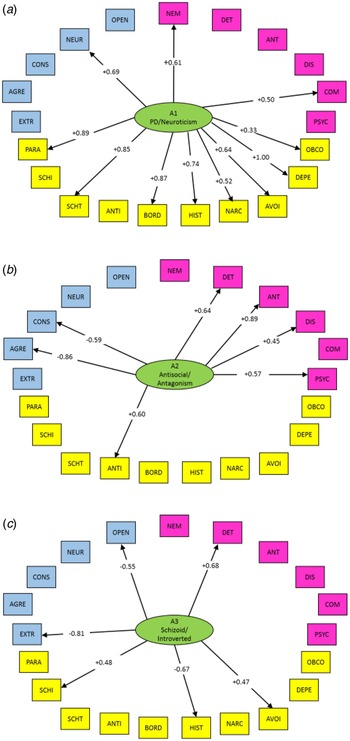
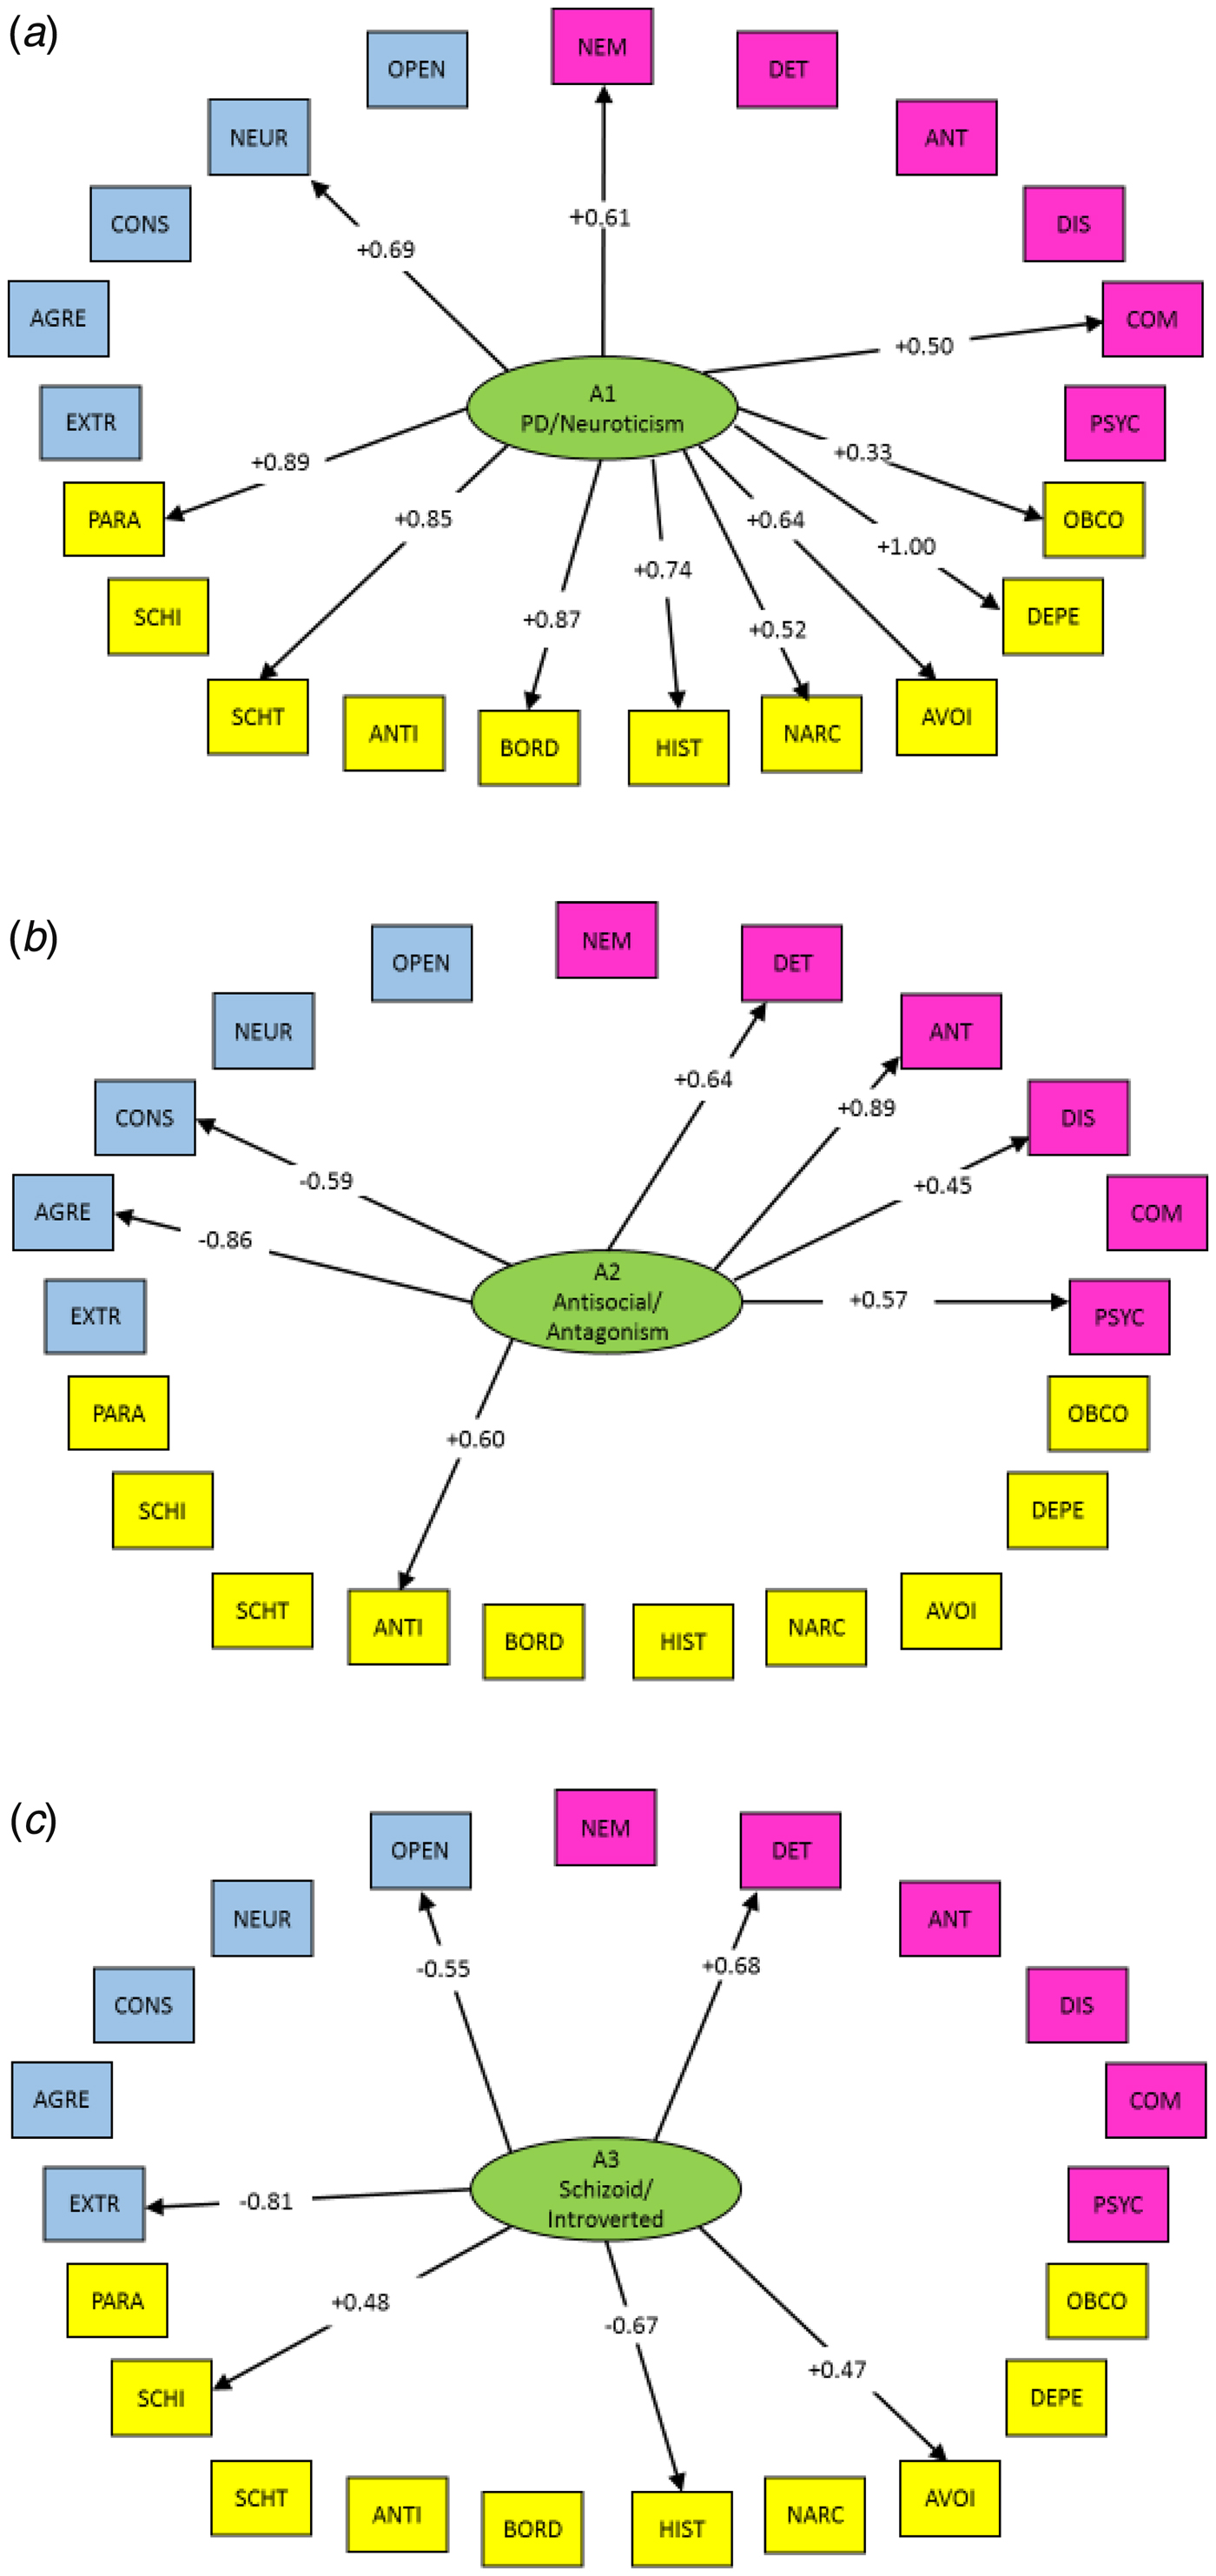
Examination of the Scree plot provided evidence for three or four genetic factors. While the three-factor solution was readily interpretable, the four-factor solution was less satisfactory (online Supplementary Appendix Table S1) in that the second factor from the three-factor solution was divided into two poorly defined and less interpretable dimensions. We therefore focused on the three-factor solution, the loadings of which are shown in Table 2 and illustrated in Fig. 1a–c.
(a) Parameter estimates for genetic common factor 1 from the best-fit model (run 5) from a three-factor oblique rotation of the genetic correlation matrix. Normative personality traits are in blue, abnormal personality traits are in red, and personality disorders are in yellow. Abbreviations and full names for the variables are as follows: EXTR, extraversion; AGRE, agreeableness; CONS, conscientiousness; NEUR, neuroticism; OPEN, openness to experience; NEM, negative emotionality; DET, detachment; ANT, antagonism; DIS, disinhibition; COMP, compulsivity; PSYCH, psychoticism; PARA, paranoid personality disorder; SCHI, schizoid personality disorder; SCHT, schizotypal personality disorder; ANTI, antisocial personality disorder; BORD, borderline personality disorder; HIST, histrionic personality disorder; NARC, narcissistic personality disorder; AVOI, avoidant personality disorder; DEPE, dependent personality disorder; OBCO, obsessive–compulsive personality disorder. (b) Parameter estimates for genetic common factor 2 from a three-factor oblique rotation of the genetic correlation matrix. Normative personality traits are in blue, abnormal personality traits in red, and personality disorders are in yellow. (c) Parameter estimates for genetic common factor 3 from a three-factor oblique rotation of the genetic correlation matrix. Normative personality traits are in blue, abnormal personality traits are in red, and personality disorders are in yellow.
Loadings on genetic factors for dimensions of normative personality, personality disorder traits, and personality disorders from the best-fit model

a Loading bolded if it was the highest for that dimension or, if not highest, an absolute value of >0.45.
The first factor had salient loadings on eight of the 10 DSM-IV PDs (all but schizoid and antisocial), N from the BFI, and negative emotionality and compulsivity from the PID-5-NBF. We labeled this a General Personality Disorder/Neuroticism common genetic factor.
Factor 2 had strong negative loadings on agreeableness and conscientiousness from the BFI, and strong positive loadings on antagonism and detachment from the PID-5-NBF and antisocial PD. It also had moderate positive loadings on disinhibition and psychoticism from the PID-5-NBF. We labeled this an Antisocial/Antagonism common genetic factor.
Factor 3 had substantial negative loadings on extraversion and openness from the BFI and histrionic PD, and positive loadings on detachment from the PID-5-NBF and schizoid and avoidant PD. This latent dimension was called a Schizoid-Introversion common genetic factor.
Correlations between the genetic factors was strongest between factors 1 and 2 (+0.57), modest between factors 1 and 3 (−0.27), and estimated at zero between factors 2 and 3.
Environmental factors
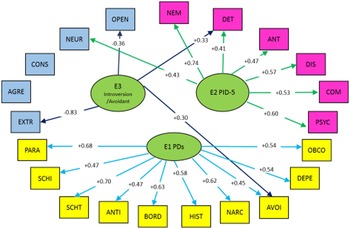
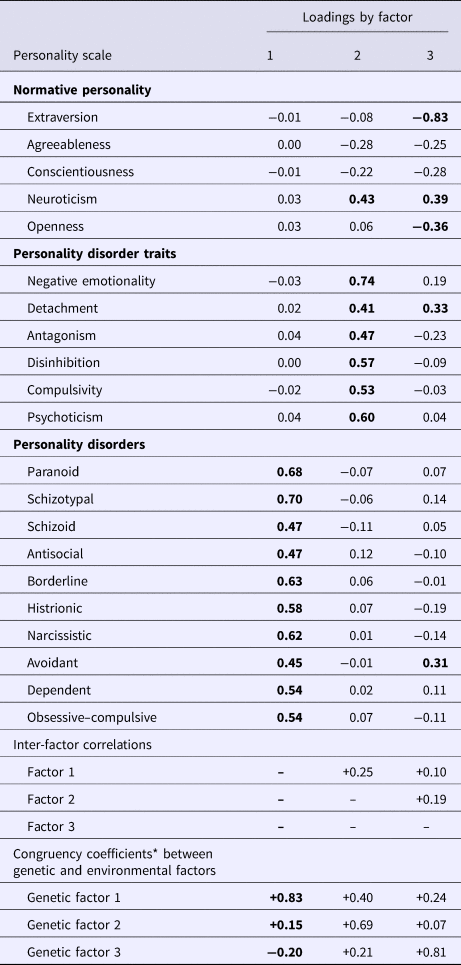
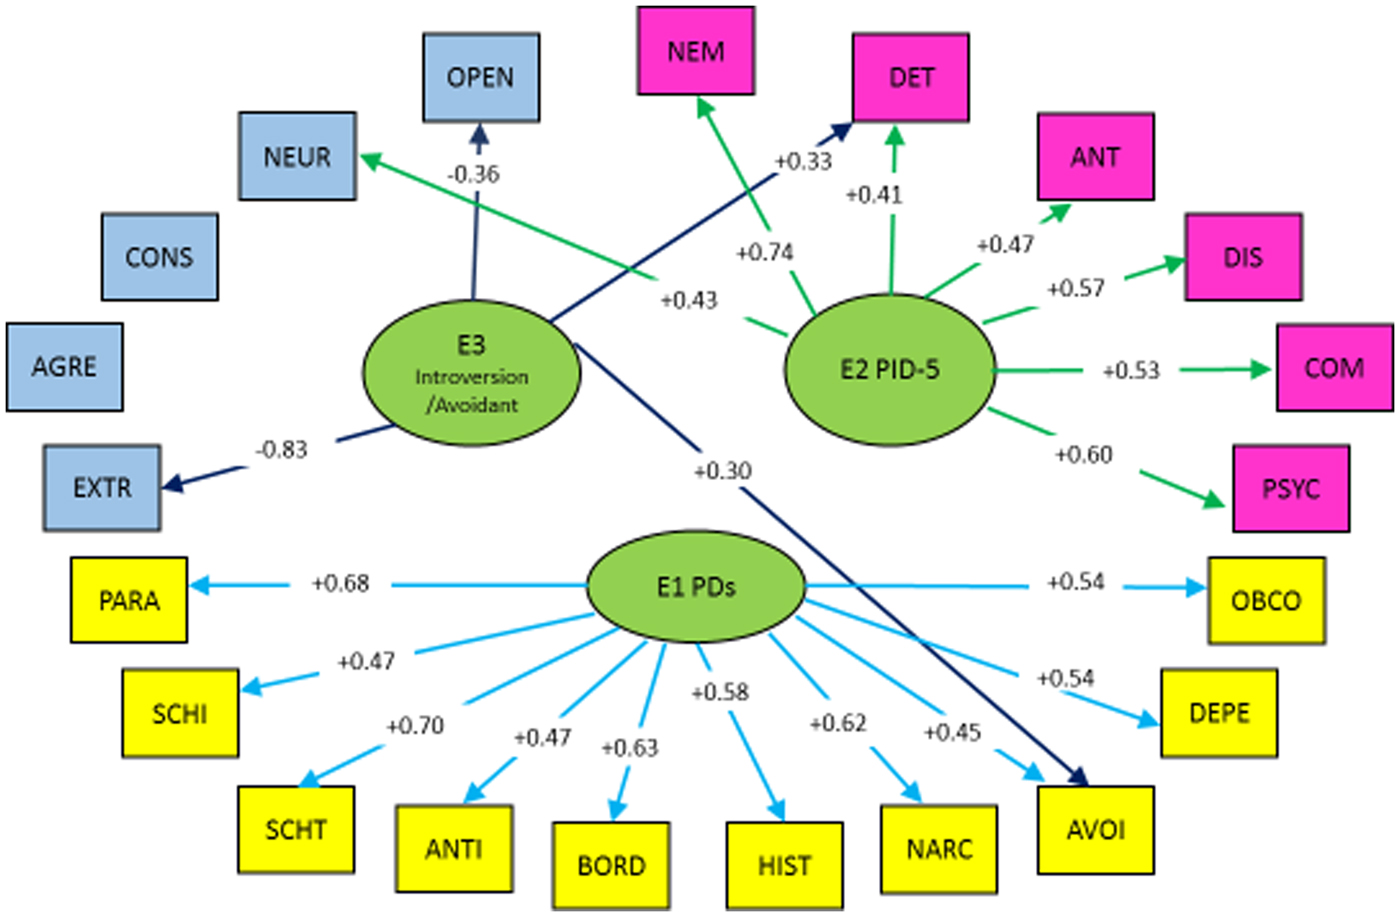
A Scree plot for the exploratory oblique factor analyses of the environmental correlation matrix suggested a four-factor solution. However, because the fourth factor had only a single loading >0.40 (online Supplementary Appendix Table S2), we focused on the more easily interpretable three-factor solution presented in Table 3 and Fig. 2.
Parameter estimates for environmental common factors from the best-fit model (run 5) from a three-factor oblique rotation of the environmental correlation matrix. Normative personality traits are in blue, abnormal personality traits are in pink, and personality disorders are in yellow. For abbreviations, see legend to Fig. 1a.
Loadings on environmental factors for dimensions of normative personality, personality disorder traits, and personality disorders from the best-fit model

The first factor had strong positive loadings ⩾ + 0.47 on all 10 DSM-IV PDs ranging with quite small loadings on all BFI and PID-5-NBF scales (<|0.05|). This was clearly a General Personality Disorder common environmental factor.
Factor 2 had strong loadings on all six of the PID-5-NBF scales with a moderately strong loading on the BFI N scale. Loadings on this factor for all the PDs and other BFI scales were small. This factor was best characterized as a Pathological Personality Trait/Neuroticism common environmental factor.
Factor 3 had substantial negative loadings on two BFI scales (extraversion and openness) and positive loadings on BFI neuroticism scale, the Detachment scale from the PID-5-NBF and avoidant PD. This is perhaps best termed an Introversion-Avoidant common environmental factor.
Inter-factor correlations for these environmental common factors were all modest: factors 1 and 2 +0.25, factors 1 and 3 +0.10, and factors 2 and 3 +0.19. The congruency coefficients between the genetic and environmental factors are presented in Table 3 (Lorenzo-Seva and ten Berge, Reference Lorenzo-Seva and ten Berge2006).
Discussion
We sought to clarify the underlying structure of genetic and environmental risk factors for individual PDs and specific NPT and APT dimensions, positing two heuristic hypotheses. The high congruence model predicted four or five genetic and environmental common factors each anchored in a distinct ‘big five’ dimension and each loading on a corresponding set of APTs and PDs. The low congruence model posited modest etiologic continuity between normative and disordered personality, predicting that the common genetic and environmental factors would be largely ‘level-specific’ in their influence – which separate etiological factors reflecting normative personality, maladaptive personality, and PDs.
Our results were complex and did not cleanly fit the predictions of either hypothesis. Rather, our findings provided support for some features of each. The first genetic factor resembled a ‘level-specific’ PD factor loading strongly on eight of the 10 PDs. However, it was also ‘anchored’ by the NPT of N and the related APT traits of negative emotionality and compulsivity. The second genetic common factor was clearly cross-level but was anchored by not one but two big five factors: A and C. The third factor most closely resembled that predicted by the high congruence model with clinically sensible cross-level loadings anchored by the single NPT of extraversion.
By contrast, the first two of our three environmental factors were consistent with the low congruence model with, respectively, strong level-specific loadings on all 10 PDs and all six PID-F factors (plus N). The third environmental factor, however, was as predicted by a high-congruence model anchored by the BFI dimension of extraversion with appropriate cross loadings on detachment from the PID-5-NBF and avoidant PD.
An overall interpretation of our findings also needs to consider the inter-factor correlations, the only prominent one of which was between the first and second genetic factors (+0.57). Of note, eight of the 11 variables with prominent loadings on the first genetic factor are PDs, and four out of seven of the prominent loadings on the second factor come from the PID-5-NBF. Thus, this correlation is likely driven by genetic factors that broadly predispose both to most PDs and high scores on most PID-5-NBF scales. This result suggests an aggregate association between genetic risk factors for PDs and APTs but not necessarily the strong genetic correlations between clinically similar individual PDs and APT dimensions predicted by the high congruence model.
The structure of genetic factors found in the current study resembles that in our previous examination of these 10 DSM-IV PDs (Kendler et al., Reference Kendler, Aggen, Czajkowski, Roysamb, Tambs, Torgersen, Neale and Reichborn-Kjennerud2008). The best-fitting model included three genetic factors. The first had substantial loadings on most PDs reflecting a general vulnerability to PD pathology. The second had strong loadings on antisocial and borderline PD, whereas the third had substantial loadings only on schizoid and avoidant PD.
Our results also resemble several prior three-factor models of personality. Our genetic factors closely resemble the three factors proposed in the Eysenck Personality Questionnaire (Eysenck and Eysenck, Reference Eysenck and Eysenck1975) with factor 1 reflecting neuroticism, factor 2 ‘psychoticism’ (low agreeableness, antagonism, antisocial traits, and PID-5-NBF psychoticism), and factor 3 extraversion. Our findings are also similar to those presented as part of a hierarchical meta-analytic study of normal and abnormal personality where the factors Negative Emotionality, Disinhibition, and Positive emotionality were related to (1) Neuroticism, (2) Agreeableness (reversed) and Conscientiousness (reversed), and (3) Extraversion and Openness (Markon et al., Reference Markon, Krueger and Watson2005).
A controversial topic during the DSM-5 deliberations was the placement of the Alternative DSM-5 model for PDs in section III (American Psychiatric Association, 2013; Zachar et al., Reference Zachar, Krueger and Kendler2016). This alternative model was predicated on a high coherence hypothesis – that strong and specific relationships exist between individual PDs and specific NPT and APT dimensions. The PID-5-NBF was explicitly developed to measure key dimensions of this alternative model (Krueger et al., Reference Krueger, Derringer, Markon, Watson and Skodol2012; South et al., Reference South, Krueger, Knudsen, Ystrom, Czajkowski, Aggen, Neale, Gillespie, Kendler and Reichborn-Kjennerud2016). Our results provide evidence both for and against the alternative DSM-5 model.
Our second and third genetic factors indicate that for the antisocial PD and the cluster of schizoid, histrionic, and avoidant PDs, genetic risk factors were well reflected in our measures of normative and APTs. This is consistent with the high coherence hypothesis and supportive of the alternative DSM model. But such relationships were not found for other important PDs including borderline, narcissistic, obsessive–compulsive, and schizotypal. Results for the first genetic factor were more ambiguous. On the one hand, it could be viewed as largely a ‘PD-specific’ factor as would be predicted by our low-coherence model, hence considered evidence against the alternative DSM model. On the other hand, it could be seen as a version of the ‘General Criteria for PD’ in the alternative model which, in our data, also reflects the normative and APTs of neuroticism and negative emotionality.
Unexpectedly, our environmental risk factors were considerably less supportive of the alternative model than our genetic factors. Our findings suggest that, with the likely exception of extraversion and associated APTs and PDs, most environmental experiences that impact on personality are not shared between PDs and the expected specific APT or NPT dimensions.
In aggregate, our results present evidence against the hypothesis that the full pattern of DSM-IV PDs can be captured by the standard APT and/or NPT dimensions. Whether this picture would differ if facet-level data were available for APT and NPT will need to be addressed by future studies. Our own results do, however, show significant areas of overlap of PDs, APTs, and NPT dimensions that were considerably stronger when reflecting genetic than environmental risk processes. Further empirical and psychometric research will be needed to bring these assessment methods into a closer consilience.
Our results can be profitably viewed in the context of our prior analyses with this sample where we showed that, in aggregate, the APT dimensions of the PID-5-NBF accounted for considerably more of the genetic variance of individual PDs (Reichborn-Kjennerud et al., Reference Reichborn-Kjennerud, Krueger, Ystrom, Torvik, Rosenstrom, Aggen, South, Neale, Knudsen, Kendler and Czajkowski2017) than the NPT dimensions of the BFI (Czajkowski et al., Reference Czajkowski, Aggen, Krueger, Kendler, Neale, Knudsen, Gillespie, Røysamb, Tambs and Reichborn-Kjennerud2018). These results suggest at a global level an expected pattern that is a closer genetic relationship between PDs and APTs than between PDs and NPTs. We observe this in our own findings of inter-factor genetic correlations. However, in this paper, we are asking a more stringent question, and one more relevant to evaluating the alternative DSM model. Instead of asking whether all the APT or NPT dimensions can predict genetic liability to an individual PD, we inquire about the genetic relationships between individual PDs and specific NPT and APT dimensions. It is to this question that we see support both for and against the high coherence alternative DSM model.
Limitations
These results should be interpreted in the context of eight potentially important methodological limitations. First, results derive from a Norwegian population-based twin sample and may not generalize to other populations. Second, the instruments used to assess NPTs and APTs were both short and lacked facet level traits. Greater communality might have been found between PDs and NPT and APT had they been assessed with longer instruments. Third, PDs were assessed at the wave 1 interview and NPTs and APTs at wave 2. Could the first genetic or environmental common factors loading strongly on the PDs in part reflect occasion-specific effects? This is inconsistent with prior evidence of very high genetic correlations for PDs measured at waves 1 and 2 (Kendler et al., Reference Kendler, Aggen, Neale, Knudsen, Krueger, Tambs, Czajkowski, Ystrom, Orstavik and Reichborn-Kjennerud2015; Reichborn-Kjennerud et al., Reference Reichborn-Kjennerud, Czajkowski, Ystrom, Orstavik, Aggen, Tambs, Torgersen, Neale, Roysamb, Krueger, Knudsen and Kendler2015). To test this formally, we fitted AE models to all scales from the BFI and PID-5-NBF and the six PDs that were assessed at wave 2 and then repeated these analyses using the scores from the same PDs from the wave 1 assessment. We readily identified a PD-dominant genetic and environmental common factor in these analyses (see online Supplementary Appendix Tables S3–S6). The mean loadings on the six PDs in PD-dominant genetic common factor did not significantly differ in the analyses containing the wave 1 (0.57 ± 0.13) v. wave 2 data (0.49 ± 0.11) (t = 0.40, df = 10, n.s.). Findings were similar for the environmental common factors: 0.58 ± 0.04 v. 0.56 ± 0.07 (t = 0.21, df = 10, n.s.). The results suggest that our PD-dominant genetic and environmental first common factors were not the result of the time difference in assessment of the DSM-IV PDs and the BFI and PID-5-NBF.
Fourth, given the complexity of our modeling, it was not feasible to explicitly examine sex differences. When fitted to simpler models, prior twin analyses in this sample have consistently been unable to detect sex effects on PDs (Kendler et al., Reference Kendler, Czajkowski, Tambs, Torgersen, Aggen, Neale and Reichborn-Kjennerud2006; Reichborn-Kjennerud et al., Reference Reichborn-Kjennerud, Czajkowski, Neale, Orstavik, Torgersen, Tambs, Roysamb, Harris and Kendler2007; Torgersen et al., Reference Torgersen, Czajkowski, Jacobson, Reichborn-Kjennerud, Roysamb, Neale and Kendler2008). Fifth, attrition occurred in this twin sample from the original birth registry through our wave 2 assessments. Detailed analyses of this attrition show that cooperation was strongly predicted by female sex, monozygosity, older age, and education, but by neither psychiatric symptoms nor drug use (Tambs et al., Reference Tambs, Ronning, Prescott, Kendler, Reichborn-Kjennerud, Torgersen and Harris2009). While attrition bias in our results is possible, the full-information maximum likelihood methods used here are typically robust against large biases due to missingness. Sixth, given the very long run time for our AE models and the lack of substantial shared environmental effects for our PD, BFI and PID-5-NBF measures in simpler analyses (Kendler et al., Reference Kendler, Czajkowski, Tambs, Torgersen, Aggen, Neale and Reichborn-Kjennerud2006; Reference Kendler, Aggen, Gillespie, Neale, Knudsen, Krueger, Czajkowski, Ystrom and Reichborn-Kjennerud2017; Reichborn-Kjennerud et al., Reference Reichborn-Kjennerud, Czajkowski, Neale, Orstavik, Torgersen, Tambs, Roysamb, Harris and Kendler2007; Torgersen et al., Reference Torgersen, Czajkowski, Jacobson, Reichborn-Kjennerud, Roysamb, Neale and Kendler2008; South et al., Reference South, Krueger, Knudsen, Ystrom, Czajkowski, Aggen, Neale, Gillespie, Kendler and Reichborn-Kjennerud2016), we did not extensively explore twin models containing such ‘C’ effects. We did however run two such ‘ACE’ models (mean run time 33 days). Both fit considerably worse than our best-fit AE models by both AIC and BIC.
Seventh, given the rarity of full syndromal PDs in the general population, we were unable to study PDs defined by diagnostic thresholds. Instead, we took the commonly used approach of analyzing a quantitative index of the number of endorsed criteria. While not ideal, population-based twin samples would have to be very large to contain sufficient numbers of individuals meet full PD criteria to support these kinds of analyses.
Finally, because of the very large number of parameters in our Cholesky decompositions, we could not rely on conventional methods of sequentially fitting and comparing increasingly more complex models. More skepticism is therefore warranted about our findings. However, we examined the genetic and environmental factor structures from the two other best-fit models (runs 1 and 6). As seen in the online Supplementary Appendix Tables S7 and S8, while these results differed in some modest details from those of the best-fit model, the overall pattern was very similar, providing added confidence in our findings.
Conclusion
Three major approaches have arisen in the fields of psychiatry and clinical psychology toward the assessment of personality. The inter-relationship between them has been subject of controversy. In this report we provide, for the first time to our knowledge, information about the relationship between the genetic and environmental determinants of these three major approaches. The results are nuanced and provide limited support for both the low and high congruence models. In aggregate, they suggest caution regarding simple overarching theoretical claims about the etiological relationships between NPTs, APTs, and PDs.
Acknowledgments
None.
Author ORCIDs
Kenneth S. Kendler, 0000-0001-8689-6570.
Financial support
This project was supported by the Research Council of Norway grant 196148/V50 and NIH grant RO1DA037558. Previous collection and analysis of twin data from this project was in part supported by grant MH-068643 from the National Institutes of Health and grants from the Norwegian Research Council, the Norwegian Foundation for Health and Rehabilitation, the Norwegian Council for Mental Health, the Borderline Foundation, and the European Commission. These funding agencies played no role in the design and conduct of the study, its collection, management, analysis, and interpretation of the data or in the preparation, review, or approval of the manuscript.
Conflict of interest
None.
Ethical standards
The authors assert that all procedures contributing to this work comply with the ethical standards of the relevant national and institutional committees on human experimentation and with the Helsinki Declaration of 1975, as revised in 2008. Written informed consent was obtained from all participants. Ethical approval for both waves was granted by The Norwegian Data Inspectorate and the Regional Ethical Committee.
Supplementary material
The supplementary material for this article can be found at https://doi.org/10.1017/S0033291719000047