INTRODUCTION
There is substantial evidence indicating that Alzheimer disease (AD) pathology (amyloid plaques and neurofibrillary tangles) can accumulate for decades before the onset of clinically detectable symptoms (Bateman et al., Reference Bateman, Xiong, Benzinger, Fagan, Goate, Fox and Morris2012; Price et al., Reference Price, McKeel, Buckles, Roe, Xiong, Grundman and Morris2009). This pattern suggests the presence of a lengthy preclinical stage of the disease during which pathology accrues without detectable influence on standard clinical measures. Thus, considerable research effort has been devoted to identifying cognitive and biological markers that are indicative of preclinical AD to best predict who will eventually develop clinical symptoms. Many biomarkers of the preclinical disease process have been identified. For example, a decrease in levels of amyloid-beta 42 (Aβ42) in the cerebrospinal fluid (CSF), which serves as a marker of amyloid deposition in the brain, and an increase in CSF levels of tau and p-tau181, which serve as a marker of neurodegeneration, have been observed in the earliest stages of AD (Fagan et al., Reference Fagan, Roe, Xiong, Mintun, Morris and Holtzman2007). In addition to CSF markers, it is also possible to image amyloid plaques directly using positron emission tomography (PET) and the amyloid tracer Pittsburgh compound-B (PIB).
Despite the predictive power of these biomarkers, there remain a substantial number of individuals who do not develop clinical symptoms even though they exhibit substantial AD pathology at autopsy (Price et al., Reference Price, McKeel, Buckles, Roe, Xiong, Grundman and Morris2009). This heterogeneity in clinical progression could be due to variations in where a specific individual falls on the continuous spectrum of preclinical AD. Thus, there has been considerable emphasis on detecting subtle cognitive changes that are related to preclinical AD pathology to provide a more specific characterization of AD risk. Specifically, recent recommendations from the NIA suggest that slight cognitive deficits, in conjunction with evidence of amyloidosis and neurodegeneration define stage 3 (highest risk) of preclinical AD (Sperling et al., Reference Sperling, Aisen, Beckett, Bennett, Craft, Fagan and Phelps2011). To this end, numerous recent studies have been reported that aim to elucidate the relationships between AD biomarkers and outcomes on concurrent cognitive tests. Indeed, a meta-analysis by Hedden, Oh, Younger, and Patel (Reference Hedden, Oh, Younger and Patel2013) indicated that subtle effects of amyloid burden can be detected on measures of episodic memory and executive functioning. These results suggest that such constructs can serve as sensitive cognitive markers of preclinical AD.
It is important to note that although recent reports have found evidence for a relationship between levels of AD biomarkers and concurrent cognitive performance (Aschenbrenner et al., Reference Aschenbrenner, Balota, Tse, Fagan, Holtzman, Benzinger and Morris2015; Duchek et al., Reference Duchek, Balota, Thomas, Snyder, Rich, Benzinger and Ances2013; Hedden et al., Reference Hedden, Oh, Younger and Patel2013; Rodrigue et al., Reference Rodrigue, Kennedy, Devous, Rieck, Hebrank, Diaz-Arrasita and Park2012; Sperling et al., Reference Sperling, Johnson, Doraiswamy, Reiman, Fleisher, Sabbagh and Pontecorvo2013), a substantial number of other studies have reported null effects (Aizenstein et al., Reference Aizenstein, Nebes, Saxton, Price, Mathis, Tsopelas and Klunk2008; Fagan et al., Reference Fagan, Mintun, Shah, Aldea, Roe, Mach and Holtzman2009; Nebes et al., Reference Nebes, Snitz, Cohen, Aizenstein, Saxton, Halligan and Klunk2013; Storandt, Head, Fagan, Holtzman, & Morris, Reference Storandt, Head, Fagan, Holtzman and Morris2012; Storandt, Mintun, Head, & Morris, Reference Storandt, Mintun, Head and Morris2009; Vemuri et al., Reference Vemuri, Wiste, Weigand, Shaw, Trojanowski, Weiner and Jack2009). At present, it is unclear whether the differing patterns of results are due to the relative sensitivity of the various cognitive tasks that are used or due to subject specific variations across samples in protective factors such as cognitive reserve (Stern, Reference Stern2009). Regardless, it is clear that developing cognitive measures that are consistently related to early AD biomarkers is critical.
In addition to episodic memory, accumulating evidence suggests that measures of attentional control are sensitive cognitive markers of very mild AD (Balota & Faust, Reference Balota and Faust2001; Perry & Hodges, Reference Perry and Hodges1999; Twamley, Ropacki, & Bondi, Reference Twamley, Ropacki and Bondi2006). Attentional control refers to the ability to direct attention toward relevant information and control irrelevant information in the environment and is particularly stressed when there are multiple competing dimensions that need to be controlled. For example, the Stroop color naming task (Stroop, Reference Stroop1935) is a classic paradigm used to measure attentional control. In this task, individuals are presented with a series of color words (e.g., “red”) written in colored font and are asked to name the color of the word while ignoring the word itself. Differences in performance between congruent trials (where the color and the word overlap) and incongruent trials (where the color and the word are different) can serve as a measure of attentional control.
Recently, attentional control tasks have also been shown to be sensitive to preclinical AD processes in asymptomatic individuals (Aschenbrenner et al., Reference Aschenbrenner, Balota, Tse, Fagan, Holtzman, Benzinger and Morris2015; Balota et al., Reference Balota, Tse, Hutchison, Spieler, Duchek and Morris2010; Duchek et al., Reference Duchek, Balota, Tse, Holtzman, Fagan and Goate2009, Reference Duchek, Balota, Thomas, Snyder, Rich, Benzinger and Ances2013; Gordon et al., Reference Gordon, Zacks, Blazey, Benzinger, Morris, Fagan and Balota2015). Although attention seems to be less consistently measured in studies on AD, there is evidence to suggest it is more consistently related to preclinical AD processes, compared to other cognitive processes. Specifically, in a review by Twamley et al. (Reference Twamley, Ropacki and Bondi2006), the authors note that 71% of studies that measured attention found relationships with preclinical AD compared to 57% for verbal learning and 50% for memory. Similarly, in the meta-analysis conducted by Hedden et al. (Reference Hedden, Oh, Younger and Patel2013) only 60% (47 datasets) included a general measure of executive function, only some of which measured attentional control directly. Furthermore, only 15 datasets were reported that included longitudinal changes in cognition, many of which analyzed PIB and episodic memory. Taken together, it is clear that both episodic memory and attentional control merit further evaluation as sensitive cognitive markers of preclinical AD.
Although most studies of cognitive-biomarker relationships have been cross-sectional in nature, a few studies have examined longitudinal cognitive changes as a function of amyloid burden primarily measured with imaging techniques (e.g., Doraiswamy et al., Reference Doraiswamy, Sperling, Coleman, Johnson, Reiman, Davis and Pontecorvo2012; Ellis et al., Reference Ellis, Lim, Harrington, Ames, Bush, Darby and Maruff2013; Ewers et al., Reference Ewers, Insel, Jagust, Shaw, Trojanowski, Aisen and Weiner2012; Landau et al., Reference Landau, Mintun, Joshi, Koeppe, Petersen, Aisen and Jagust2012; Lim et al., Reference Lim, Pietrzak, Ellis, Jaeger, Harrington, Ashwood and Maruff2013; Resnick et al., Reference Resnick, Sojkova, Zhou, An, Ye, Holt and Wong2010; Storandt et al., Reference Storandt, Mintun, Head and Morris2009; Villemagne et al., Reference Villemagne, Pike, Chételat, Ellis, Mulligan, Bourgeat and Rowe2011). In contrast, while several studies have been reported regarding CSF markers and cognition, most have examined prediction of later progression to dementia (Craig-Schapiro et al., Reference Craig-Schapiro, Perrin, Roe, Xiong, Carter, Cairns and Holtzman2010; Fagan et al., Reference Fagan, Roe, Xiong, Mintun, Morris and Holtzman2007; Li et al., Reference Li, Sokal, Quinn, Leverenz, Brodey, Schellenberg and Montine2007). Only a few studies have examined the relationship between CSF biomarkers and longitudinal cognitive change, and these studies have yielded variable findings including no relationship (Stomrud et al., Reference Stomrud, Hansson, Zetterberg, Blennow, Minthon and Londos2010; Rolstad et al., Reference Rolstad, Berg, Bjerke, Johansson, Zetterberg and Wallin2013), correlations only with Aβ42 (Li et al., Reference Li, Millard, Peskind, Zhang, Yu, Leverenz and Montine2014; Lo et al., Reference Lo, Hubbard, Shaw, Trojanowski, Peterson, Aisen and Jagust2011) or ptau (Glodzik et al., Reference Glodzik, de Santi, Tsui, Mosconi, Zinkowski, Pirraglia and de Leon2011) to correlations with multiple biomarkers (Roe et al., Reference Roe, Fagan, Grant, Hassenstab, Moulder, Dreyfus and Morris2013).
We had two primary goals in the present study. First, we assessed the sensitivity of attentional control and episodic memory composite scores to baseline levels of markers for AD pathology, particularly CSF measures (tau and Aβ42) and PET-PIB binding. We focus specifically on tau and Aβ42, given that these measures often account for independent variance and may reflect different underlying pathological processes (Aschenbrenner et al., Reference Aschenbrenner, Balota, Tse, Fagan, Holtzman, Benzinger and Morris2015; Storandt et al., Reference Storandt, Head, Fagan, Holtzman and Morris2012). Importantly, we extend the results of the aforementioned meta-analysis by also evaluating the sensitivity of attention to levels of tau-related biomarkers, which was not examined by Hedden et al. (Reference Hedden, Oh, Younger and Patel2013). We expected that both composite scores would be sensitive to the biomarkers at baseline based on the available literature. Second, and more importantly, we evaluated via longitudinal analyses the extent to which the two cognitive composite scores exhibited decline over time as a function of the same baseline biomarkers.
METHOD
Participants
All participants were recruited through the Charles F. and Joanne Knight Alzheimer Disease Research Center at Washington University in St. Louis as part of the Adult Children Study. This study was designed to longitudinally follow a group of cognitively normal middle-aged adults (age 45–74 years of age at study entry) on antecedent markers and risk factors of AD, including the presence or absence of a family history of AD. The Washington University Human Research Protection office approved this study.
All participants were assessed for symptoms of dementia by trained physicians using the Clinical Dementia Rating scale (Morris, Reference Morris1993). To be included in the present analyses, participants were required to be CDR 0 at the time of the first cognitive assessment (hereafter referred to as “baseline assessment”) and also have received a lumbar puncture to collect CSF within 2 years of the initial cognitive assessment. Any individual who did not receive a lumbar puncture within 2 years of the baseline cognitive assessment was excluded (N=30), leaving 238 individuals for further analysis. Similarly, any individual who did not receive a PET scan within 2 years of the first assessment was excluded from the PIB analysis leaving 228 individuals.
Cognitive Battery
Participants were given a series of computerized and paper and pencil tasks to measure different facets of cognition. Performance on selected tests from the battery was combined to form two cognitive composite scores. The first composite measured episodic memory and was created from the total number of items correctly recalled from the three free recall trials of the Selective Reminding Test (Grober, Buschke, Crystal, Bang, & Dresner, Reference Grober, Buschke, Crystal, Bang and Dresner1988), a weighted sum of the easy and hard trials from the associate learning subtest of the Wechsler Memory Scale (Wechsler & Stone, Reference Wechsler and Stone1973), and the number of correctly recalled units from the Logical Memory Delayed Recall task (Wechsler, 1997). These standard neuropsychological tests of episodic memory have shown strong sensitivity to AD dementia (see Morris et al., Reference Morris, McKeel, Storandt, Rubin, Price, Grant and Berg1991; Storandt & Hill, Reference Storandt and Hill1989).
The second composite measured attentional control and was formed from computerized versions of the Stroop color naming task (Spieler, Balota, & Faust, Reference Spieler, Balota and Faust1996; Stroop, Reference Stroop1935), the Simon task (Castel, Balota, Hutchison, Logan, & Yap, Reference Castel, Balota, Hutchison, Logan and Yap2007; Simon, Reference Simon1969), and consonant-vowel/odd-even (CVOE) task-switching paradigm (Tse, Balota, Yap, Duchek, & McCabe, Reference Tse, Balota, Yap, Duchek and McCabe2010). Each of these attentional control tasks is discussed briefly below and more detailed information is provided elsewhere (Duchek et al., Reference Duchek, Balota, Tse, Holtzman, Fagan and Goate2009).
Stroop Color Naming
The Stroop task consisted of four color words (yellow, red, blue, and green) and four neutral items (bad, legal, poor, and deep). The words and colors were crossed to form 36 congruent trials (each color word printed in its corresponding color nine times), 36 incongruent trials (each color word printed in each of the other colors three times), and 32 neutral trials (each neutral word printed twice in each color). Participants made a vocal response into a microphone and an experimenter coded each response as correct, incorrect or microphone error (false starts, stutters, or soft responses).
Simon Task
Participants were presented with a left or right pointing arrow and were asked to indicate which direction the arrow was pointing by pressing a key on the left or right side of the keyboard. On each trial, the arrow could appear in the middle, left or right side of the computer screen and participants were instructed to ignore the spatial location of the stimulus when making their response. Forty trials were congruent (the arrow direction was the same as the location on the screen), 40 incongruent (the arrow direction was opposite that of the screen), and 40 were neutral trials (the arrow was displayed in the center).
CVOE Task-Switching
Participants were presented with a letter-number stimulus (e.g., “A14”) accompanied by one of two response cues. “CV” indicated they should classify the letter as either a consonant or a vowel and “OE” indicated they should classify the number as odd or even. During the switch blockFootnote 1, the cues alternated such that the response cue switched every two trials. Participants completed 60 trials consisting of 30 switch trials (where the response cue was the opposite from the previous trial) and 30 non-switch trials (where the response cue was the same as the previous trial). The stimulus and the cue appeared simultaneously and remained until a response was made. The next trial began immediately after each response.
Formation of the Composite Scores
The episodic memory composite was created by standardizing each participant’s raw score on each task to the mean and standard deviation of the groups’ first time completing that particular test. The Z-scores were then averaged together and a higher score indicated better performance. The attentional control composite was formed in the same way using accuracy from the incongruent trials only from each taskFootnote 2. These are trials that place the strongest demands on attentional control.
Cerebrospinal Fluid Assessment
CSF was collected using methods described previously (Fagan et al., Reference Fagan, Roe, Xiong, Mintun, Morris and Holtzman2007). After an overnight fasting period, 20–30 mL were collected and then alliquoted (500 μL) and stored at −84°C in polypropylene tubes. Analyses were conducted after a single thaw using ELISA (INNOTEST, Fujirebio [formerly Innogenetics], Ghent, Belgium). Scores were examined for outliers and one was identified and excluded from further analysis (tau level greater than 6 SDs from the group mean).
PET-PIB Imaging
Imaging methods have been fully described elsewhere (Su et al., Reference Su, D’Angelo, Vlassenko, Zhou, Snyder, Marcus and Benzinger2013). A tissue mask for each region of interest was generated using Freesurfer segmentation (Fischl, Reference Fischl2004) and binding potentials were calculated using Logan graphical analysis with cerebellar gray matter as a reference region. A mean cortical binding potential (MCBP) was created by averaging across the following regions: left and right lateral orbitofrontal, inferior parietal, precuneus, rostral middle frontal, superior frontal, superior temporal, and middle temporal. After examining the distribution of MCBP, one individual was excluded as an outlier (score greater than 5 SDs from the group mean). It should be noted that this was the same individual who was excluded from the CSF analyses due to high tau.
Statistical Analysis
Each composite score was analyzed separately using the lme4 package in R (Bates, Maechler, Bolker, & Walker, Reference Bates, Maechler, Bolker and Walker2014). Our model selection strategy proceeded in two steps. We first tested a model that included main effects of baseline age, family history (coded 0 for negative and 1 for positive), apolipoprotein-E (APOE) genotype (coded 0 for absence of an ε4 allele and 1 for the presence of at least one allele), education, years in study (hereafter referred to as “time”), baseline CSF tau and Aβ42, the interaction between the CSF markers and time, as well as the interaction between tau and Aβ42. These model terms were always retained because they serve as tests of our theoretically motivated hypotheses. In the second step, we added all additional two-way interactions between the covariates (e.g., age, APOE) with time to examine which other variables may moderate the longitudinal change. Any interaction terms from this step that were not significant were removed from the final model. We believe this procedure strikes the best balance between testing theoretical terms of interest (specifically, the interaction of CSF biomarkers with time) and forming overly complex statistical models that may capitalize on chance fluctuations in the data. A separate model was specified in the same manner that substituted the CSF markers with PET-PIB.
Degrees of freedom for the approximate t tests were calculated using the Satterthwaite method implemented in the “lmerTest package” (Kuznetsova, Brockhoff, & Christensen, Reference Kuznetsova, Brockhoff and Christensen2014). All models included random intercepts and slopes for time across subjects unless otherwise noted. Finally, because the residuals were non-normally distributed, due to the skewness of the cognitive composites, for our inferential tests of the fixed effects, we calculated the standard errors from a non-parametric (case-resampling) bootstrap procedure. This approach is most robust to model misspecification compared with other bootstrapping techniques (Davison & Hinkley, Reference Davison and Hinkley1997)Footnote 3.
RESULTS
Sample Characteristics
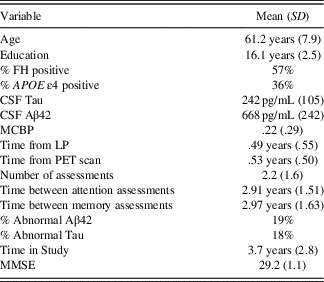
Demographic information on our sample is provided in Table 1. For descriptive purposes, we have indicated the proportion of individuals with “abnormal” Aβ42 and tau based on recently published cut offs (Vos et al., Reference Vos, Xiong, Visser, Jasielec, Hassenstab, Grant and Fagan2013) although we use the continuous measures for the current analyses.
Demographic characteristics, mean (SD) at initial assessment
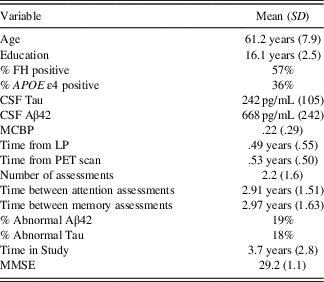
Note. FH=family history, CSF=cerebrospinal fluid, MMSE=Mini Mental State Exam, LP=lumbar puncture, MCBP=mean cortical binding potential. Abnormal Aβ42 was defined as less than 459 pg/mL and abnormal tau was defined as greater than 339 pg/mL.
Attention Composite Analysis
To avoid the undue influence of extreme outliers, we first calculated the estimated slope of the attention score over time for each participant. We then eliminated any individual who exhibited a slope (i.e., decline over time) that was greater than 3 standard deviations from the average slope of the sample, which removed 4 participantsFootnote 4. These analyses included 233 participants and of those 170 completed at least one follow up cognitive assessment. Given our interest in both baseline and longitudinal differences, individuals with only one assessment (the baseline assessment) were included to provide a better estimate of initial differences. It is not problematic for individuals with only one observation to be included when data are analyzed within the multi-level modeling framework (Snijders & Bosker, Reference Snijders and Bosker1999).
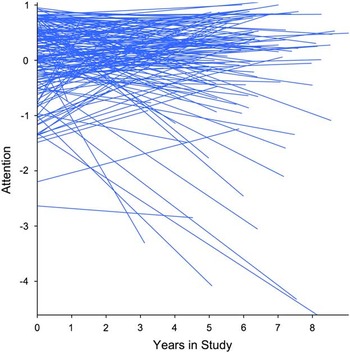
For descriptive purposes, we first calculated the intra-class correlation (ICC) from a random intercept only model to provide an estimate of between and within person variability. The ICC was .33 indicating that 33% of the variation in the attention composite was due to cross sectional differences, leaving 67% of the variability due to within person change. We next added fixed and random effects of time to assess the magnitude of individual differences in rate of change. The inclusion of random slopes for time provided a significant increment in model fit over the random intercepts only model (χ2(3)=47.43; p≤.001), indicating substantial individual differences in rate of change. Figure 1 displays a spaghetti plot of the entire sample to visually convey these individual differences. The random effects confidence interval for time was −.192 to.164, which indicates that 95% of our sample was predicted to have a slope between those values.
Spaghetti plots of individual predicted trajectories in the attention composite over time.

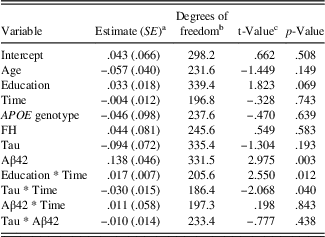
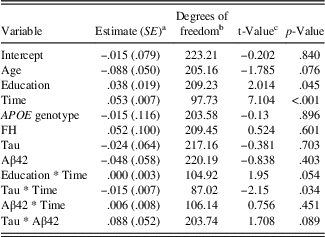
We next entered our predictor variables and their interactions in a single model as described above. The parameter estimates from this model are provided in Table 2.
Parameter estimates from the analysis of CSF and attentional control
Note. Age and the CSF markers were standardized within the sample. Education was centered at 16 years (the average of the sample). Time reflects years since the initial assessment. APOE genotype was coded 0 for absence of and 1 for the presence of the ε4 allele. Family history was coded 0 for no history and 1 for positive history.
a Standard error was calculated from the standard deviation of the bootstrapped distribution based on 5000 replications.
b Degrees of freedom estimated using the Satterthwaite method.
c Estimate divided by the bootstrapped standard error.
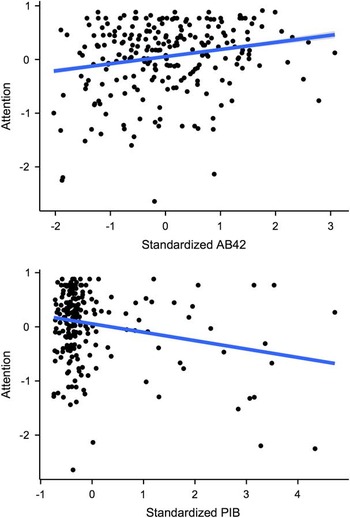
Importantly for the present work, baseline levels of CSF were significantly related to attention performance at the initial assessment such that individuals with lower levels of Aβ42 exhibited lower baseline performance (Figure 2; β=.14; p=.003). In contrast, tau levels at baseline did not correlate with concurrent performance although the effect was in the expected direction (β=−.09; SE=.072; p=.19). In addition, APOE genotype also did not predict attention performance, however our recent results have shown that the effect of APOE on cognitive performance is mediated by levels of Aβ42 (Aschenbrenner et al., Reference Aschenbrenner, Balota, Tse, Fagan, Holtzman, Benzinger and Morris2015), thus APOE did not exert an influence above and beyond Aβ42 in these data.
Relationship between cognition and Aβ42 (Top Panel) and PET-PIB (Bottom Panel) at baseline assessment.

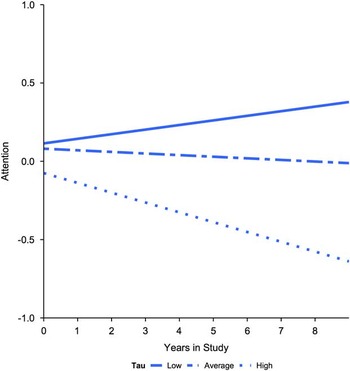
Importantly, turning to longitudinal change, our analysis revealed a significant interaction between tau and time, indicating that individuals with the highest levels of tau at baseline declined significantly on the attention composite over the course of the study. This relationship is depicted in Figure 3, which plots change in attention at three tertiles of tau. As shown, when tau is relatively high, the decline in the attention score was particularly dramatic. None of the other factors, in particular neither Aβ42 nor the tau by Aβ42 interaction, interacted with time indicating that longitudinal changes in the cognitive composites in the present sample were driven primarily by tauFootnote 5.
Relationship between attention and time in study varies as a function of baseline CSF tau. For visualization, regression lines are plotted at the lowest tertile of tau (solid line, less than 190 pg/mL), middle tertile (dashed line), and highest tertile (dotted line, greater than 276 pg/mL).

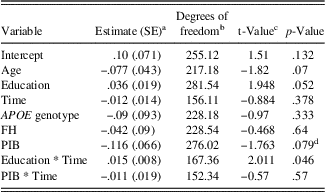
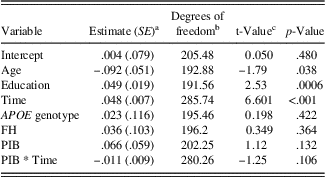
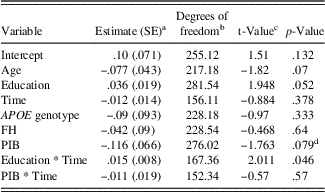
The results of the second model, using PIB as a predictor rather than the CSF biomarkers, are presented in Table 3. The effect of PIB on baseline attention performance was statistically significant using a one-tailed test which is justified by the a priori predicted directionality of the effect (i.e., higher PIB values should impair cognition). Despite this, there was no detectable influence of PIB on longitudinal change.
Parameter estimates from the analysis of PIB and attentional control
Note. Age and the CSF markers were standardized within the sample. Education was centered at 16 years (the average of the sample). Time reflects years since the initial assessment. APOE genotype was coded 0 for absence of and 1 for the presence of the ε4 allele. Family history was coded 0 for no history and 1 for positive history. PIB=Pittsburgh compound B.
a Standard error was calculated as the standard deviation of the bootstrapped distribution based on 5000 replications.
b Degrees of Freedom estimated using the Satterthwaite method.
c Estimate divided by the bootstrapped standard error.
d This comparison is significant using a one-tailed test.
Episodic Memory Composite
The memory assessment was given separately from the attention assessment and the assessments were on average 53 days apart. Since we were interested in how episodic memory changes within the same time frame as the attention measures, we excluded 17 participants who received the episodic memory tests more than 1 year before or after the attention assessment. It should be noted that inclusion or exclusion of these participants had minimal effects on the outcomes. As before, we also screened for individuals with extreme slopes, which removed five individuals.
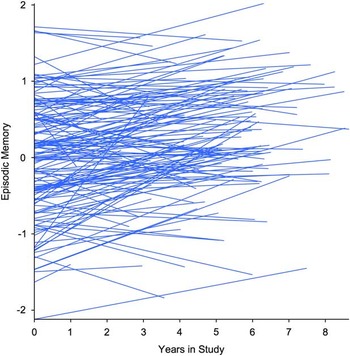
The intra-class correlation was .74 indicating the bulk of the variation was carried by cross-sectional differences. As shown in Figure 4, the overall trend was for scores on episodic memory to increase over time, which is consistent with a practice effect on certain episodic memory tasks (Galvin et al., Reference Galvin, Powlishta, Wilkins, McKeel, Xiong, Grant and Morris2005). This observation was confirmed by a simple model including fixed and random effects for time, which revealed a positive and significant slope over time, β=.051, SE=.007, p<.001, with a random effects confidence interval of 0 to .103.
Spaghetti plots of individual predicted trajectories in the episodic memory composite over time.

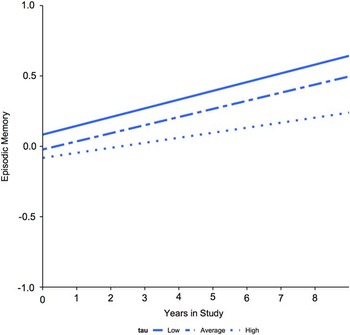
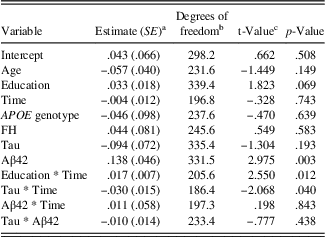
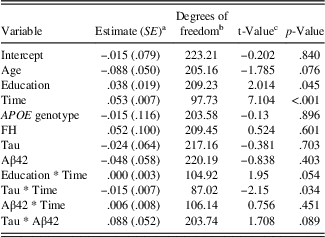
Parameters from a model that included all baseline risk factors and CSF are presented in Table 4. As shown, none of the risk factors including APOE, family history, tau or Aβ42 significantly correlated with baseline performance in episodic memory. However, in terms of the longitudinal changes, we again observed that levels of CSF tau were significantly related to the magnitude of change in memory performance over time depicted in Figure 5. As shown, although everyone increased in performance over the course of the study (likely due to practice effects), individuals with relatively high levels of baseline tau exhibited a slightly attenuated increase relative to the rest of the sample. As with the attention composite, the 3-way interaction among tau, Aβ42 and time was not significant.
Relationship between episodic memory and time in study varies as a function of baseline CSF tau. For visualization, regression lines are plotted at the lowest tertile of tau (solid line, less than 190 pg/mL), middle tertile (dashed line). and highest tertile (dotted line, greater than 276 pg/mL).

Parameter estimates from the analysis of CSF and episodic memory
Note. Age and the CSF markers were standardized within the sample. Education was centered at 16 years (the average of the sample). Time reflects years since the initial assessment. APOE genotype was coded 0 for absence of and 1 for the presence of the ε4 allele. Family history was coded 0 for no history and 1 for positive history.
a Standard error was calculated from the standard deviation of the bootstrapped distribution based on 5000 replications.
b Degrees of Freedom estimated using the Satterthwaite method.
c Estimate divided by the bootstrapped standard error.
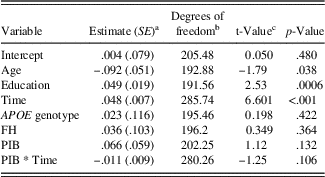
Table 5 lists the parameters from the model that included PIB. Similar to the attention analysis, PIB did not significantly predict baseline performance nor longitudinal change.
Parameter estimates from the analysis of PIB and episodic memory
Note. Age and the CSF markers were standardized within the sample. Education was centered at 16 years (the average of the sample). Time reflects years since the initial assessment. APOE genotype was coded 0 for absence of and 1 for the presence of the ε4 allele. Family history was coded 0 for no history and 1 for positive history. PIB=Pittsburg compound B.
a Standard error was calculated as the standard deviation of the bootstrapped distribution based on 5000 replications.
b Degrees of Freedom estimated using the Satterthwaite method.
c Estimate divided by the bootstrapped standard error.
DISCUSSION
The primary goals of the present report were to provide a systematic evaluation of cross-sectional differences in two cognitive constructs as a function of AD pathology measured with well-established biomarkers, and more importantly, to analyze whether baseline biomarkers would predict the magnitude of cognitive change over time. Our results returned two primary findings. First, baseline Aβ42 was correlated with concurrent attention performance consistent with our prior research. Second, levels of tau in the CSF significantly predicted longitudinal change in both the attention and episodic memory composites. We discuss each of these issues in turn.
Individuals who exhibit slight deficits on sensitive cognitive measures, in addition to possessing indicators of AD pathology are possibly at the greatest risk of developing symptomatic AD. This is supported by Vos et al. (Reference Vos, Xiong, Visser, Jasielec, Hassenstab, Grant and Fagan2013) who used a composite score of three episodic memory tests to define stage 3 of preclinical AD and showed the rate of progression to dementia was greatest for individuals in stage 3 over a 5-year period. Past literature has focused to a large extent on episodic memory performance given that brain regions that underlie episodic memory retrieval appear particularly vulnerable to the accumulation of AD pathology (e.g., Buckner et al., Reference Buckner, Snyder, Shannon, LaRossa, Sachs, Fotenos and Mintun2005). However, a growing body of evidence suggests that measures of attentional control are also sensitive cognitive markers and indeed the relationship between memory and attention processes has already been well-established (Balota & Duchek, Reference Balota and Duchek2015; Craik & Lockhart, Reference Craik and Lockhart1972).
Our attention composite was highly related to levels of Aβ42 at baseline assessment. Although past results using attentional control measures (Aschenbrenner et al., Reference Aschenbrenner, Balota, Tse, Fagan, Holtzman, Benzinger and Morris2015) showed sensitivity to both CSF markers separately, we did not replicate the relationship with tau in the present sample. This is possibly because our sample consists of individuals who are younger (mean age=61 years) than our past report (mean age=68 years). Concurrent tau-cognition relationships are possibly more likely to be detected in older individuals, who are further along in the disease process.
The attention composite was also related to levels of PIB at baseline when using a one-tailed test. In contrast, the episodic memory composite score was not reliably related to either the CSF markers or the PIB measure at the initial assessment in this sample. This is concordant with the literature in showing that relationships between episodic memory and concurrent AD biomarkers are subtle and difficult to detect (Hedden et al., Reference Hedden, Oh, Younger and Patel2013). Whether our inability to detect a concurrent relationship between amyloid and memory is due to differences in power or the relatively younger age range of our sample remains to be determined. However, it is interesting to note that the relationship with Aβ42 was significant for attentional control and larger than the same relationship with episodic memory (Z=2.53; p<.05) in the present sample. Thus, to stage individuals within the preclinical AD continuum according to recent recommendations (Sperling et al., Reference Sperling, Aisen, Beckett, Bennett, Craft, Fagan and Phelps2011), attentional control measures may serve as a more promising target for defining stage 3 “subtle cognitive impairment”, and should be considered in cognitive assessment batteries. Clearly, larger samples are important to better establish this possibility.
Most importantly, both the attention and episodic memory composite exhibited changes in longitudinal trajectories that were related to baseline tau. Specifically, individuals with high levels of tau exhibited robust declines in attention relative to the rest of the cohort. Similarly, although the net result was for episodic memory to increase over time, individuals with high tau levels exhibited an attenuated increase in performance over the course of the study. As previously mentioned, the majority of studies to date have examined the relationship of PET-PIB to longitudinal changes in cognition and this study is important in extending those findings to CSF markers.
In contrast to tau, neither Aβ42 nor PET-PIB predicted longitudinal change in either cognitive composite. It is particularly noteworthy that we did not detect a relationship between PIB and cognitive decline because these two measures have been shown to be correlated in past reports even in cognitively healthy controls (Doraiswamy et al., Reference Doraiswamy, Sperling, Coleman, Johnson, Reiman, Davis and Pontecorvo2012; Ellis et al., Reference Ellis, Lim, Harrington, Ames, Bush, Darby and Maruff2013; Storandt et al., Reference Storandt, Mintun, Head and Morris2009). One possible reason for this discrepancy is, as noted, the present sample is relatively young compared to previous studies. The three studies cited above, for example, examined individuals who were in their early to mid-seventies.
Prior research has also provided evidence for a relationship between CSF markers and cognitive decline (e.g., Fagan et al., Reference Fagan, Roe, Xiong, Mintun, Morris and Holtzman2007; Roe et al., Reference Roe, Fagan, Grant, Hassenstab, Moulder, Dreyfus and Morris2013). It is interesting to note that the best predictor is often the tau/Aβ42 ratio which conflates the two main effects as well as the interaction between these two biomarkers. Indeed, when we examined the ratio in the present data, the results showed a reliable effect on baseline performance as well as on longitudinal change in attentional control (β=−.11; p=.009). However, when we decompose the ratio into the constituent parts (as we did in the reported analyses) the baseline differences were driven by Aβ42 and the longitudinal effect by tau. This is consistent with recent evidence modeling the temporal changes in CSF biomarkers which suggests that Aβ42 plateaus while individuals are still in the asymptomatic stage of AD but tau continues to increase into mild cognitive impairment (Bertens, Knol, Scheltens, & Visser, Reference Bertens, Knol, Scheltens and Visser2015). Thus, it may be the continued increase of tau throughout the early stages of the disease that ultimately drives cognitive decline. Our results are also consistent with a temporal ordering of AD biomarkers, in which Aβ42 becomes abnormal first (and drives the baseline correlation with attentional control), followed by amyloid deposition measured with PET-PIB followed by changes in tau (which drives longitudinal change across multiple cognitive domains). Clearly, this interpretation is post hoc and further modeling efforts should strive to test these hypotheses more directly.
It is important to consider these findings within the framework of neurobiological changes that occur in early and pre-clinical AD. As mentioned, focus is often devoted to medial temporal regions, but substantial PIB deposition appears in prefrontal and parietal regions (Klunk et al., Reference Klunk, Engler, Nordberg, Wang, Blomqvist, Holt and Långström2004; Mintun et al., Reference Mintun, LaRossa, Sheline, Dence, Lee, Mach and Morris2006), regions that are often implicated in attention based tasks (e.g., Banich et al., Reference Banich, Milham, Atchley, Cohen, Webb, Wszalek and Magin2000; Kane & Engle, Reference Kane and Engle2002; Vanderhasselt, De Raedt, & Baeken, Reference Vanderhasselt, De Raedt and Baeken2009). Indeed, accumulation of biomarkers have functional and behavioral consequences for these regions even in otherwise cognitively healthy adults (Duchek et al., Reference Duchek, Balota, Thomas, Snyder, Rich, Benzinger and Ances2013; Gordon et al., Reference Gordon, Zacks, Blazey, Benzinger, Morris, Fagan and Balota2015). Given that attention is heavily linked to episodic memory processes (McCabe, Roediger, McDaniel, Balota, & Hambrick, Reference McCabe, Roediger, McDaniel, Balota and Hambrick2010), it is possible that early disruption of attention systems can be detected at the same time or potentially before substantial accumulation of pathology leads to clinically detectable effects on memory.
Despite its strengths, there are a few limitations to this study that should be noted. We performed a large number of statistical comparisons without including any correction to p-values. We addressed this issue by testing only theoretically justified higher-order interactions involving time in study and using composite scores of cognition rather than individual test scores. In addition, many of our participants had only two assessment points which may have limited our power. As more data and assessments become available, future work should carefully address the shape of trajectories (e.g., linear vs. quadratic) as well as testing for the presence of higher order interactions among the targeted variables. Furthermore, future studies should also consider correlated age-related changes such as lewy body accumulationFootnote 6. Finally, CSF biomarkers and PET PIB measures have differential reliability (Mattsson et al., Reference Mattsson, Andreasson, Persson, Arai, Batish, Bernardini and Blennow2011; Su et al., Reference Su, D’Angelo, Vlassenko, Zhou, Snyder, Marcus and Benzinger2013), and because of this, one should be cautious in arguing for a null effect of Aβ42 and PIB on cognitive change.
CONCLUSION
AD biomarkers have the potential to provide critical insight into the preclinical AD process and to help stage individuals based on relative risk of developing dementia. CSF markers predict concurrent deficits in attentional control as well as longitudinal declines in both attention and memory. Both attentional control measures and episodic memory provide insight into the cognitive consequences of preclinical AD and should continue to be evaluated as sensitive screening instruments for preclinical staging as well as cognitive endpoints for treatment outcomes. Future work should be conducted with increased emphasis on longitudinal change in these cognitive constructs to best characterize the preclinical AD profile.
Acknowledgments
This research was supported by the National Institute on Aging grants T32 AG000030 and P01-AG26276, National Institute of Neurological Disorders and Stroke grant 5P30NS048056, and Washington University Institute of Clinical and Translational Sciences grant UL1 TR000448 from the National Center for Advancing Translational Sciences (NCATS). We thank our participants and the Clinical Core of the Knight Alzheimer Disease Research Center at Washington University for providing clinical evaluations. The authors have no conflicts of interest to declare.