NOMENCLATURE
- A
-
rotor disk area, πR 2 [m2]
- c
-
blade chord [m]
- c ∞
-
speed of sound [m/s]
- CFD
-
computational fluid dynamics
- CoV
-
Control Volume
- Cp
-
pressure coefficient
- CQ
-
rotor torque coefficient, Q/(ρAΩ2 R 3)
- CT
-
rotor thrust coefficient, T/(ρAΩ2 R 2)
- FM
-
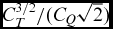
figure of merit,
 $C_{T}^{3/2}/(C_{Q} \sqrt{2})$
- Fx
-
sectional blade horizontal force [N/m]
- Fz
-
sectional blade vertical force [N/m]
- h
-
Gurney flap height [m]
- LGV
-
large wind tunnel of Politecnico di Milano
- M ∞
-
free-stream Mach number, U ∞/c ∞
- Mtip
-
blade tip Mach number, ωR/c ∞
- Nb
-
number of blades
-
$\hat{\mathbf {n}}$
-
nornal unit vector
- Ω
-
rotor rotational speed [RPM]
- p
-
pressure [Pa]
- PIV
-
Particle Image Velocimetry
- qcrit
-
q-criterion
- Q
-
rotor torque [Nm]
- r
-
blade radial coordinate [m]
- R
-
rotor radius [m]
- Re ∞
-
Reynolds number, ρU ∞ c/μ
- ROSITA
-
ROtorcraft Software ITAly
- S
-
abscissa on the integration contour [m]
- T
-
rotor thrust [N]
- U
-
velocity magnitude vector [m/s]
- U ∞
-
free-stream velocity, ωr 65%R [m/s]
- u
-
horizontal velocity component [m/s]
- w
-
vertical velocity component [m/s]
- X
-
horizontal coordinate [m]
- Y
-
span-wise coordinate [m]
- Z
-
vertical coordinate [m]
- α
-
angle-of-attack [deg]
- ΔFx
-
sectional blade horizontal force difference due to Gurney flap [%]
- ΔFz
-
sectional blade vertical force difference due to Gurney flap [%]
- γ
-
specific heat ratio
- μ
-
air viscosity [Pa s]
- ρ
-
air density [kg/m3]
- σ
-
rotor solidity cNb /(πR)
-
$\sigma \hspace{-4pt}\sigma$
-
viscous stress tensor
- θ
-
blade pitch angle measured at 75%R [deg]
- θ comm
-
commanded blade pitch angle [deg]


1.0 INTRODUCTION
The study of innovative blades equipped with active or passive devices has recently become one of the most interesting topics of investigation in the rotorcraft research field. Indeed, many attractive solutions were studied for improving helicopter rotor performance as well as for reducing noise and vibrations. Leading-edge slat(Reference Yeo1), variable droop leading edge(Reference Chandrasekhara, Martin and Tung2), air-jet vortex generators(Reference Gardner, Richter, Mai and Neuhaus3,Reference Singh, Peake, Kokkalis, Khodagolian, Coton and Galbraith4) , plasma actuators(Reference Post and Corke5) and trailing-edge flap(Reference Feszty, Gillies and Vezza6,Reference Dehaeze, Baverstock and Barakos7) represent some of the devices investigated both in the numerical and in experimental activities for these aims.
Among these studies, the interest in the use of a Gurney flap(Reference Liebeck8) on rotor blades(Reference Kentfield9) has recently grown. In fact, the lift enhancement produced by a Gurney flap can be useful to improve the blade performance for both hovering and forward flight conditions, as demonstrated by several numerical works investigating the use of a fixed(Reference Pastrikakis, Steijl, Barakos and Malecki10) and active deployable Gurney flap for rotor applications(Reference Yeo1,Reference Yee, Joo and Lee11,Reference Woodgate, Pastrikakis and Barakos12) . The potential effect of Gurney flaps is supported also by experimental activities carried out on an aerofoil model in steady(Reference Li, Wang and Zhang13,Reference Maughmer and Bramesfeld14) and oscillating conditions(Reference Chandrasekhara, Martin and Tung15,Reference Zanotti, Grassi and Gibertini16) . Nevertheless, literature presents a lack of experimental data regarding complete rotor configurations equipped with Gurney flaps, necessary for a thorough assessment of their effects on blade performance and for the validation of numerical models.
With this aim, the present work describes the main results of an experimental activity performed at Politecnico di Milano to evaluate the performance of Gurney flaps on a four-bladed articulated helicopter rotor model designed by Leonardo Helicopters(Reference Biava, Campanardi, Gibertini, Grassi, Vigevano and Zanotti17) in hovering conditions. In fact, hovering represents the flight condition suitable for the use of Gurney flaps extended over the entire blades rotating cycle. The results of the aeroelastic analysis carried out by Pastrikakis et al(Reference Pastrikakis, Steijl, Barakos and Malecki10) over a W3-Sokol rotor blade showed that in a full-scale rotor, Gurney flaps may influence the blade torsional deflection with respect to the clean blade geometry. Nevertheless, in the rotor model employed in the present experimental work, the elastic deformation of the blades can be expected to be very small.
The present experimental activity was carried out in the frame of GUM Research Project, part of the Green Rotorcraft Integrated Technology Demonstrator of the Clean Sky programme, co-funded by the European Commission. The tests were performed in the open test section of Politecnico di Milano’s large wind tunnel (LGV). The global aerodynamic loads and torque acting on the rotor were measured to characterise the performance of three fixed Gurney flap configurations with different heights. Moreover, the tests included 2D Particle Image Velocimetry (PIV) surveys carried out around the blade section at 65% of the rotor radius with and without the Gurney flaps. In particular, PIV surveys were performed both on the upper and lower surfaces of the selected blade aerofoil to obtain the velocity data around the entire aerofoil contour. Indeed, the main goal of the PIV measurements was the evaluation of the sectional aerodynamic loads from the measured local velocity data, representing an essential feature to complete the aerodynamic performance characterisation of the blade equipped with the different Gurney flaps. As a matter of fact, the direct measurement of the sectional airloads by the integration of surface pressure measurements represents a very challenging and demanding task as, due to the limited dimensions of a typical blade model, the instrumentation of the blade model with a conspicuous number of miniature pressure transducers on the section contour highly increases the complexity of the model design and manufacturing. Therefore, the possibility of calculating the blade section aerodynamic loads from velocity data represents a very interesting chance for the present purpose due to the non-intrusivity of this technique.
In the present work, the considered methodology was based on the Control Volume (CoV) approach(Reference Anderson18). Indeed, for the investigated hovering test conditions, the blade aerofoil experiences low angles of attack and the flow in the outer region of the PIV measurement window almost behaves as adiabatic and inviscid. Therefore, pressure on the integration contour of the control surface was calculated from velocity data using the isentropic equations(Reference Anderson19). The reliability of this simplified methodology was assessed by comparison with the results of a complete 3D Computational Fluid Dynamics (CFD) simulation of the clean blade performed using a high-fidelity compressible Navier-Stokes code. Indeed, CFD simulations provide an accurate estimation of the blade performance for clean blade geometries, as shown, for instance, by the comparison with experimental results reported in Droandi et al(Reference Droandi, Zanotti and Gibertini20) and in Droandi and Gibertini(Reference Droandi and Gibertini21). Thus, in the present work, the CFD solution of the clean blade was considered as a reference to estimate the accuracy of the investigated method to evaluate the sectional loads from velocity data under the considered assumptions, as done in the work by Ragni et al(Reference Ragni, van Oudheusden and Scarano22). Therefore, this non-intrusive method was used to evaluate the effects of the different Gurney flaps on the sectional vertical and horizontal force components with respect to the clean blade performance. The employed methodology represents a quite interesting tool to be used, in particular, for the estimation of the airloads radial distribution on non conventional rotor blade configurations. Indeed, a CFD simulation of a complex rotor configuration equipped, for instance, with very small active or passive flaps as in the present case could be still considered a quite challenging task due to the very high grid accuracy required to reproduce the fine details of the blades geometry reliably.
In Section 2, the set-up of the helicopter rotor model and of the instrumentation is described. Section 3 reports the main experimental results and describes the methodology used for the calculation of the aerodynamic loads from velocity data and its validation. Final considerations and comments are given in Section 4.
2.0 EXPERIMENTAL RIG
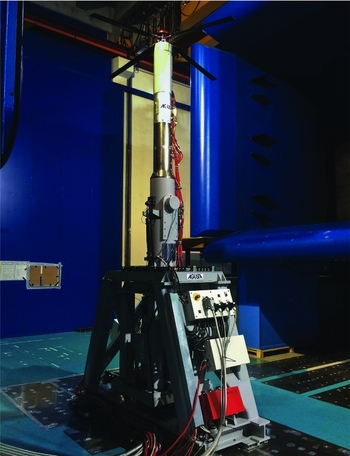
The four-bladed fully articulated rotor was set up in the open test section of the LGV wind tunnel of Politecnico di Milano (see Fig. 1). Each blade hinge was instrumented with a high-accuracy Hall effect sensor to directly measure the pitch, lead-lag and flap angles. The collective, longitudinal and lateral pitch controls were provided to the blades by means of three independent electric actuators acting on the swashplate. The rotor model, with a radius (R) equal to 1.1m, was equipped with a strain gauge six-components balance to measure the aerodynamic loads and moments (F.S. 3500N on vertical force, accuracy 0.3% F.S.). Moreover, the rotor torque was measured by a torquemeter mounted on the rotor shaft (F.S. 500Nm, accuracy 0.05% F.S.).
Leonardo Helicopters rotor model in the LGV open test section.

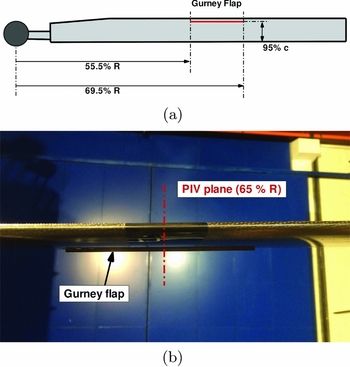
The blades were built in carbon fibre with a constant 90-mm chord (c) and a constant NACA 0012 section. The blade presented an 8° linear twist. An interchangeable passive Gurney flap spanning the blade radial stations between 55.5%R and 69.5%R could be attached to the lower surface of the blade at 95% of the aerofoil chord (see Fig. 2(a)). In particular, three different Gurney flaps with different height (h = 1.5mm, h = 2mm and h = 2.5mm) were also built in carbon fibre. The surface of the blade around the 65%R, corresponding to the section selected for PIV surveys, was painted with black opaque paint to reduce laser reflections (see Fig. 2(b)).
Rotor blade model: (a) Schematic view of the rotor blade; (b) Particular of the carbon fiber blade equipped with passive Gurney flap (h = 2.5mm).

2.1 PIV set-up
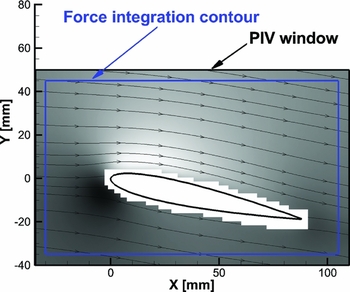
The PIV system comprises a Nd:Yag double pulsed laser with 200-mJ output energy and a wavelength of 532nm and a double shutter CCD camera with a 12 bit, 1, 952 × 1, 112 pixel array equipped with a 105-mm lens. Two-component PIV surveys were carried out both on the upper and lower surface of the aerofoil over a measurement window spanning more than the blade section chord. The complete velocity field around the blade section aerofoil was reconstructed combining the results of two separate surveys carried out with the laser sheet striking the upper and the lower surface of the aerofoil. In particular, the upper and lower measured fields, presenting a small overlapping band between them, were superimposed taking care to not introduce any discontinuity at the junctions. The dimensions of the final reconstructed measurement window around the blade section were 135mm × 90mm, as can be seen in Fig. 3. As the region close to the aerofoil contour was influenced by laser reflections, the PIV velocity fields in this area were blanked.
PIV window dimensions and rectangular integration contour used for aerodynamic forces determination.

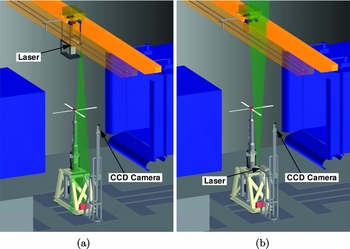
The layout of the PIV instrumentation in the LGV wind-tunnel open test section is shown in Fig. 4. The camera was mounted on a metallic structure made of aluminium profiles. The pitch angle of the camera can be adjusted to align the camera line of sight with the cone angle of the rotor. For the survey over the aerofoil upper surface, the laser was mounted on a metallic structure attached to the overhead crane of the wind-tunnel building (see Fig. 4(a)). On the other hand, to survey the region around the aierofoil lower surface, the laser was mounted on the same supporting structure of the camera below the rotor disk (see Fig. 4(b)). For both test configurations, the laser was mounted horizontally, as the optics was equipped with a mirror to adjust the laser sheet attitude to be normal to the blade axis. The flow insemination was made by means of a particle generator with Laskin nozzles fixed to the overhead crane. The tracer particles consisted in small oil droplets with a diameter within the range of 1–2
 $\mu \text{m}$
. The acquisition of the image pairs was phase-locked with the azimuthal angle of the same master blade selected for the test. A total amount of 200 image pairs were acquired for each test condition. This number of images was considered a fair compromise between the need to obtain reliable phase averages and a contained runtime of the rotor during the PIV surveys. However, in order to evaluate the statistical convergence of the reconstructed mean velocity field, also a phase-average based over half the number of the acquired image pairs was computed and compared with the one based on the full database. The calculated differences observed on both velocity components were very small. Indeed, for all the considered PIV conditions, discrepancies below 0.2% of the free-stream velocity were found on more than 95% of the total data points, while differences in the order of 1% of the free-stream velocity were found only in a few data points (less than 0.5% of the total data set). Thus, 200 image pairs can be considered enough to obtain a good statistical convergence on the mean velocity field. The repeatability of PIV velocity measurements over the entire set of image pairs, particularly on the integration contour, was very good with a maximum standard deviation of about 1% of the free-stream velocity. A detailed statistical analysis taking into account the standard deviation of all velocities measured on the integration contour demonstrated a precision of about 1% and 0.2%, respectively, for the horizontal and vertical force components averaged over the entire set of image pairs.
PIV instrumentation set-up: (a) survey on the blade section upper surface; (b) survey on the blade section lower surface.

The image pairs post-processing was carried out using the PIVview 2C software(23), developed by PIVTEC. In particular, the multi-grid technique(Reference Raffel, Willert and Kompenhans24) was employed to correlate the image pairs, starting from a 96 × 96 pixels to a 32 × 32 pixels minimum interrogation window. Therefore, the spatial resolution of the velocity measurement points was about 2mm. The accuracy of the present PIV measurement can be estimated considering a maximum displacement error of 0.1px(Reference Zanotti, Ermacora, Campanardi and Gibertini25). Thus, taking into account the employed pulse-separation time and the optical magnification(Reference De Gregorio, Pengel and Kindler26), the maximum in-plane velocity components error was about 0.2m/s.
3.0 RESULTS AND DISCUSSION
The tests reproducing hovering conditions were performed with a rotational speed of the rotor set to n = 1, 600RPM, (Mtip = 0.54). The wind-tunnel activity comprised tests with both the clean blade geometry and the blade equipped with three different Gurney flaps.
3.1 Global loads and torque measurements
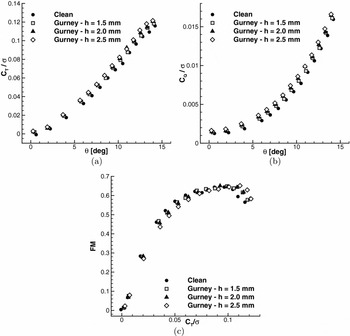
The global performance of the rotor measured with and without the Gurney flaps is shown in Fig. 5. The behaviour of the measured thrust coefficient (CT ) shows an apparent increase of thrust due to the Gurney flaps in the whole range of blade pitch angle considered in the tests (see Fig. 5(a)). For instance, at θ = 12.5°, an increase of 10% of the global thrust with respect to the clean configuration was found with the Gurney flap with maximum height (h = 2.5mm). This represents a consistent increase of the global thrust considering that the Gurney flap spans only 14% of the rotor radius.
Comparison of the global performance measured with and without the Gurney flaps in hovering, n = 1, 600RPM, Mtip = 0.54.

On the other hand, as it was expected, the rotor aerodynamic torque measured with the Gurney flaps is higher that the one evaluated for the clean rotor geometry when considered at the same blade pitch angle (see Fig. 5(b)). Nevertheless, the difference between the measured torque with and without the Gurney flaps decreases as the blade pitch angle increases. As a matter of fact, it is more interesting to compare the torque obtained at the same thrust, so evaluating the actual efficiency of the rotor. Indeed, the classical way to evaluate the rotor efficiency in hovering is to compute the Figure of Merit (FM) defined as the ratio between the induced power in hovering ideal condition and the actual hovering power at the same thrust (see Fig. 5(c)). The behaviour of the FM curves measured for the different blade configurations clearly shows that the increase of the Gurney flap height corresponds to a shift of the FM curves towards higher CT /σ. Thus, for CT /σ below 0.07 the FM of all the flapped rotor configurations tested is lower that the one evaluated for the clean rotor geometry. In particular, the FM curve for the highest Gurney flap (h = 2.5mm) remains below the clean rotor one up to CT /σ = 0.1, while the two lower Gurney flap configurations do not alter significantly the clean rotor performance in the range of CT /σ between 0.07 and 0.09. However, for CT /σ higher than 0.1 all the Gurney flap configurations tested become effective. Indeed, in the latter operative range, the Gurney flaps produce a significant increase of the FM with respect to the clean rotor configuration. In particular, the highest Gurney flap tested (h = 2.5mm) is the most effective, showing an increase of about 10% of the FM with respect to the clean blade. Thus, the measurements show that Gurney flaps introduce an important benefit for rotor performance in the CT range of practical interest for the helicopter flight.
3.2 PIV measurements
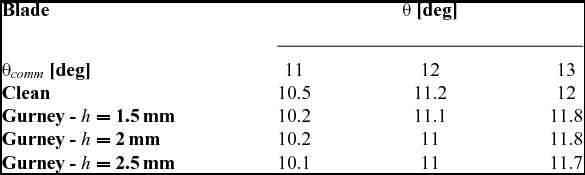
The 2D PIV surveys at 65%R were carried out on the same section at three collective pitch angles for each blade configuration. In particular, the measurements for the blade configurations with and without the Gurney flaps were performed at the same commanded collective pitch angles (θ comm ). The actual pitch angles differ from the commanded ones mainly due to system backlash and flexibility. Table 1 presents the test matrix of PIV measurements, where the actual blade pitch angle is measured at 75% of the rotor radius.
Test matrix of the PIV tests in hovering

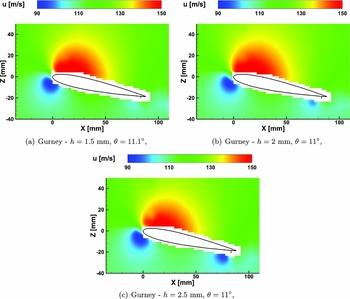
Figure 6 shows the contours of the phase-averaged horizontal velocity component u measured by PIV for the blade section configurations with the different Gurney flaps at the intermediate pitch angle considered during the surveys. The PIV results comparison shows an apparent effect of the Gurney flap on the flow field. In fact, increasing the height of the Gurney flap, a further decrease of the velocity in the flow region around the Gurney flap can be observed. The PIV velocity fields were then used to compute the aerodynamic loads at 65%R blade section using the control volume approach(Reference Anderson18).
Comparison of the PIV velocity fields measured on the blade section at 65%R equipped with Gurney flaps, Re ∞ = 7.3 × 10⁵, M ∞ = 0.349.

3.2.1 Sectional airloads evaluation from velocity data
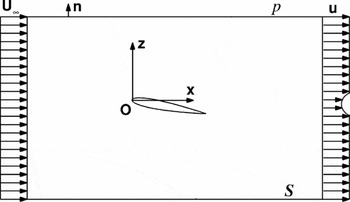
The control volume approach employed in the present work to compute the sectional aerodynamic force is based on the use of the integral form of the momentum equation. A schematic view of the control volume enclosing the blade section aerofoil is illustrated in Fig. 7, as well as the reference system adopted for the calculations.
Scheme of the control volume approach for the evaluation of the aerodynamic load on a 2D body.

For the present hovering conditions, some simplifications to the mathematical model can be introduced. The flow is considered compressible, a 2D rectangular domain is considered and a steady flow condition can be reasonably assumed in statistical sense. Moreover, following van Oudheusden et al(Reference van Oudheusden, Scarano, Roosenboom, Casimiri and Souverein27) and Ragni et al(Reference Ragni, Ashok, van Oudheusden and Scarano28), in order to partially limit the effects of possible measurement uncertainty on the control volume’s external surface, the free-stream velocity vector is used to correct the momentum flux term. The integral momentum equation incorporating all the previous assumptions can be written as follows, where the aerodynamic force is expressed in a Reynolds time-averaged sense:
 $$\begin{equation}
\langle \mathbf {F} \rangle = - \oint _{S} \langle \rho \rangle \, \left( \langle \mathbf {U} \rangle \cdot \hat{\mathbf {n}} \right) \, \left( \langle \mathbf {U} \rangle - \mathbf {U}_{\infty } \right) \, dS - \oint _{S} \langle \rho \, \left( \mathbf {U}^{\prime } \cdot \hat{\mathbf {n}} \right) \, \mathbf {U}^{\prime } \rangle \, dS + \oint _{S} \left( - \langle P \rangle \, \hat{\mathbf {n}} + \langle \sigma \hspace{-4.2pt}\sigma \rangle \, \hat{\mathbf {n}} \right) \, dS
\end{equation}$$
The viscous stress tensor
 $\sigma \hspace{-4pt}\sigma$
for a compressible flow can be expressed, under the Stokes hypothesis (bulk viscosity ζ = 0), as function of the velocity deformation tensor
 $\mathbb {D}(\mathbf {U})$
and the viscosity coefficient μ:
 $$\begin{equation}
\sigma \hspace{-4.2pt}\sigma \left( \mathbb {D}, \mu \right) = 2 \, \mu \, \mathbb {D} \left( \mathbf {U} \right) - \displaystyle\frac{2}{3} \, \mu \left( \nabla \cdot \mathbf {U} \right) \mathbb {I}
\end{equation}$$
The three terms on the right-hand side of Equation (1) can be calculated by evaluating the flow physical properties along the control volume’s external surface and following the integration path in the clockwise direction. The infinitesimal horizontal and vertical force components result as:
 $$\begin{equation}
\begin{array}{llll}
d \langle F_{x} \rangle = & - \langle \rho \rangle \left( \langle u \rangle - u_{\infty } \right) \langle w \rangle dx + \langle \rho \rangle \left( \langle u \rangle - u_{\infty } \right) \langle u \rangle dz + \langle \rho \, u^{\prime } u^{\prime } \rangle dz - \langle \rho \, u^{\prime } w^{\prime } \rangle dx \\
& - \langle P \rangle \, dx + \displaystyle\frac{2}{3} \langle \mu \rangle \, \partial _{x} \langle u \rangle dx + \langle \mu \rangle \left( \partial _{z} \langle u \rangle + \partial _{x} \langle w \rangle \right) dx \\
d \langle F_{z} \rangle = & - \langle \rho \rangle \langle w \rangle \langle w \rangle dx + \langle \rho \rangle \langle w \rangle \langle u \rangle dz + \langle \rho \, u^{\prime } w^{\prime } \rangle dz - \langle \rho \, u^{\prime } w^{\prime } \rangle dx \\
& - \langle P \rangle \, dz + \langle \mu \rangle \left( \partial _{z} \langle u \rangle + \partial _{x} \langle w \rangle \right) dz + \displaystyle\frac{2}{3} \langle \mu \rangle \, \partial _{z} \langle w \rangle dz \end{array}
\end{equation}$$
Equation (3) can be easily integrated along the control volume’s external surface once the flow field properties are known. While the in-plane velocity components are available from PIV measurements, pressure, density and viscosity around the aerofoil section need to be calculated. In the outer region of the PIV measurement window, the flow can be assumed to behave as steady, adiabatic and inviscid. Under these assumptions, the isentropic relations(Reference Anderson18) for a perfect gas can be employed to reconstruct pressure and density fields using the measured local velocity:
 $$\begin{equation}
\frac{P}{P_{\infty }} &=& \left[ 1 + \frac{\gamma - 1}{2} |\mathbf {M}_{\infty }|^{2} \left( 1 - \frac{|\mathbf {U}|^2}{|\mathbf {U}_{\infty }|^2} \right) \right] ^{\frac{\gamma }{\gamma -1}},
\end{equation}$$\\
 $$\begin{equation}
\frac{\rho }{\rho _{\infty }} &=& \left[ 1 + \frac{\gamma - 1}{2} |\mathbf {M}_{\infty }|^{2} \left( 1 - \frac{|\mathbf {U}|^2}{|\mathbf {U}_{\infty }|^2} \right) \right] ^{\frac{1}{\gamma -1}},
\end{equation}$$
The reliability of the sectional aerodynamic force calculation was assessed by a 3D CFD simulation of the clean blade used to compute a reference distribution of the aerodynamic loads along the blade span for the analysed hovering conditions. The simulations were carried out using the compressible Navier-Stokes code ROSITA(Reference Biava29), purposely developed for rotorcraft applications and successfully employed to estimate the performance of a helicopter rotor with good accuracy, as shown by the comparison with experimental results illustrated, for instance, in the work by Droandi et al(Reference Droandi, Zanotti and Gibertini20). The CFD code ROSITA numerically integrates the unsteady compressible RANS equations coupled with the one-equation turbulence model of Spalart-Allmaras. The Navier-Stokes equations are formulated in terms of the absolute velocity and are discretised in space by means of a cell-centred finite-volume implementation of Roe’s scheme(Reference Roe30). Second-order accuracy is obtained through the use of MUSCL extrapolation supplemented with a modified version of the Van Albada limiter introduced by Venkatakrishnan(Reference Venkatakrishnan31). Moreover, the viscous terms are computed by applying Gauss’ theorem and using a cell-centred discretisation scheme. Time advancement is carried out with a dual-time formulation(Reference Jameson32), employing a second-order backward differentiation formula to approximate the time derivative and a fully unfactored implicit scheme in pseudo-time. The Generalised Conjugate Gradient (GCG), in conjunction with a block incomplete lower-upper preconditioner, is used to solve the resulting linear system.
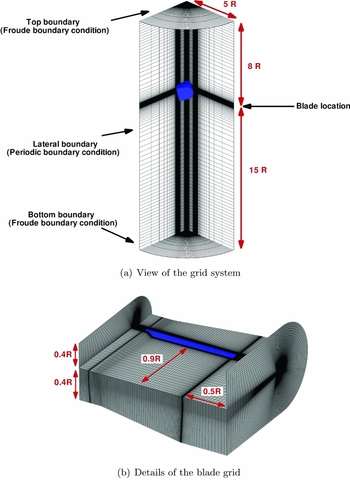
For the present CFD calculations, the axisymmetrical flow conditions considered and the circumferential periodicity of the rotor wake geometry allowed some useful simplifications to be introduced. Indeed, steady-state numerical simulations were carried out only on a 90° cylindrical sector around a single blade with periodic boundary conditions on the sides. Thus, the control volume containing the whole rotor can be reduced to one-fourth. This approach was successfully used in the work by Droandi and Gibertini(Reference Droandi and Gibertini21) to validate the design of an optimised blade for a proprotor. The computational mesh was composed of two different structured multi-block grids. The first one makes up the background flow region in which the blade was located (see Fig. 8(a)), and the second one represents the blade and the closer flow region (see Fig. 8(b)). The background grid had an O-H monoblock meshing topology containing a total of about 1.2 × 10⁶ cells with the outer boundaries located 4R from the blade tip in the span-wise direction, 8R above and 15R below the rotor plane in vertical direction. A C-O grid multi-block meshing topology was used for the blade grid to ensure a very good nodes distribution and orthogonality in the proximity of the blade surface. The first layer of elements near the blade surface was set to obtain the value of the dimensionless wall distance (y+) equal to 1. This value was calculated on the basis of the flow conditions (i.e. the Reynolds and Mach number) at the blade tip. The blades were discretised using a hyperbolic law along the chord-wise, span-wise and normal surface directions. The outer boundaries of the grid were located at 0.4R from the blade surface except in the span-wise direction, where they were at 0.5R from the tip, and in the trailing-edge region where they were at 0.9R. The blade grid contains a total of about 4 × 10⁶ cells. Efficient computations for the considered hovering flight condition were carried out by imposing the farfield Froude boundary conditions(Reference Biava29) on the top and bottom sections of the background grid, while classical periodic boundary conditions are set on the two periodic faces on the background grid sides. A no-slip boundary condition was applied on the blade surfaces.
CFD grid details.

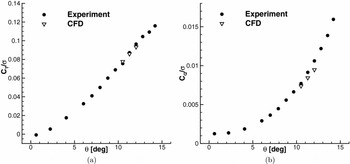
Simulations were performed to reproduce the three collective pitch angles considered for the PIV surveys with the clean blade. As well known, steady-state simulations were carried out to reproduce the hovering conditions efficiently. The rotor rotational speed was fixed to n = 1, 600RPM corresponding to a blade tip Mach number (Mtip ) of 0.54 and the blade was set to reproduce the three pitch angles measured at 75%R. The reliability of the present CFD model to reproduce the investigated hovering conditions is given by the good agreement between the measured and the computed global performance of the rotor, as shown by the global thust and torque coefficients comparison shown in Fig. 9. The CFD solution was therefore considered as a reference to evaluate the performance of the method used to calculate the sectional airloads from PIV data.
Comparison between the measured and computed rotor thrust and torque coefficients in hovering, n = 1, 600RPM, Mtip = 0.54.

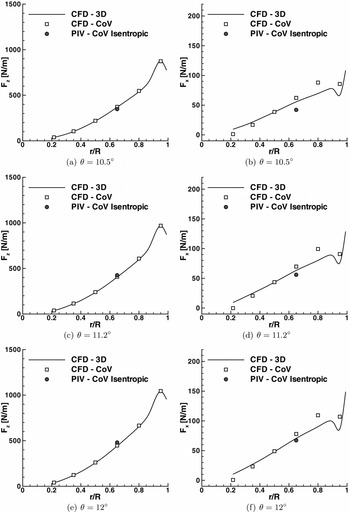
The vertical and horizontal sectional aerodynamic forces calculated using the CoV approach at 65%R for the three investigated collective pitch angles are compared with the loads distribution along blade span extracted from the CFD solutions in Fig. 10. Moreover, the availability of the velocity fields along the clean blade span resulting from the complete numerical simulation enabled to investigate the limits and robustness of the proposed simplified method based on the CoV on 2D velocity data. With this aim, the same figure shows the sectional loads calculated on six different sections along blade span using the CoV applied on flow field data (i.e. velocity, pressure, density) extracted from CFD solutions. In particular, all the aerodynamic forces were calculated according to Equation (3), where the terms related to the Reynolds stresses were neglected. Indeed, these terms, evaluated from PIV measurements, introduce a negligible contribution in the forces calculation for all the considered test cases (below 0.1% for both force components). The rectangular integration contour employed for the calculation of the sectional aerodynamic forces is depicted with a blue solid line in Fig. 3. The sectional loads evaluated from both PIV and CFD data by the CoV approach were calculated using the same spatial resolution along the integration contour.
Comparison of the vertical and horizontal aerodynamic forces along the clean blade span in hovering, n = 1, 600RPM, Mtip = 0.54.

For the three considered collective pitch angles, the PIV-based sectional aerodynamic loads are in good agreement with the results obtained from the complete 3D numerical solution considering normal and shear stresses on the blade surfaces. In particular, a mean discrepancy of about 5% of the CFD reference value was found for the vertical force component calculated from PIV data. On the other hand, a mean difference below 10% was found for the horizontal force component, analogously to what found by Ragni et al for a similar application where a more complex approach is used for pressure determination(Reference Ragni, van Oudheusden and Scarano22). As indicated by the comparison of the measured and computed global thrust and torque shown in Fig. 9, a limited part of the discrepancies between sectional airloads observed in Fig. 10 could be related to the accuracy of the CFD numerical solution in reproducing the real performance of the rotor model, particularly for the horizontal force component (see Fig. 9(b)).
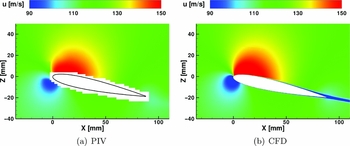
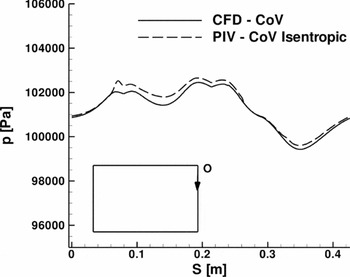
In order to explain the differences obtained in the aerodynamic loads estimation, the comparison of the velocity fields measured and computed at 65%R with the clean blade at θ = 11.2° is shown in Fig. 11. The contour of the measured phase-averaged horizontal velocity component u shows an an agreement that, overall, is quite good with respect to the CFD solution with the only exception of the thin aerofoil wake region. This discrepancy could be related to the resolution of the PIV measurement, that is insufficient to describe the velocity defect in the very thin wake region close to the aerofoil trailing edge. This feature produces an evident effect, especially in the calculation of the horizontal component of the sectional force. Figure 12 shows the comparison of the pressure extracted on the integration boundary on the same blade section and test condition to illustrate the effect of pressure reconstruction on the sectional airloads calculation. Pressure reconstructed from PIV data using isentropic relations reproduces the behaviour of the computed pressure well. Appreciable differences occur along the right edge of the integration boundary, thus producing a further source of discrepancy, particularly for the calculation of the sectional horizontal force component.
Comparison of the PIV and CFD velocity fields on the blade section at 65%R for θ = 11.2°, Re ∞ = 7.3 × 10⁵, M ∞ = 0.349.

Pressure comparison on the contour of the control surface on the blade section at 65%R for θ = 11.2°, Re ∞ = 7.3 × 10⁵, M ∞ = 0.349.

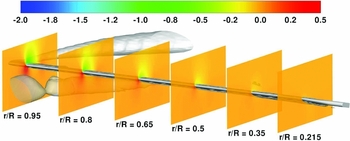
The comparison between the sectional airloads calculated using the CoV approach on the numerical data extracted on 2D blade sections and the airloads distribution extracted from the complete 3D numerical solution clearly shows that the proposed method is capable to evaluate the vertical force along the whole blade span with a good level of accuracy (see Fig. 10). On the other hand, a lower degree of accuracy was found in the calculation of the sectional horizontal force component on all the considered blade sections. In particular, an increase of the discrepancies of the horizontal forces calculated by the CoV approach with respect to the values extracted directly from the 3D CFD solution was found moving towards the blade-tip section. In particular, discrepancies below 10% were found for the horizontal forces computed by the CoV approach up to the blade section at 65%R, while the highest differences with respect to the 3D CFD solution were found at 95%R section. In fact, the flow field in the outer region of the blade is highly 3D, as it is influenced by the tip vortices issued by the preceding blade and by the blade itself. This flow behaviour can be clearly observed in Fig. 13, which shows the iso-surface of q-criterion(Reference Hunt, Wray and Moin33) calculated from the results of the CFD simulation at θ = 11.2°. Thus, the 2D flow model used in the CoV formulation is not suitable to obtain an accurate result for the evaluation of the outboard blade sectional loads. In particular, the contribution to the estimation of sectional airloads related to the out-of-plane velocity component can be expected to be particularly apparent at the wake region due to the 3D flow structures issued by the blades at the tip region. Thus, the simplification of a 2D CoV approach negatively influences mainly the estimation of the sectional horizontal force component, as previously discussed for the comparison of the results obtained at 65%R.
Contours of the pressure coefficient Cp computed by CFD simulation at θ = 11.2° on different span-wise blade section and isosurface of q-criterion(Reference Hunt, Wray and Moin33), qcrit = 0.8.

Thus, the previous discussion showed that for the investigated hovering test conditions, the proposed simplified methodology, based on the use of 2D PIV data only, provides an estimation of the sectional loads with a good level of accuracy up to 65%R. In particular, as previously mentioned, the accuracy obtained on this blade section is comparable to the one obtained in similar works where a more complex approach is used for pressure determination(Reference Ragni, van Oudheusden and Scarano22). This method, based on simple 2D velocity surveys, is therefore a simple and effective tool for the estimation of the load distribution on non-conventional rotor blade configurations in hovering, as in the current investigation. Indeed, in order to obtain a similar degree of accuracy of the estimated airloads from CFD results, the numerical analysis would require a very large effort related to the need of accurately reproducing the details of the 3D complex blade shape equipped, as in the present case, with very small flaps.
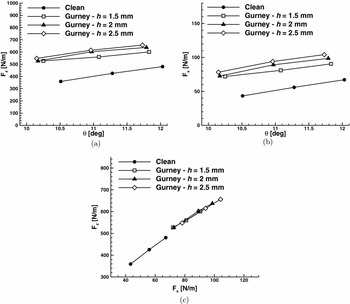
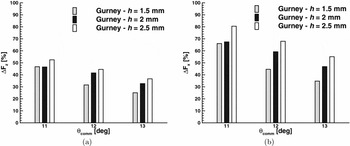
The vertical and horizontal aerodynamic forces calculated from PIV data for the investigated blade section at 65%R equipped with the different Gurney flaps are compared in Fig. 14 with the ones calculated for the clean blade section geometry. As it can be clearly observed from the curves behaviour, the Gurney flaps introduce an apparent increase of the vertical and horizontal force with respect to the clean blade section aerofoil for all tests conditions. A quantitative analysis of the effect of Gurney flaps is reported in Fig. 15, where the percentual differences between the sectional airloads evaluated with the Gurney flaps and the ones evaluated with the clean geometry are shown for all test conditions considered for PIV surveys.
Comparison of the vertical and horizontal forces calculated from PIV data on the blade section at 65%R equipped with Gurney flaps, Re ∞ = 7.3 × 10⁵, M ∞ = 0.349.

Effect of the Gurney flaps on the vertical and horizontal forces calculated from PIV data on the blade section at 65%R equipped with Gurney flaps: percentual differences of the sectional airloads with respect to the clean blade geometry, Re ∞ = 7.3 × 10⁵, M ∞ = 0.349.

In accordance with the trend of the global rotor thrust and torque measured for the same test conditions (see Fig. 5), the bar chart clearly shows that the higher the Gurney flap, the larger the sectional aerodynamic loads increase. Moreover, increasing the blade pitch angle, the effect of Gurney flaps in terms of sectional airloads increment decreases. In particular, for the flap with maximum height (h = 2.5mm) a mean increase of about 45% and 67%, respectively, of the vertical and horizontal aerodynamic forces was evaluated considering the three blade pitch angles investigated by PIV surveys. The effects of Gurney flaps evaluated on sectional loads are quite in agreement with the results of numerical simulations performed by Yee et al(Reference Yee, Joo and Lee11), reproducing rotor operating flow conditions for the same NACA 0012 aerofoil and with the experimental results described by Maughmer and Bramesfeld(Reference Maughmer and Bramesfeld14) for a steady aerofoil application, thus confirming the confidence on the present results obtained using the control volume approach on 2D PIV data.
In order to evaluate the aerodynamic efficiency of the considered aerofoil section, defined as the ratio between the lift and the drag, the knowledge of the actual angle-of-attack including the induced velocity effect is necessary. On the other hand, the efficiency as blade section in hovering is more properly indicated by the ratio between the vertical and horizontal aerodynamic forces. From the plot in Fig. 14(c), representing the calculated vertical forces versus the horizontal ones for the considered test conditions, it is apparent that the continuation of the clean curve stays below the flapped ones, confirming the integral effect in terms of FM increase observed in Fig. 5(c) at these test conditions.
4.0 CONCLUSIONS
An experimental activity was performed to investigate the effectiveness of Gurney flaps on the aerodynamic performance of a helicopter rotor in hovering. The tests were carried out on a fully articulated rotor model with blades equipped with three Gurney flap configurations with different height. The measurements of the global aerodynamic loads showed a consistent increase of the rotor thrust with Gurney flaps even if they only span 14% of the rotor radius. Moreover, at high CT , all of the tested Gurney flap configurations introduce an important benefit for rotor performance, consisting of an evident increase of the rotor figure of merit.
The test campaign also included 2D PIV surveys carried out around the blade section at 65% of the rotor radius. The local velocity data was used to complete the characterisation of the blade performance with and without Gurney flaps by evaluating the sectional aerodynamic loads. With this aim, the compressible Navier-Stokes momentum equation was integrated following the control volume approach, where pressure on the integration contour was reconstructed from the measured local velocity using the isentropic relation. The accuracy of the employed methodology for the evaluation of sectional loads was assessed by comparison with the results of a high-accuracy 3D CFD simulation of the rotor clean geometry. The availability of numerical results enabled the investigation of the limits and robustness of the proposed method for the evaluation of the load distribution along the blade span. This assessment indicated that, for the investigated hovering conditions, a good level of accuracy can be obtained from the root up to 65%R using this simplified methodology, based on the use on 2D PIV data only. Thus, the sectional forces evaluated with the present method provide a quantitative analysis of the remarkable increase of the local aerodynamic loads thanks to the three Gurney flaps tested with respect to the clean blade geometry. In particular, the behaviour of the vertical and horizontal sectional forces resumes the same trend shown by the global thrust and torque measurements. Indeed, the effect of the Gurney flap decreases when the blade pitch angle increases.
The present results provide a thorough experimental assessment of Gurney flaps capabilities for rotor performance enhancement and represent an interesting database to be used for the validation of CFD simulations, widely performed for the investigation of such rotor configurations.
ACKNOWLEDGEMENTS
The research leading to these results has received funding from the European Community’s Seventh Framework Programme (FP7/2007-2013) for the Clean Sky Joint Technology Initiative under grant agreement n. 298192.