



1 Introduction
Axially convected swirling flows are known to exhibit abrupt changes in spatial structure characterized by the development of an internal stagnation point, referred to as vortex breakdown (Leibovich Reference Leibovich1978). Vortex breakdown (VB) has been observed or utilized in a variety of situations including flow over delta wings (Mitchell & Delery Reference Mitchell and Delery2001), tornadoes (Rotunno Reference Rotunno2013), cylinders with rotating end walls (Escudier Reference Escudier1984), swirling flows in tubes (Sarpkaya Reference Sarpkaya1971), turbomachinery (Escudier Reference Escudier1987) and combustors (Syred & Beer Reference Syred and Beer1974; Lilley Reference Lilley1977). Although VB has been recognized as an important phenomenon of both fundamental and practical interest, and studied extensively, a comprehensive understanding and consensus on its underlying mechanisms seem to be lacking.
Flows where VB is observed include swirling jets. In this study, the phrase ‘swirling jet’ is used in a restrictive sense, denoting the core region of a swirling round jet surrounded by non-swirling and negligible coflow. These flows have been investigated primarily in the turbulent regime, motivated by applications towards swirl-stabilized combustors (Chigier & Chervinsky Reference Chigier and Chervinsky1967; Oberleithner et al. Reference Oberleithner, Sieber, Nayeri, Paschereit, Petz, Hege, Noack and Wygnanski2011). In contrast, they remain relatively less explored in the laminar regime, although, as will be elaborated next, experimental investigations have shown distinct and intriguing aspects of VB unique to these flows (Billant, Chomaz & Huerre Reference Billant, Chomaz and Huerre1998). While systematic numerical studies of VB in other families of swirling flows exist, a similar investigation on swirling jets has not been carried out. Scrutiny of various states observed for this simple flow might aid in enriching our understanding of VB mechanisms. This serves as motivation for the present numerical investigation of VB in swirling jets.
Prevalent forms of VB that occur in most swirling flows include the bubble (BVB) and spiral (SVB) forms, although others have also been identified (Faler & Leibovich Reference Faler and Leibovich1977). In dye visualizations, BVB is characterized by the presence of an approximately ellipsoidal recirculation zone (bubble) with a size of the order of the vortex core radius. In most open flows, BVB is generally accompanied by the presence of an unsteady spiral structure in the bubble’s wake, which has a negligible effect on the bubble’s structure (see Sarpkaya Reference Sarpkaya1971, figure 5b). This state is referred to here as ‘BVB with a spiral tail’. SVB is identified in experiments when a dye filament injected along the swirl axis experiences a kink, downstream of which it assumes a spiral structure (see Sarpkaya Reference Sarpkaya1971, figure 3b). Historically classified as a separate form of VB, later studies, starting with that of Brücker (Reference Brücker1993), indicated that SVB shares qualitatively similar structural features with BVB implying that SVB might not be a distinct form of VB.
Billant et al. (Reference Billant, Chomaz and Huerre1998) carried out a detailed experimental investigation of laminar swirling jets which included the first identification of a distinctly different form of breakdown, referred to here as the conical form of VB (CVB). The jet was found to expand radially downstream of the stagnation point for a considerable distance as a thin conical sheet with a large opening angle (
 ${\approx}90^{\circ }$
) encompassing an enormous recirculation zone before eventually converging back. Interestingly, Billant et al. (Reference Billant, Chomaz and Huerre1998) further inferred that BVB and CVB are possible bistable states that coexist for an overlapping range of flow parameters. SVB was not reported in these experiments, although new asymmetric types of BVB and CVB were observed at higher Reynolds numbers. Additionally, for lower swirls where VB was not observed (pre-breakdown swirls), the swirling jet was found to destabilize due to helical modes of azimuthal wavenumber two or three.
Dye visualizations and the parameter ranges of existence of CVB were documented in Billant et al. (Reference Billant, Chomaz and Huerre1998), while axial velocity and azimuthal vorticity fields for a single case were reported in Gallaire, Rott & Chomaz (Reference Gallaire, Rott and Chomaz2004). Experiments on the effect of buoyancy on swirling jets due to imposed temperature differences between jet and ambient fluid were reported in Mourtazin & Cohen (Reference Mourtazin and Cohen2007). In addition to the previously observed BVB and CVB, they identified a ‘wide-open’ cone, where the thin sheet spreading conically downstream of the stagnation point was found to curve away from the swirl axis and, beyond a short radial extent, to expand almost perpendicularly. For a different flow configuration of coaxial swirling jets, Santhosh & Basu (Reference Santhosh and Basu2015) reported CVB to occur as an intermediary state between two types of BVB. CVB has also been observed in axisymmetric numerical simulations of swirling jets by Fitzgerald, Hourigan & Thompson (Reference Fitzgerald, Hourigan, Thompson, Behnia, Lin and McBain2004).
Few other studies seem to have identified CVB, although features resembling this form can be inferred in some. Interestingly, for swirl burners, overlapping regimes of flows associated with two different flame types discussed in Syred & Beer (Reference Syred and Beer1974, p. 190) closely resemble bistable states of BVB and CVB. Simulations of isothermal annular swirling jets by Ogus, Baelmans & Vanierschot (Reference Ogus, Baelmans and Vanierschot2016) also exhibit these features, with hysteresis being reported for cone-like and bubble states. However, the presence of a conically expanding nozzle in such burner configurations has confounded conclusions based on these results. Gore & Ranz (Reference Gore and Ranz1964) noted a case where swirling jets expanded at right angles to their axis at high swirl strengths, a behaviour similar to the wide-open CVB (§ 4.2.3). For the case of swirling jets with velocity profiles similar to those employed in the present study, but for higher Reynolds numbers, Liang & Maxworthy (Reference Liang and Maxworthy2005) reported cases of VB where an approximately conical sheet can be discerned, although it is obscured by the onset of turbulence in the recirculation region.
Being a form of VB, the conical state can also be used as a means of re-examining and assessing theories that have been previously proposed towards understanding physical mechanisms that govern VB. Substantial research has been devoted towards elucidating these mechanisms by means of diverse standpoints, as outlined in a variety of reviews (Hall Reference Hall1972; Leibovich Reference Leibovich1978, Reference Leibovich1984; Escudier Reference Escudier1988; Althaus, Brücker & Weimer Reference Althaus, Brücker, Weimer and Green1995). Two of these have been assessed in this study and are introduced next. The wave-propagation approach was initiated by Squire (Reference Squire1960) (see Escudier Reference Escudier1988, p. 218) who proposed that vortex breakdown might serve as an interphase between regions of flow that do (subcritical) and do not (supercritical) support infinitesimal standing waves. This was extended by Benjamin (Reference Benjamin1962, Reference Benjamin1967) as a finite-amplitude transition to a conjugate state (supercritical to ‘adjacent’ subcritical state) analogous to hydraulic jumps. Alternatively, Brown & Lopez (Reference Brown and Lopez1990), using assumptions of steady axisymmetric inviscid flow, showed that the development of negative azimuthal vorticity could lead to stagnation point formation along the axis.
The possibility of scrutinizing intricate features of VB non-intrusively has motivated numerous studies that employ numerical simulations. Kopecky & Torrance (Reference Kopecky and Torrance1973) and Grabowski & Berger (Reference Grabowski and Berger1976) were among the first to simulate BVB assuming steady, axisymmetric flow. Ruith et al. (Reference Ruith, Chen, Meiburg and Maxworthy2003) carried out an extensive numerical study of VB using both axisymmetric and three-dimensional simulations employing the same steady inflow profile as Grabowski & Berger (Reference Grabowski and Berger1976), referred to as the ‘Grabowski profile’, and were able to observe most features of VB reported in experiments. To examine the effects of lateral boundary conditions on VB, Ruith, Chen & Meiburg (Reference Ruith, Chen and Meiburg2004) carried out simulations for the same inflow profile and additionally, another that modelled swirling jets, referred to as the ‘Maxworthy profile’. They observed BVB in their simulations for both profiles, but no CVB. To investigate various flow states reported in experiments of Billant et al. (Reference Billant, Chomaz and Huerre1998), the latter profile was chosen for further scrutiny in this study. While for the Grabowski profile, the azimuthal component of velocity resembles a Rankine vortex and the axial component is generally chosen as uniform everywhere at the inflow plane, the Maxworthy profile consists of a core region of uniform axial vorticity and velocity components surrounded by an almost quiescent region, with a shear layer present in between. Comparisons will be made between the BVB states observed in the present study and that seen for the Grabowski profile.
The objective of this study was to explore VB in swirling jets by means of three-dimensional unsteady numerical simulations employing the Maxworthy inflow profile, which appropriately models such flows. Specifically, detailed flow structure, dependence on control parameters, instability mechanisms and assessments of two theories for VB are reported. All simulations, unless otherwise mentioned, were carried out using a so-called streamwise-invariant ‘columnar’ initial condition. Hysteresis and bistability aspects of VB in laminar swirling jets have also been investigated, but will be reported elsewhere for the sake of conciseness. Occasional references to this study are made where required (see § 4.3).
Section 2 describes details of flow simulations and the stability analysis. Validation of the numerical solver for swirling flows using previous results is reported in § 3, and additionally in appendix C. Next, various long-time states of flow are distinguished and documented as swirl is varied for columnar initial conditions in § 4. A helical instability observed in the simulations is further examined using the tools of stability analysis in § 5. This is followed by an analysis of solutions from the perspective of theories proposed to explain VB in § 6. Discussions on concerns regarding employing steady inflow profiles, comparisons with experiments, pre-breakdown flow characteristics and some additional features of global modes are in the appendices.
2 Methodology
2.1 Numerical simulations
Numerical simulations were carried out using incompact3d (Laizet & Li Reference Laizet and Li2011), a scalable, open-source flow solver capable of direct numerical simulations of incompressible Navier–Stokes equations. Derivative computation and interpolation are carried out using sixth-order, compact finite difference schemes. Poisson’s equation for enforcing incompressibility is solved using spectral methods. A third-order low-storage Runge–Kutta scheme is employed for time stepping. A three-dimensional Cartesian grid with uniform grid spacing is used with partial staggering i.e. collocated velocity components stored at cell vertices and pressure at cell centres. A pencil-type domain decomposition strategy is employed by the solver for MPI parallelization. Further details can be found in Laizet & Lamballais (Reference Laizet and Lamballais2009), Laizet & Li (Reference Laizet and Li2011) and Lamballais, Fortuné & Laizet (Reference Lamballais, Fortuné and Laizet2011). All simulations were carried out on SahasraT, a Cray XC40 system. A typical simulation with a mesh size of
 $241\times 240\times 240$
and a dimensionless duration
 $t=5000$
(see § 2.1.1) required around 24 hours when 480 processors were employed.
2.1.1 Inflow profile
The inflow condition is chosen as the Maxworthy profile (Ruith et al.
Reference Ruith, Chen and Meiburg2004) which models a swirling jet. This steady profile is dependent on three parameters: swirl number
 $S$
, jet-to-coflow axial velocity ratio
 $\unicode[STIX]{x1D6FC}$
and
 $\unicode[STIX]{x1D6FF}$
, representing the shear layer thickness. In cylindrical coordinates,
 $$\begin{eqnarray}\displaystyle \left.\begin{array}{@{}l@{}}\displaystyle u_{\unicode[STIX]{x1D703}}(r)=\frac{Sr}{2}\left(1-\text{erf}\left(\frac{r-1}{\unicode[STIX]{x1D6FF}}\right)\right),\\[10.0pt] \displaystyle u_{r}(r)=0,\\ \displaystyle u_{x}(r)=1-\frac{\unicode[STIX]{x1D6FC}-1}{2\unicode[STIX]{x1D6FC}}\left(1+\text{erf}\left(\frac{r-1}{\unicode[STIX]{x1D6FF}}\right)\right).\end{array}\right\} & & \displaystyle\end{eqnarray}$$
Here
 $r$
is the radial distance from the jet axis, and
 $u_{r}$
,
 $u_{\unicode[STIX]{x1D703}}$
and
 $u_{x}$
are the radial, azimuthal and axial components of velocity, respectively. Figure 1 shows radial profiles
 $u_{x}(r)$
and
 $u_{\unicode[STIX]{x1D703}}(r)$
for various
 $S$
,
 $\unicode[STIX]{x1D6FC}$
and
 $\unicode[STIX]{x1D6FF}$
. The profiles are in a dimensionless form with all distances and velocities scaled by jet radius and axial centreline velocity respectively. The Reynolds number
 $Re$
used in the simulations is based on these scales.
(a) Axial and (b) azimuthal velocity components of Maxworthy profile, modelling a swirling jet: ——,
 $S=1.5$
,
 $\unicode[STIX]{x1D6FF}=0.2$
,
 $\unicode[STIX]{x1D6FC}=100$
; - - - -,
 $S=1.5$
,
 $\unicode[STIX]{x1D6FF}=0.3$
,
 $\unicode[STIX]{x1D6FC}=1000$
; — ⋅ —,
 $S=1$
,
 $\unicode[STIX]{x1D6FF}=0.1$
,
 $\unicode[STIX]{x1D6FC}=10$
.

For small values of
 $\unicode[STIX]{x1D6FF}$
,
 $S$
is the slope of the azimuthal velocity at
 $r=0$
. Although more sophisticated definitions of swirl number have been employed previously, this definition was chosen for convenience. Here,
 $\unicode[STIX]{x1D6FF}$
was set as 0.2,
 $\unicode[STIX]{x1D6FC}=100$
signifying a coflow strength of 1 %. Reynolds number based on scales used in the profile was fixed at
 $Re=200$
. The model for inflow was inadvertently implemented in the flow solver such that the jet swirled in the clockwise direction implying that
 $S$
is negative (2.1). Without loss of generality, this negative sign has been ignored when reporting values of
 $S$
.
Steady inflow conditions have been often used for VB simulations (e.g. Ruith et al.
Reference Ruith, Chen, Meiburg and Maxworthy2003), although their validity is questionable when VB occurs close to the inflow plane (see discussion in appendix A. Most flow states reported for swirling jets in Billant et al. (Reference Billant, Chomaz and Huerre1998) were observed here, strengthening the validity of the qualitative aspects of simulated states. The experimentally measured inflow profiles in Billant et al. (Reference Billant, Chomaz and Huerre1998) differ from the Maxworthy profile due to the use of convergent nozzles. This and other comparisons with experimental studies are discussed in appendix B. Incidentally, one of the profiles used by Healey (Reference Healey2008) to study stability characteristics of swirling jets is the same as that used here when coflow is ignored i.e.
 $\unicode[STIX]{x1D6FC}\rightarrow \infty$
.
2.1.2 Coordinate system, boundary and initial conditions
Solutions of the Navier–Stokes equations were computed in a Cartesian coordinate framework
 $(x,y,z)$
, where
 $x$
is the streamwise direction, and
 $y$
and
 $z$
are lateral directions in rectangular domains. Incidentally, the tank used by Billant et al. (Reference Billant, Chomaz and Huerre1998) for their experiments was of square cross-section. In this study, two cases of possibly spurious features involving the generation of helical structures of azimuthal wavenumber
 $|m|=4$
were observed that might be related to the choice of coordinate system. The first occurred for pre-breakdown swirls (appendix D), where no VB was observed, and the other was seen for very high swirls (§ 4.2.3), where the position of VB was too close to the inflow plane for reliable results. Neither case is a major focus of this study. Nevertheless, qualitative features reported in experiments for these flow states were observed here, implying that these structures do not strongly affect other aspects of the flow.
A periodic boundary condition is enforced on the lateral boundaries of the Cartesian grid, primarily for convenience, while the outlet is treated as a convecting outflow boundary. Periodic lateral boundaries are found to function similar to free-slip conditions and can introduce confinement effects if the domain dimensions are not chosen appropriately. Ruith et al. (Reference Ruith, Chen and Meiburg2004) have shown that for a cylindrical domain, when free-slip conditions were applied, the flow developed a weak recirculation zone at the outflow boundary in the coflow region. However, this does not seem to have affected VB characteristics. Care is taken in the present simulations to extend the domain along lateral directions when required, such that flow regions of interest remain qualitatively unaffected by these boundaries. This is discussed in § 2.1.3.
All simulations employ what is referred to here as the ‘columnar’ initial condition, with the swirling jet inflow profile imposed at all streamwise positions in the domain.
2.1.3 Domain and grid dimensions
In the present study, three grids on domains of different dimensions referred to as D20, D40 and D80 were used, details of which are listed in table 1. As will be described in detail in the following sections, three types of BVB and two types of CVB have been identified as
 $S$
was varied. Except for the pulsating BVB, D20 was found to be adequate for capturing all qualitative features of BVB including the stability characteristics of the flow close to criticality. For these cases, the maximum differences between steady and time-averaged long-time solutions obtained for different
 $S$
were approximately
 $1$
%. Thus, all descriptions reported here of these cases are based on results obtained using D20. For pulsating BVB, although the pulsating nature of the flow was captured in the simulations on D20, the streamwise extent was found to be insufficient and only solutions obtained on D40 are reported. Additionally, D40 was used for cases involving low pre-breakdown swirls, where helical modes developed at streamwise distances of
 $x\approx 20$
. For CVB, the radial expansion of the jet into a laterally extended conical sheet necessitated further increase in the lateral dimensions to that of D80. Even this lateral extent of D80 seems to be insufficient in preventing interactions of the flow with boundaries for the case of the wide-open cone, as will be discussed in § 4.2.3. Further details of studies on domain effects can be found in Pradeep (Reference Pradeep2019).
Details of various grids used including name, domain dimensions (
 $L_{x}\times L_{y}\times L_{z}$
), number of grid points (
 $n_{x}\times n_{y}\times n_{z}$
) and step size (
 $\unicode[STIX]{x1D6E5}$
) used.

Grid clustering was not employed in the simulations. While clustering can be advantageous in scrutinizing features of BVB in the bubble region, it does not offer an advantage in the case of CVB. All simulations except grid convergence studies employed a uniform grid spacing in all directions of
 $\unicode[STIX]{x1D6E5}=1/12$
. For this grid resolution, the time step
 $\unicode[STIX]{x0394}t=0.01$
.
2.1.4 Tracer visualization
Routines to track the convection of massless tracer particles for visualizing flow features were added to the flow solver. Positioned initially at the inflow plane, updated positions of these tracers, were calculated by the Euler method. Velocity at the particle positions was calculated using trilinear interpolation. Tracer computations were initiated after the flow had settled into a sustained long-time state with a set of particles (one at radial position
 $r=0$
and eight at equiangular positions with
 $r=0.1$
) released from inflow boundary at regular time intervals
 $\unicode[STIX]{x0394}t=0.5$
apart.
2.2 Local and global stability analyses
Instabilities that arise in the simulations for BVB were further examined by means of local and global stability analyses. The framework of the Wentzel–Kramers–Brillouin–Jeffreys (WKBJ) approximation for weakly non-parallel flows was utilized to examine global features from the former. The methodology adopted for the local analysis follows that in Huerre & Monkewitz (Reference Huerre and Monkewitz1990) and Chomaz, Huerre & Redekopp (Reference Chomaz, Huerre and Redekopp1991). Details on numerical implementation are elaborated in Manoharan et al. (Reference Manoharan, Hansford, O’ Connor and Hemchandra2015) and briefly described next. Some additional aspects are also provided in appendix E.
The base flow quantities,
 $\boldsymbol{Q}(x,r)=[U_{x}\;\;U_{r}\;\;U_{\unicode[STIX]{x1D703}}\;\;P]^{\text{T}}$
, in cylindrical coordinates, were extracted from the corresponding numerical results in the
 $y=0$
plane (Cartesian system). For cases where the base state is unstable, the ‘selective frequency damping’ approach proposed in Åkervik et al. (Reference Åkervik, Brandt, Henningson, Hœpffner, Marxen and Schlatter2006) was employed to suppress the instability and achieve steady solutions, details of which are provided in Pradeep (Reference Pradeep2019). A Chebyshev expansion was used for all variables and their derivatives and a family of mappings suggested by Bayliss & Turkel (Reference Bayliss and Turkel1992) was chosen to transform the grid points to cluster near the axis of symmetry (
 $r=0$
). Governing equations for linear perturbations,
 $\boldsymbol{q}^{\prime }$
, were derived from the Navier–Stokes equations linearized about the base flow. Far-field boundary conditions were applied at
 $r=L_{y}$
. For the velocity vector and pressure to be single valued on the jet axis, the azimuthal gradient of these quantities must vanish as
 $r\rightarrow 0$
, which yields the required boundary conditions at
 $r=0$
. The perturbations were chosen to be of a normal mode form given by
 $$\begin{eqnarray}\displaystyle \boldsymbol{q}^{\prime }(x,r,\unicode[STIX]{x1D703},t)=\hat{\boldsymbol{q}}(r)\exp [\text{i}(kx+m\unicode[STIX]{x1D703}-\unicode[STIX]{x1D714}t)], & & \displaystyle\end{eqnarray}$$
where
 $\boldsymbol{q}^{\prime }=[u_{x}^{\prime }\;u_{r}^{\prime }\;u_{\unicode[STIX]{x1D703}}^{\prime }\;p^{\prime }]^{\text{T}}$
,
 $k=k_{r}+\text{i}k_{i}$
is the complex axial wavenumber,
 $m$
is the real azimuthal wavenumber and
 $\unicode[STIX]{x1D714}=\unicode[STIX]{x1D714}_{r}+\text{i}\unicode[STIX]{x1D714}_{i}$
is the complex frequency. The discretized form of the equations reduces to a generalized eigenvalue problem
 $$\begin{eqnarray}\displaystyle \unicode[STIX]{x1D63C}\hat{\boldsymbol{q}}=\unicode[STIX]{x1D714}\unicode[STIX]{x1D63D}\hat{\boldsymbol{q}}. & & \displaystyle\end{eqnarray}$$
Spatio-temporal analysis was carried out at all streamwise positions,
 $x$
, to compute the absolute complex frequency
 $\unicode[STIX]{x1D714}_{0}(x)$
and wavenumber
 $k_{0}(x)$
. For this purpose, a grid resolution of
 $n_{r}=90$
radial collocation points was found to be sufficient with a convergence of eigenvalues in the temporal analysis being
 $\unicode[STIX]{x0394}\unicode[STIX]{x1D714}\sim O(10^{-5})$
when the grid was refined to
 $n_{r}=100$
. Convergence to saddle points
 $(k_{0},w_{0}(k_{0}))$
satisfying
 $\text{d}\unicode[STIX]{x1D714}/\text{d}k(k_{0})=0$
, using Newton’s method, was carried out to an accuracy of
 $\unicode[STIX]{x0394}\unicode[STIX]{x1D714}_{0}\sim O(10^{-5})$
. The leading-order estimate from WKBJ theory of the required linear global frequency
 $\unicode[STIX]{x1D714}_{g}$
was computed next (Chomaz et al.
Reference Chomaz, Huerre and Redekopp1991). Assuming a weakly non-parallel flow, a WKB parameter,
 $\unicode[STIX]{x1D716}$
, representing the ratio of instability wavelength and typical length scale of spatial variation, was introduced. A slow-scale variable
 $X=\unicode[STIX]{x1D716}x$
was defined and
 $\unicode[STIX]{x1D714}_{0}(X)$
was computed for
 $X$
in the complex space. The saddle point (
 $\text{d}\unicode[STIX]{x1D714}_{0}/\text{d}X=0$
) closest to the real axis,
 $X=X_{s}$
, was chosen based on contours of
 $\unicode[STIX]{x1D714}_{0,i}(X)$
in a manner similar to that used for computing
 $\unicode[STIX]{x1D714}_{0}(x)$
, yielding
 $\unicode[STIX]{x1D714}_{g}$
.
The global stability analysis was implemented in a fashion similar to that of the local temporal analysis detailed above. The modal decomposition of perturbations for this approach is given by,
 $$\begin{eqnarray}\displaystyle \boldsymbol{q}^{\prime }(x,r,\unicode[STIX]{x1D703},t)=\tilde{\boldsymbol{q}}(x,r)\exp [\text{i}(m\unicode[STIX]{x1D703}-\unicode[STIX]{x1D714}t)], & & \displaystyle\end{eqnarray}$$
which leads to a form as in (2.3) (e.g. Heaton, Nichols & Schmid Reference Heaton, Nichols and Schmid2009). The eigenvalue problem was solved using the Krylov–Schur solver implemented in the SLEPc library (Hernandez, Roman & Vidal Reference Hernandez, Roman and Vidal2005), employing a shift-and-invert spectral transformation. A grid resolution of
 $n_{x}=n_{r}=120$
was sufficient for convergence of the unstable mode to around
 $O(10^{-5})$
. The numerical code has also been successfully employed in analysing other flows, as will be reported in Balakrishna, Mathew & Samanta (Reference Balakrishna, Mathew and Samanta2019).
2.3 Conventions regarding helical modes
Some ambiguity exists in reporting the winding (spatial) and rotation (temporal) sense of helical modes due to the fact that the modal decomposition in (2.2),
 $(k,m,\unicode[STIX]{x1D714})$
can be substituted with sign-reversed complex conjugates
 $(-k^{\ast },-m,-\unicode[STIX]{x1D714}^{\ast })$
without loss of generality (Gallaire & Chomaz Reference Gallaire and Chomaz2003). In the present study,
 $k_{r}$
, is chosen to be positive. Thus, at a given instant, for a spiral isosurface represented by a constant phase
 $(k_{r}x+m\unicode[STIX]{x1D703})$
, and following along the positive
 $x-$
direction, a counter-winding helical mode requires that
 $m>0$
. All modes observed in this study had positive frequencies, implying that
 $m>0$
represents co-rotating modes and vice versa.
3 Validation and convergence studies
Incompact3d has been extensively validated in a wide variety of flow situations (Laizet & Lamballais Reference Laizet and Lamballais2009; Laizet & Li Reference Laizet and Li2011). For the Maxworthy profile with
 $S=1.5$
,
 $\unicode[STIX]{x1D6FC}=100$
,
 $\unicode[STIX]{x1D6FF}=0.2$
and
 $Re=200$
, Ruith et al. (Reference Ruith, Chen and Meiburg2004) have reported results from axisymmetric simulations. These were used to further validate the flow solver for cases involving VB. In the three-dimensional simulations employing D20 (see table 1) carried out in the present study, a helical instability was observed for
 $S=1.5$
which led to a time-periodic long-time flow state. Selective frequency damping (Åkervik et al.
Reference Åkervik, Brandt, Henningson, Hœpffner, Marxen and Schlatter2006) was applied for this case to obtain steady axisymmetric solutions. Figure 2 shows comparisons of this solution with the results of Ruith et al. (Reference Ruith, Chen and Meiburg2004), who imposed ‘radiation’ conditions on lateral boundaries. The recirculation zone in the present study has a slightly larger radius compared to the axisymmetric simulations of Ruith et al. (Reference Ruith, Chen and Meiburg2004). Nevertheless, all qualitative features of the bubble seem to be appropriately represented in the present simulations and the origins of these deviations are not explored further. Interestingly, the core region containing the bubble structurally resembles that obtained for the reference case of the Grabowski profile studied by Ruith et al. (Reference Ruith, Chen, Meiburg and Maxworthy2003), indicating that the inflow velocity profile outside the core might not play a significant role in influencing core structure of axisymmetric BVB.
Comparison of (a) projected streamlines, (b) axial velocity at
 $x=2$
and (c) radial velocity at
 $r=1$
for steady solutions,
 $S=1.5$
,
 $\unicode[STIX]{x1D6FC}=100$
,
 $\unicode[STIX]{x1D6FF}=0.2$
and
 $Re=200$
: ——, three-dimensional simulations, present study; ○, axisymmetric simulations, Ruith et al. (Reference Ruith, Chen and Meiburg2004).

Three-dimensional features of flows involving VB are available only for the Grabowski profile and are used to further validate the solver in appendix C. Validations for both local and global stability analyses are also given in the same.
Comparison of temporal variations in (a) maximum magnitude of change in velocities
 $\boldsymbol{u}(t)$
and
 $\boldsymbol{u}(t+\unicode[STIX]{x1D6FF}t)$
between two instants
 $t$
and
 $t+\unicode[STIX]{x1D6FF}t$
for the entire domain and (b) axial velocity at position
 $x=6$
,
 $y=0.5$
and
 $z=0$
, for
 $S=1.5$
,
 $\unicode[STIX]{x1D6FC}=100$
,
 $\unicode[STIX]{x1D6FF}=0.2$
and
 $Re=200$
for grids: ——,
 $241\times 240\times 240$
(D20); - - - -,
 $481\times 480\times 480$
(refined).

To check if all physical features of the flow are grid independent, simulations were carried out on a refined grid containing twice the number of grid points as D20 (
 $481\times 480\times 480$
and
 $\unicode[STIX]{x1D6E5}=1/24$
) for the same choice of
 $S$
and other parameters as before. The time step was halved for the refined grid to
 $\unicode[STIX]{x0394}t=0.005$
. Figure 3(a) shows the temporal variation of maximum magnitude of velocity change over the entire domain during intervals of
 $\unicode[STIX]{x1D6FF}t=0.5$
for the two grids. Incidentally, it can be inferred from this plot that the flow evolves towards a steady state with changes in velocity reducing exponentially to low values in the approximate interval
 $500\leqslant t\leqslant 1000$
, before an increase representing instability growth is observed. The intermediate state of flow immediately prior to instability growth has been referred to as a ‘quasi-steady state’ (Ruith et al.
Reference Ruith, Chen, Meiburg and Maxworthy2003). The initial evolution of the flow towards this state is the same for both cases, but the time of onset of instabilities is earlier for the refined grid (
 $t_{QS}\approx 1100$
) compared to that of D20 (
 $t_{QS}\approx 1290$
). Figure 3(b) shows variations in axial velocity with time at a position of
 $x=6$
,
 $y=0.5$
and
 $z=0$
. Due to the delay in the onset of instabilities, a phase shift can be seen in the figure, although time periods remain the same for both grids. Differences in maxima and minima of the oscillations observed for the two cases are 0.27 % and 0.7 %, respectively. Similar observations were made by Ruith et al. (Reference Ruith, Chen, Meiburg and Maxworthy2003) for the Grabowski profile, who reported a phase shift in solutions between two different grids and attributed this to grid-dependent round-off errors that are amplified by the instability. As can be observed from the figures, instability growth rate, saturation amplitude and frequency agree well and thus the grid D20 is assumed to be sufficient for the present investigation.
4 Sustained states of flow
A description is given next of all long-time flow states observed in this low Reynolds number study, when the swirl number
 $S$
is changed, with the remaining control parameters fixed (
 $\unicode[STIX]{x1D6FC}=100$
,
 $\unicode[STIX]{x1D6FF}=0.2$
and
 $Re=200$
). Solutions were taken to be steady when the maximum magnitude of velocity change over the entire domain in an interval of
 $\unicode[STIX]{x1D6FF}t=0.5$
, remained at a value of
 $O(10^{-12})$
. Below a critical swirl of
 $S_{c}=1.39$
, pre-breakdown helical structures and swelling without a stagnation point were observed. At
 $S_{c}$
, a stagnation point developed signalling the onset of VB. The flow stabilized into steady axisymmetric BVB for
 $S\in [1.4,1.48]$
. BVB with an unsteady spiral tail was observed for the range
 $S\in [1.49,1.5]$
. For
 $S\in [1.55,1.57]$
, a pulsating BVB was identified. CVB occurred for
 $S\in [1.58,1.6]$
. At
 $S=2$
, a wide-open CVB was present.
As noted previously, there were numerical issues in simulating pre-breakdown swirls and this study does not focus on this swirl range. However, since some interesting features were observed here, including the ‘trident’ structure reported in Billant et al. (Reference Billant, Chomaz and Huerre1998), a brief description of these flow states is presented in appendix D.
4.1 Bubble form of vortex breakdown
Three types of BVB were observed as
 $S$
was increased, including steady BVB, BVB with spiral tail and pulsating BVB. Properties of these flows are discussed next.
4.1.1 Route to stagnation and steady axisymmetric BVB
Figure 4(a) shows an axisymmetric steady swelling that develops centred about
 $x=5$
for a pre-breakdown swirl of
 $S=1.38$
. Billant et al. (Reference Billant, Chomaz and Huerre1998) have not reported the presence of a swelling and Leibovich (Reference Leibovich1978) noted, from early experiments, that swellings are most likely ephemeral features that disappear within a short time and considered them to be spurious artefacts in axisymmetric simulations. However, close to the threshold of VB, the occurrence of such swellings in the core region, as precursors to VB, has been observed in simulations using the Grabowski profile (Grabowski & Berger Reference Grabowski and Berger1976; Ruith et al.
Reference Ruith, Chen, Meiburg and Maxworthy2003). It should be noted that the theory of Benjamin (Reference Benjamin1967) predicts the existence of such swellings, while Oberleithner et al. (Reference Oberleithner, Paschereit, Seele and Wygnanski2012) reported observing a local positive minimum in the time-averaged velocity along the jet axis for pre-breakdown swirls in the case of turbulent swirling jets, suggesting a swelling’s presence. In experiments on flows in cylinders with rotating end walls, Escudier (Reference Escudier1984) noted an ‘hour-glass structure’ that appears for swirls slightly lower than that at which VB occurs. Wang & Rusak (Reference Wang and Rusak1997) have noted, based on previous results, that a continuous transition to VB with increasing swirl, by means of a swelling, would likely occur only below a critical Reynolds number.
Projected streamlines on meridional plane for (a) pre-breakdown swelling at
 $S=1.38$
and (b) steady BVB at
 $S=1.4$
.

For
 $S>S_{c}$
, the stagnation point moves upstream with increasing swirl, while a bubble is formed downstream (figure 4
b). The bubble observed here is commonly described as one celled, similar to those observed in experiments of Brücker & Althaus (Reference Brücker and Althaus1992) and simulations of Ruith et al. (Reference Ruith, Chen, Meiburg and Maxworthy2003), and is named so due to the presence of a single toroidal vortical structure. Billant et al. (Reference Billant, Chomaz and Huerre1998) have reported a single case which shows velocity fields for BVB (figure 7) with what is possibly a two-celled structure (Faler & Leibovich Reference Faler and Leibovich1978). It is noted that a sustained two-celled bubble occurred at higher swirls in hysteresis studies (§ 4.3), which will be reported elsewhere.
4.1.2 BVB with spiral tail
Starting from
 $S=1.49$
, the flow evolved towards an axisymmetric quasi-steady state containing a bubble but succumbed to helical instabilities leading to the eventual appearance of a spiral structure (
 $m=+1$
) in the bubble’s wake which rotates about the jet axis at a constant frequency. Thus, an increase in
 $S$
induces a transition from a steady flow to one which is periodically unsteady, indicating a supercritical Hopf bifurcation. The onset of breakdown at lower swirls than that above which the helical instability arises, has been noted for turbulent swirling jets by Oberleithner et al. (Reference Oberleithner, Paschereit, Seele and Wygnanski2012), who inferred the same trend to hold in the laminar regime based on the observations reported in Liang & Maxworthy (Reference Liang and Maxworthy2005). Additionally, a similar behaviour has been confirmed for the Grabowski profile in Meliga, Gallaire & Chomaz (Reference Meliga, Gallaire and Chomaz2012). However, Loiseleux & Chomaz (Reference Loiseleux and Chomaz2003) have noted the development of a single helical mode for pre-breakdown swirls in their studies on swirling jets.
Meridional projections of (a) positions of tracers released from
 $r=0$
and
 $r=0.1$
at
 $t=100$
and (b) pathlines of tracers released from
 $r=0$
for the case of
 $S=1.5$
, outlining a bubble envelope unaffected by instability and the presence of a spiral tail downstream.

Features of this type of BVB are described using a typical case of
 $S=1.5$
. The long-time spatial structure for this case is visualized by means of tracer particles at a given instant as shown in figure 5(a). The figure clearly outlines the spiral structure of
 $m=+1$
embedded in the wake (approximately
 $x\geqslant 4$
), while the bubble remains axisymmetric and unaffected by the spiral. These visualizations form the basis for referring to this type as BVB with a spiral tail (see also Sarpkaya Reference Sarpkaya1971, figure 5b). This is qualitatively different from most cases studied using Grabowski’s profile (Ruith et al.
Reference Ruith, Chen, Meiburg and Maxworthy2003; Meliga et al.
Reference Meliga, Gallaire and Chomaz2012), where instability growth was observed over the entire bubble region, with the bubble and the stagnation point at its nose affected, a characteristic of SVB. This suggests that the instability features for the two flows might be different. This was confirmed to be the case and will be discussed in § 5.
Projected pathlines based on tracer particles released from the inlet at
 $r=0$
are shown in figure 5(b). The abrupt expansion associated with VB (
 $x\approx 1$
) is vividly captured by this plot. It is evident that the tracers, after navigating over the bubble’s envelope in an axisymmetric fashion, reverse back to enter into it near its downstream end, following which they reside within the bubble for a considerable interval of time. Similar results have been observed in various experiments (e.g. Sarpkaya Reference Sarpkaya1971), where the dye injected at the inlet lingered within the bubble long after the injection was stopped. The streaks finally exited the bubble along a radially narrow region before spiralling outward into the wake, where they take helical paths towards the outflow boundary. The figure confirms that the flow remains axisymmetric in the bubble region. An approximate flow-through time for a particle to exit the domain was
 $150$
, highlighting the significant duration required to traverse the streamwise extent of
 $L_{x}=20$
. Winding of the particles into a helical structure is prominent at a distance of approximately
 $2$
from the downstream end of the bubble. While Billant et al. (Reference Billant, Chomaz and Huerre1998) do not report cases where the spiral is positioned as seen here, experiments in tube-vane arrangements (e.g. Sarpkaya Reference Sarpkaya1971; Faler & Leibovich Reference Faler and Leibovich1978) commonly reveal it to be positioned around one bubble diameter downstream, similar to the present case. Additionally, simulations based on such flow configurations (see Althaus & Weimer Reference Althaus, Weimer, Krause and Gersten1998, figure 11) show a similar structure.
Temporal characteristics of the flow were examined by placing probes at different streamwise positions. Three representative power spectral densities (PSD) of the fluctuating component
 $u_{y}^{\prime }$
at coordinates
 $(x,y,z)$
given by (1, 0, 0), (3, 0, 0.5) and (6, 0, 0.5) are plotted in figure 6(a). The fundamental frequency of
 $f_{0}=0.13$
was the same at all positions, with harmonics strengthening at downstream positions. Figure 6(b) shows contours of vorticity magnitude on a cross-sectional plane at
 $x=10$
at two instants
 $t=3.75$
apart, from which the rotation of the spiral vortex in the bubble’s wake can be inferred.
(a) Power spectral densities of
 $u_{y}$
for the case of
 $S=1.5$
at different positions (
 $x,y,z$
): ——, (6, 0, 0.5); - - - -, (3, 0, 0.5); — ⋅ —, (1, 0, 0). The fundamental frequency is 0.13. (b) Contours of vorticity magnitude,
 $|\unicode[STIX]{x1D734}|$
, on plane
 $x=10$
showing the rotation of an
 $m=+1$
spiral structure’s cross-section at two instances, an interval of 3.75 apart. The inflow swirls clockwise.

4.1.3 Pulsating BVB
For the swirl range of
 $S\in [1.55,1.57]$
, a ‘pulsating’ type of BVB was observed. A representative swirl of
 $S=1.56$
studied using D40 (see table 1) is chosen for further scrutiny of this breakdown type. Past the initial transients and after the flow settled into a state similar to BVB with a spiral tail (
 $m=+1$
), the flow exhibited a peculiar behaviour with a pulsating temporal variation in the flow field. This is best illustrated by examining temporal variations in velocity components at fixed spatial positions in the domain. The time series of
 $u_{x}$
is shown in figure 7(a) at two locations on the flow axis including
 $x=1$
(vicinity of stagnation point) and 5 (wake) and additionally at
 $x=5$
,
 $y=0$
and
 $z=0.5$
. Figure 7 shows PSD of
 $u_{y}$
at the latter location. Variations of
 $u_{x}$
on the jet axis indicated a sinusoidal variation at one frequency,
 $f_{2}\approx 0.017$
, modulated by a periodic variation at a lower frequency,
 $f_{3}\approx 0.001$
. The former seems to be associated with pulsation events, while the latter was found to be related with the periodic intensification of such pulsation events. For comparison, at
 $S=1.5$
,
 $u_{x}$
remained constant with time at all locations on the axis, which can be anticipated assuming unsteadiness as originating only from a rotating
 $m=1$
helical mode. Except for
 $u_{x}$
on the jet axis and for locations in the upstream part of the bubble (
 $x\leqslant 2$
), all components at all positions, had temporal oscillations with frequencies
 $f_{2}$
,
 $f_{3}$
and additionally,
 $f_{1}\approx 0.093$
, the latter associated with the rotating helical mode, although there was a spread in the PSD about this frequency. The lowest frequency,
 $f_{3}$
, reduced with an increase in
 $S$
for the swirl range where pulsating BVB was observed.
(a) Time series of
 $u_{x}$
for
 $S=1.56$
, at different locations (
 $x,y,z$
): - - - -, (1, 0, 0); —— (black), (5, 0, 0); —— (grey), (5, 0, 0.5). (b) Power spectral density of
 $u_{y}$
at (5, 0, 0.5).

Streamlines at two different times for
 $S=1.56$
. A second set of closed streamlines (green) are observed only at the later instant, the intermittent appearance of which seems to cause the pulsating flow behaviour (see movie 2).

Dynamics of the flow is best understood by examining animations created using snapshots of velocity fields, available as movie 1 available athttps://doi.org/10.1017/jfm.2019.401 and instantaneous streamlines in movie 2. Figure 8 shows two representative instants showing streamlines. While a closed set of streamlines (red) associated with the bubble and observed for the case of
 $S=1.5$
is present at both
 $t=4000$
and 4100, a second set (green) representing a toroidal structure developed at the later instant. This intermittent formation of a ‘second cell’ was seen to influence the pulsating dynamics of the flow. While not studied here, it is noted that in hysteresis studies (see § 4.3), a two-celled BVB with a spiral tail was observed as the next new flow state at higher swirls. This state is characterized by a permanent second toroidal structure nested within that which is present for the one-celled case (figure 2
a). This suggests that the pulsating behaviour is a flow feature that is observed in the intermediate swirl range between two time-periodic flows – the one and two-celled BVB with spiral tail. It is noted that strong similarities exist between the present flow behaviour and that observed for the Grabowski profile by Pasche, Avellan & Gallaire (Reference Pasche, Avellan and Gallaire2018), including the presence of axisymmetric oscillations and multiple frequencies. However, no additional distinct helical structures which rotate at a different frequency could be identified using a temporal Fourier decomposition of time series of the velocity field,
 $\boldsymbol{u}(\boldsymbol{x},t)$
. An examination using tracer particles did not provide insights into these structural changes, although it was observed that after traversing the bubble envelope, due to non-axisymmetric unsteady flow in the downstream end of the bubble, some particles were engulfed into it, while others were convected along the spiral tail in the bubble’s wake (Pradeep Reference Pradeep2019). This is in agreement with observations made in experiments of Faler & Leibovich (Reference Faler and Leibovich1978), who noted a ‘simultaneous emptying and filling’ of a bubble in this downstream region.
It is not clear whether this type of BVB has been previously observed, although low frequency modulations have been reported for various swirling flows where VB was observed (Stevens, Lopez & Cantwell Reference Stevens, Lopez and Cantwell1999; Blackburn & Lopez Reference Blackburn and Lopez2000; Ruith et al. Reference Ruith, Chen, Meiburg and Maxworthy2003; Pasche et al. Reference Pasche, Avellan and Gallaire2018). In all cases, there are certain differences from the features observed here, as elaborated in Pradeep (Reference Pradeep2019).
4.2 Conical form of vortex breakdown
While a pulsating BVB was observed for
 $S=1.57$
, the flow stabilized into a CVB when simulations were carried out on grid D40 for
 $S\geqslant 1.58$
. This indicated that CVB is favoured at higher
 $S$
compared to BVB. A similar trend has been observed in the axisymmetric simulations of Fitzgerald et al. (Reference Fitzgerald, Hourigan, Thompson, Behnia, Lin and McBain2004). The inflow was confined to a conical sheet downstream of breakdown which radially expanded to an extent that it was influenced by the periodic lateral boundaries. To minimize undesired interactions and eliminate the possibility that CVB is sustained due to lateral boundary conditions, D80 (see table 1) was employed for further explorations. Due to the expense associated with simulations using D80, only three cases of
 $S=1.6$
, 1.8 and 2 were studied. All had a CVB present, but the highest of these swirls exhibited a ‘wide-open’ type.
Contour lines at an instant on
 $z=0$
plane. (a) Axial velocity (range [
 $-0.06$
, 1]; levels shown
 $-0.05$
, 0, 0.05 and 0.1; regions where
 $u_{x}\leqslant 0$
shaded grey) and (b) vorticity magnitude
 $|\unicode[STIX]{x1D734}|$
(range [0, 4.4]; levels 0.1, 0.5 and 1, grey to black) showing radial expansion of flow into a conical sheet and presence of undulations on its surface, for the case of
 $S=1.6$
.

4.2.1 Instantaneous features for
 $S=1.6$

Typical instantaneous features of CVB for a swirl of
 $S=1.6$
are as in figure 9, showing contours of axial velocity and vorticity magnitude on the meridional plane. The swirling jet entering the domain axially decelerated and a stagnation point developed close to the inlet at
 $x\approx 1$
, followed downstream by a sharp conical expansion as a thin sheet with an opening angle of
 ${\approx}90^{\circ }$
. This sheet enclosed a relatively large recirculation region of nearly stagnant flow compared to BVB. The weak reverse flow in this region had a minimum of
 $u_{x}$
around
 $-0.06$
. The flow took a paraboloid shape in the vicinity of the stagnation point, in agreement with observations in Billant et al. (Reference Billant, Chomaz and Huerre1998). The maximum of axial velocity for
 $x>5$
was
 ${\approx}0.2$
implying that there was reduced axial convection leading to long residence times in the downstream part of the domain. Similar to experiments, the conical sheet undulated beyond a distance of a few jet diameters downstream of the stagnation point, as seen in figure 9(b). The azimuthal component of velocity drastically reduced on the cone, and the flow downstream of the stagnation point was only weakly swirling.
Axial velocity contours on different cross-sectional planes at
 $t=7500$
for
 $S=1.6$
. The figures indicate that the flow is axisymmetric upstream (
 $x\leqslant 5$
), but distorted downstream.

Cross-sectional features of CVB are shown in figure 10 by means of axial velocity contours at various streamwise positions. The conical sheet remained approximately axisymmetric for
 $x=5$
, while non-axisymmetric features became prominent at
 $x=20$
, where the flow along this sheet is almost parallel to the jet axis. By
 $x=30$
, the sheet configuration was severely weakened and distorted, with unsteady disorderly flow features observed. In experiments, the downstream flow attained a weakly turbulent state. Note that the recirculation zone in the core region is absent at
 $x=30$
.
Temporal features are best understood by examining videos of contours on meridional and cross-sectional planes provided as movies 3 and 4. The entire conical structure was found to rotate at a low frequency, similar to experiments where this motion was reported as being a major deterrent in scrutinizing the structure of CVB. In the vicinity of breakdown, the flow remained mostly steady with weak temporal variations in the opening angles, while downstream (
 $x\geqslant 10$
), rotation of the structure was observed. Flow structures were observed to be mostly restricted to a region of radius 25 for the entire duration of the simulation. Thus, it seems reasonable to assume that CVB is not directly influenced by the lateral boundaries placed at a radius of 40.
Meridional projection of streaklines for
 $S=1.6$
at different times
 $t$
from the start of release (
 $t=150$
, 400 and 650), showing disorganized features at downstream regions of cone and the recirculation zone. Only part of the domain is shown for clarity.
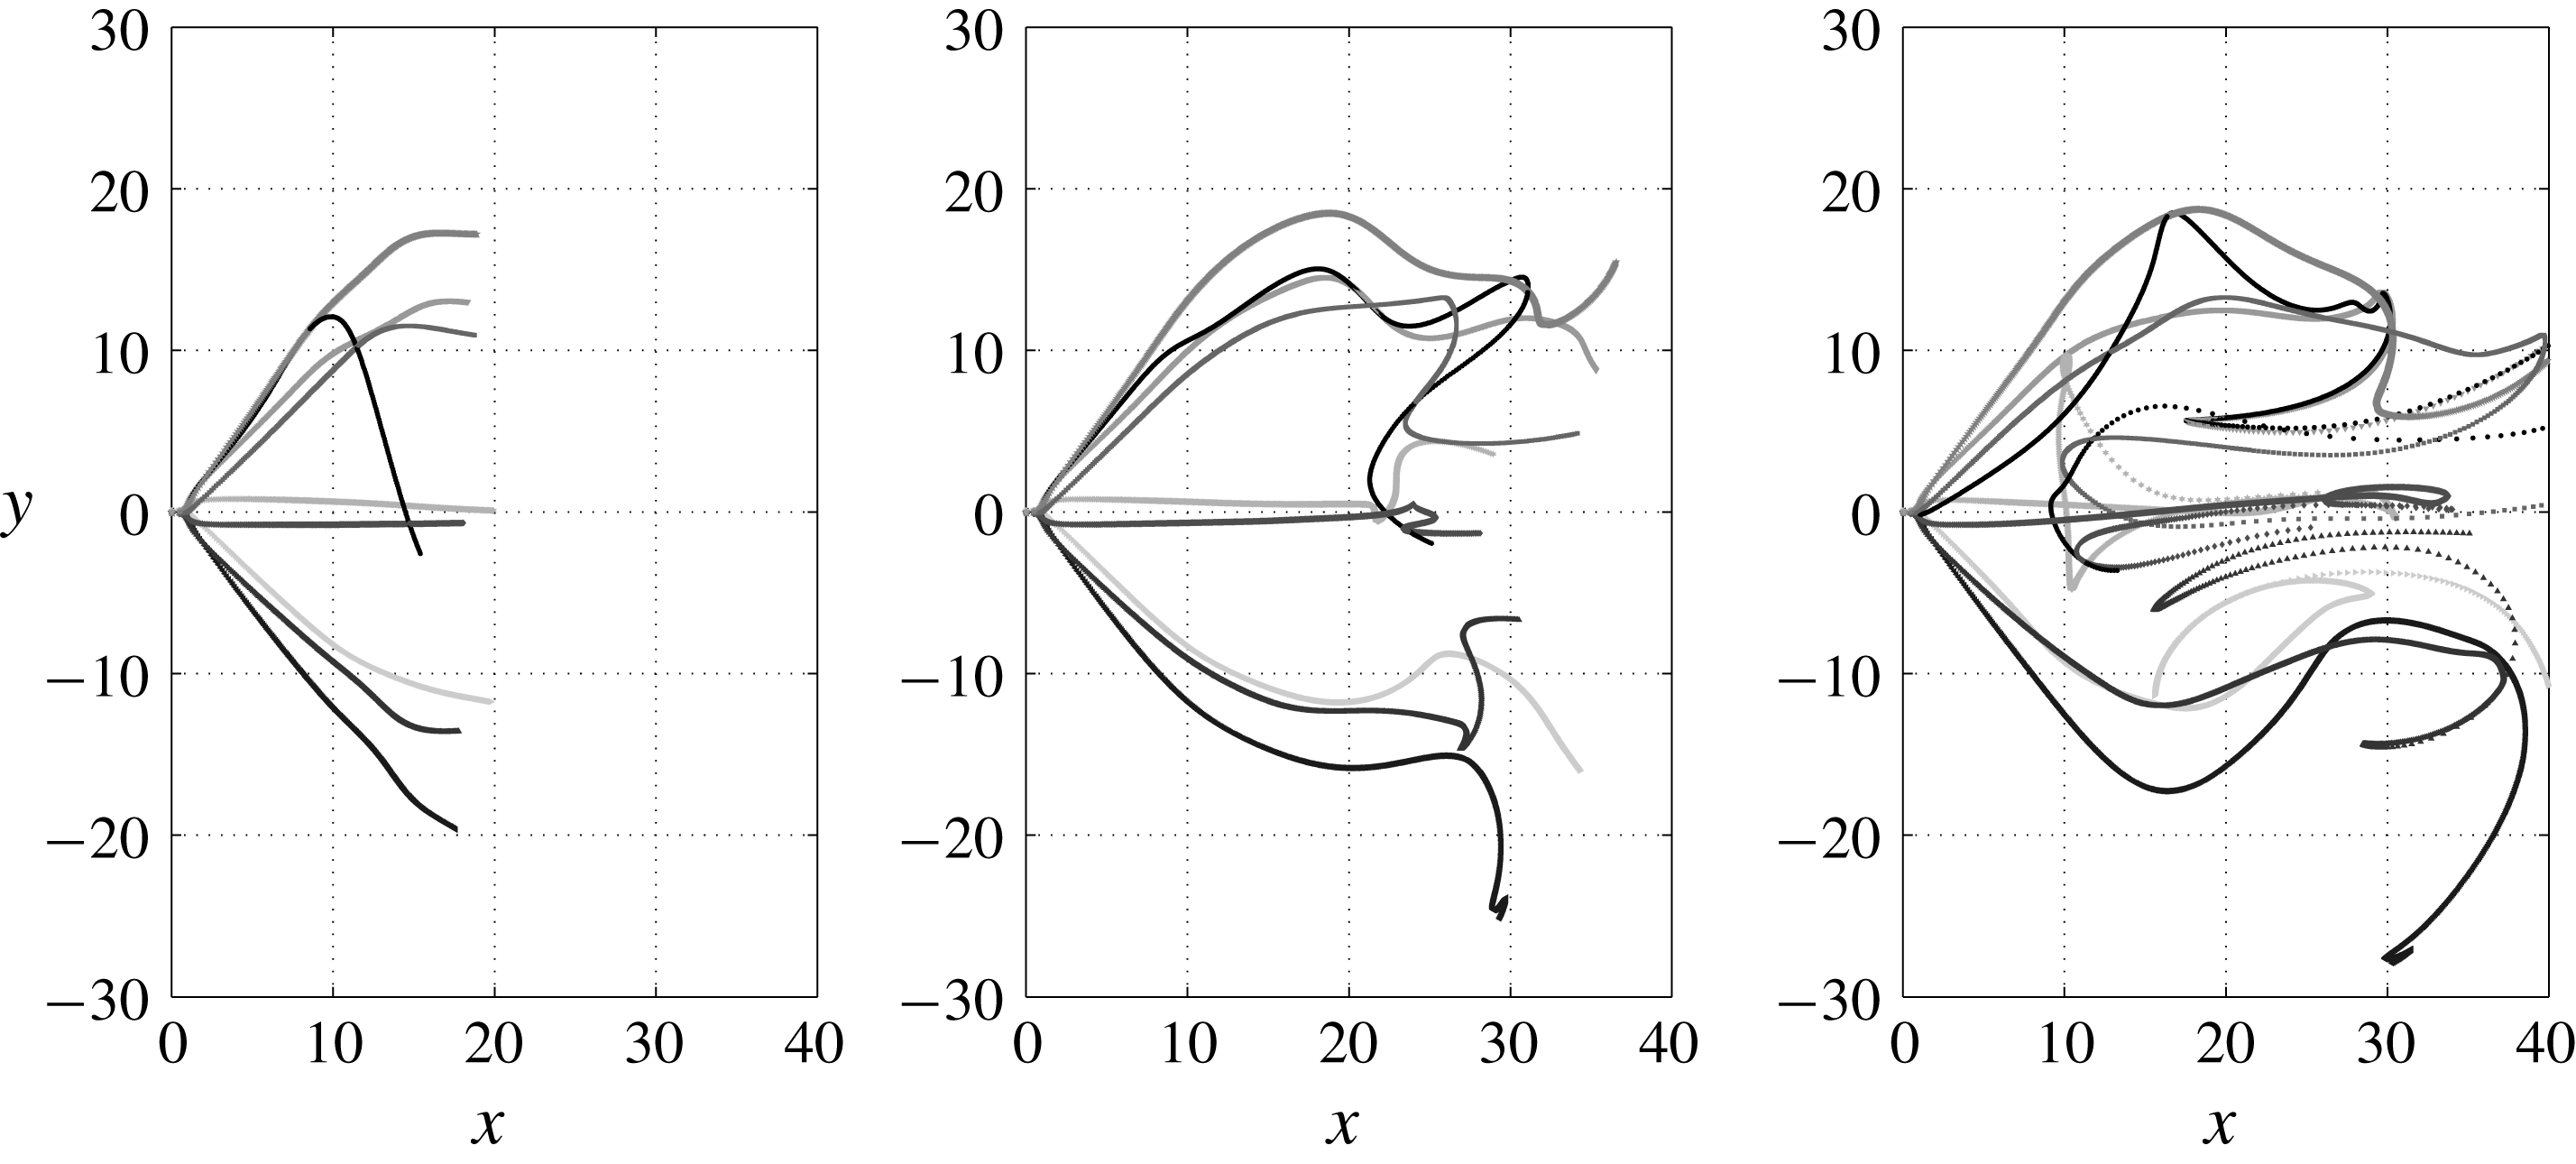
Visualizations based on tracer particles released, with initial positions at
 $r_{0}=0$
and
 $r_{0}=0.1$
(see § 2 for details), are shown at different instances in figure 11. A conical state was established by a simulation time of
 ${\approx}3000$
and particles were released starting
 $7800$
. The particles initially spread along an approximately axisymmetric conically expanding sheet, downstream of a stagnation point in the flow. At
 $x\approx 15$
, the radial expansion rate reduced and eventually led to the particles turning almost parallel to the jet axis. The relatively unsteady and non-axisymmetric nature of the downstream regions of flow can be inferred from inspecting streaklines for
 $t\geqslant 400$
with visualizations showing that while some curve radially inwards, others move outwards, with some entrained into the weak recirculation zone. It is evident from these visualizations that while the flow remains organized in the upstream region containing the conical sheet, its structure is distorted elsewhere, especially within the recirculation zone. Further, although the shortest duration in which a particle reached the outflow boundary was around
 $500$
, the average duration was extended considerably due to particles getting trapped into the recirculation zone, with residence times greater than 1000.
Computational difficulties abound in studying CVB due to the large radial spreading of the cone and slow unsteady non-axisymmetric motions in the downstream regions. The former requires a large domain to simulate the entire structure in addition to sufficient grid resolution and appropriate numerical scheme to resolve the thin sheet. The latter deters local grid refinement and increases the required simulation time to capture the evolution of the cone. With the focus on qualitative behaviour, the time-averaged flow features are reported next.
4.2.2 Time-averaged spatial structure for
$S=1.6$

The velocity field was time averaged for a duration of approximately
 $2500$
starting from the time CVB was established. Additionally, assuming axisymmetry, the flow was azimuthally averaged for further statistical convergence. Figure 12(a) shows projected streamlines on the meridional plane. A large recirculation region encompassed by the cone with an approximate maximum radius of around 15 and an axial length of 25 can be seen. It is evident that the conical sheet eventually converges radially towards the core region, forming what can be crudely described as an enlarged ‘bubble’ containing a weak toroidal recirculation region. Counter-rotating vortices that represent this toroid intersecting the meridional plane have been observed in experiments of CVB (Billant et al.
Reference Billant, Chomaz and Huerre1998). Figure 12(b) shows contours of the root-mean-squared fluctuating axial velocity component (other components not shown for conciseness). Variations of the opening angle of the cone can be inferred from this figure, while the flow in the vicinity of the stagnation point remained steady. It was observed that the maximum magnitudes of all components were only approximately
 $6\,\%$
of the velocity scale, indicating weak motions. The streamlines for
 $x\geqslant 30$
indicate an almost columnar flow. Weak axial vorticity was present here, implying that a weakened ‘vortex core’ exists downstream of VB. It is interesting to note that analogous structures qualitatively similar to those observed for BVB are present in CVB.
Time-averaged features of CVB at
 $S=1.6$
shown on meridional plane: (a) mean projected streamlines and (b) contours of root mean square of fluctuating axial velocity.

Streamwise variations along mean projected streamlines in solutions obtained at
 $S=1.6$
of (a) radial position, (b) slope of streamline, (c) projected velocity, (d) azimuthal velocity (lines) and circulation (symbols), (e) azimuthal vorticity and (f) pressure drop (lines) and Bernoulli head (symbols) for streamlines starting from
 $x=0$
: —— and ○,
 $r=0.5$
; - - - - and
 $\times$
,
 $r=0.75$
; — ⋅ — and ♢,
 $r=1$
. Insets show variations in the vicinity of the stagnation point (
 $x\in [0,2]$
). It can be inferred from these plots that CVB consists of a conically expanding thin sheet along which sharp reductions occur in velocity and pressure drop.

Variations of different flow properties along projected streamlines based on the azimuthally averaged mean flow are shown in figure 13. Figure 13(a) shows the radial positions of streamlines,
 $\unicode[STIX]{x1D70E}(x)$
, which begin from radial positions
 $\unicode[STIX]{x1D70E}(x=0)=0.5$
, 0.75 and 1 at the inflow plane. The streamlines achieved a constant slope of
 $\text{d}\unicode[STIX]{x1D70E}/\text{d}x\approx 1$
in the conical part of the sheet for
 $x<10$
(figure 13
b). The streamlines had an approximately constant curvature as the flow turned radially inward for
 $x\in [10,20]$
. It is interesting that an inward radial velocity develops, a feature shared with BVB. The velocity component along the projected streamlines dropped considerably in magnitude with
 $x$
, as seen in figure 13(c). The swirling component of velocity (figure 13
d) nearly vanished within a few diameters downstream of the stagnation point implying that the conical sheet is a weakly swirling structure. The symbols, representing circulation parameter
 $\unicode[STIX]{x1D6E4}=\unicode[STIX]{x1D70E}u_{\unicode[STIX]{x1D703}}$
, show that although the streamlines radially expand with
 $x$
, it too reduces. The azimuthal vorticity,
 $\unicode[STIX]{x1D6FA}_{\unicode[STIX]{x1D703}}$
, (figure 13
e) increased in magnitude past the stagnation point due to vortex tilting, but further downstream, dropped drastically in relation to the loss of gradients associated with the reduction in velocities. It is interesting to note the strong presence of both positive and negative
 $\unicode[STIX]{x1D6FA}_{\unicode[STIX]{x1D703}}$
close to the stagnation point associated with the inner and outer shear layers that demarcate the conical sheet. The pressure (figure 13
f) increased to values close to the ambient pressure
 $p_{\infty }$
of the chamber by
 $x=1$
(see inset) and remained so along the sheet. This confirms the assumption of Billant et al. (Reference Billant, Chomaz and Huerre1998) used as part of their breakdown criterion, that pressure at the stagnation point for CVB is given by
 $p_{0}=p_{\infty }$
. The Bernoulli head,
 $H=p+\boldsymbol{u}\boldsymbol{\cdot }\boldsymbol{u}/2$
, drops to negligible values by
 $x\approx 10$
. Thus, both
 $\unicode[STIX]{x1D6E4}$
and
 $H$
, which are preserved on streamsurfaces of axisymmetric inviscid flows, are strongly reduced by viscous actions. While the low
 $Re$
chosen for the present study can lead to strong viscous effects, CVB seems to amplify the role of viscosity by the formation of the thin conical sheet of flow. However, it must be noted that on the jet axis (
 $r=0$
),
 $H$
remained approximately a constant, confirming another assumption of the criterion of Billant et al. (Reference Billant, Chomaz and Huerre1998).
As
 $S$
was increased further to 1.8, the conical form was sustained, although the opening angle increased (not shown), with a larger recirculation region present. However, it remained unclear if the domain dimensions were adequate, and thus, details are not presented here, but can be found in Pradeep (Reference Pradeep2019).
4.2.3 Wide-open CVB
Mourtazin & Cohen (Reference Mourtazin and Cohen2007) reported observing what they referred to as a ‘wide-open’ cone (see figure 7
c) at high
 $Re$
, where the thin sheet opened out radially within a short distance downstream of the stagnation point, at an angle perpendicular to the jet axis. Similar observations have been noted in older experimental studies of swirling jets (Gore & Ranz Reference Gore and Ranz1964). This phenomenon was also observed in the present study for
 $S=2$
in D80. However, structures of
 $m=4$
were present and VB was in close proximity to the inflow plane and thus only a brief description of this state is provided and caution must be exercised when interpreting these results. Projected streamlines on
 $y=0$
plane at an arbitrary instant are plotted in figure 14(a). A stagnation point was present at
 $x\approx 0.8$
, downstream of which the flow was confined into a thin radially expanding sheet. Unlike the CVB observed at
 $S=1.6$
, (see figures 12 and 13
b), the streamlines here were found to have a positive curvature that led to the structure being wide open. This seems to be the major distinguishing feature of this type of CVB, with the flow almost reversing towards the inflow plane. While the flow was axisymmetric at upstream positions, a spurious
 $|m|=4$
structure developed, as seen from axial velocity contours on cross-sectional plane in figure 14(b). In spite of the presence of this structure, the breakdown feature of sharp radial expansion seen in experiments was still captured in the simulations. In simulations at higher
 $Re$
, the same type was observed, but with the flow being turbulent and without the
 $|m|=4$
structures; a detailed analysis of this type of CVB will be reported elsewhere.
(a) Projected streamlines on positive
 $z=0$
plane based on instantaneous velocity fields for
 $S=2$
. (b) Axial velocity contours on different cross-sectional planes for the same. This type is identified as a ‘wide-open’ CVB, with the thin sheet turning perpendicular to the jet axis (
 $x=5$
,
 $y=10$
). Cross-section showed presence of possibly spurious
 $|m|=4$
modes.

4.3 Other flow states observed
Hysteresis studies were carried out to examine bistability features of BVB and CVB. These will be discussed in detail elsewhere, but a brief description of available results including new flow states observed is listed here for completeness. BVB and CVB were found to be bistable for swirls including
 $S=1.5$
and 1.6. At higher swirls than those reported here, BVB attained a two-celled bubble structure. Further increase in
 $S$
led to the appearance of an ‘asymmetric’ BVB identified by Billant et al. (Reference Billant, Chomaz and Huerre1998). Thus, all states except for the ‘asymmetric’ CVB have been observed in the low
 $Re$
simulations carried out, bolstering confidence in the qualitative features predicted by the Maxworthy model of swirling jet.
5 Helical instability
The time-periodic behaviour and flow structure for BVB with spiral tail observed at
 $S=1.5$
indicates the presence of a self-excited global mode. Similar unstable modes have been observed for the SVB and stability analysis has been used to shed light on the origin of these instabilities (Gallaire et al.
Reference Gallaire, Ruith, Meiburg, Chomaz and Huerre2006). The BVB with spiral tail, in contrast to SVB, is characterized by the stagnation point at the bubble’s nose being fixed in position on the axis, with the bubble approximately axisymmetric in its upstream part (see figure 5). Thus, the helical mode that is observed in the bubble’s wake does not significantly affect the bubble itself, suggesting that the unstable modes associated with these two forms of VB might be different.
Local and global stability analyses were carried out using steady axisymmetric solutions (see § 2.2) as the base state for
 $S=1.5$
at which the BVB with spiral tail was attained. While not observed for the Maxworthy profile, SVB has been reported to occur due to a nonlinear steep/elephant global mode for the Grabowski profile and it is first demonstrated using a local analysis that the frequency selection criterion for the instability is linear and not that for a nonlinear steep mode. This is followed by the examination of global mode features and comparisons with results from simulations based on a global stability analysis.
5.1 Local analysis
Spatio-temporal instabilities arising for
 $m=+1$
were examined first for
 $S=1.5$
based on expectations from simulations. Variation along
 $x$
of absolute growth rate (
 $\unicode[STIX]{x1D714}_{0,i}$
) and frequency (
 $\unicode[STIX]{x1D714}_{0,r}$
) are shown in figure 15(a). A short description on the computation of
 $\unicode[STIX]{x1D714}_{0}$
is provided in appendix E, while further details on the procedure are presented in Pradeep (Reference Pradeep2019). The nonlinear fronts theory predicts the global frequency as
 $\unicode[STIX]{x1D714}_{0,r}$
at the transition point
 $x_{CA}$
, from convective to absolute instability, i.e. where
 $\unicode[STIX]{x1D714}_{0,i}(x)=0$
(e.g. Pier & Huerre Reference Pier and Huerre2001). This frequency was found to be
 $\unicode[STIX]{x1D714}_{0,r}(x_{CA})=0.93$
, far higher than the frequency
 $\unicode[STIX]{x1D714}_{NS}=0.83$
extracted from the numerical simulation. Additionally, for the steep mode, the associated pocket of absolute instability must almost vanish for a globally stable base flow. As noted in Pier & Huerre (Reference Pier and Huerre2001), this is a somewhat paradoxical requirement – when either a linear or steep (nonlinear) global mode exists associated with a region of absolute instability based on a linear local analysis, this region’s presence for different cases is only necessary for the destabilization of the former, while it is necessary and sufficient for the destabilization of the latter. This can be inferred for the Grabowski profile based on figures 2 and 3 of Qadri, Mistry & Juniper (Reference Qadri, Mistry and Juniper2013). The absolute growth rate
 $\unicode[STIX]{x1D714}_{0,i}(x)$
for the stable case of
 $S=1.45$
is additionally shown in figure 15(a). It is evident that the pocket of absolute instability remains, even with a swirl reduction well below the threshold (
 $S=1.49$
) required for the helical instability.
(a) Variation of
 $\unicode[STIX]{x1D714}_{0}$
with
 $x$
based on spatio-temporal analysis, with
 $m=+1$
: — ⋅ —,
 $\unicode[STIX]{x1D714}_{0,i}(x)$
,
 $S=1.45$
; ——,
 $\unicode[STIX]{x1D714}_{0,i}(x)$
,
 $S=1.5$
; ○,
 $\unicode[STIX]{x1D714}_{0,r}(x)$
,
 $S=1.5$
; - - - - (vertical),
 $x_{CA}$
, transition from convective to absolute instability; - - - - (horizontal),
 $\unicode[STIX]{x1D714}_{NS}$
, frequency extracted from simulations,
 $S=1.5$
(see also, figure 2
a). (b) Streamwise variation of
 $\ln \sqrt{E}$
, compared with predictions from local nonlinear (steep mode) and linear global theories: ——, line with slope
 $-k_{0,i}(x_{CA})$
, based on local analysis; - - - -,
 $x_{CA}$
; — ⋅ —, amplitude extracted from DNS; ○, amplitude based on global linear analysis. Both figures confirm that predictions based on nonlinear fronts theory are inconsistent with observations based on simulations.

Figure 15(b) shows the streamwise variation of amplitude of the unstable mode, defined as
 $\sqrt{E}$
, where
 $E(x)$
is the local energy of the unstable mode. For the case of numerical simulations, this was extracted by obtaining perturbation velocity field
 $\boldsymbol{u}^{\prime }=\boldsymbol{u}_{S}-\boldsymbol{U}$
(
 $\boldsymbol{u}_{S}$
is the saturated velocity field, chosen here at
 $t=10^{4}$
) and computing
 $$\begin{eqnarray}\displaystyle E_{NS}(x)={\textstyle \frac{1}{2}}\int _{0}^{L_{y}}\int _{0}^{L_{z}}(u_{x}^{^{\prime }2}+u_{y}^{^{\prime }2}+u_{z}^{^{\prime }2})\,\text{d}y\,\text{d}z. & & \displaystyle\end{eqnarray}$$
The figure shows that the predicted absolute spatial growth rate
 $-k_{0,i}$
at
 $x_{CA}$
based on the nonlinear front theory does not match with that computed from the simulations. These results confirmed that the helical instability mechanism proposed in Gallaire et al. (Reference Gallaire, Ruith, Meiburg, Chomaz and Huerre2006) for the Grabowski profile is different from that observed for the Maxworthy profile.
An estimate for the complex frequency of the linear global mode,
 $\unicode[STIX]{x1D714}_{g}$
, was computed next based on
 $\unicode[STIX]{x1D714}_{0}(x)$
(see § 2.2) for various
 $S$
. These are compared with the frequencies and growth rates obtained in simulations in table 2. At
 $S=1.5$
, the frequency
 $\unicode[STIX]{x1D714}_{g,r}$
matched reasonably well with simulations, although the temporal growth rate
 $\unicode[STIX]{x1D714}_{g,i}$
was found to be an order of magnitude higher. More importantly, the analysis predicted correctly that the base flow is stable for
 $S=1.48$
, which is close to the lowest swirl of
 $S=1.485$
at which no helical instability was observed in numerical simulations. Better estimates for growth rates and frequencies were made by the linear global analysis discussed next, but it can be concluded from the present local analysis that the helical mode (
 $m=+1$
) associated with a BVB with spiral tail is characteristically different from the steep global mode associated with SVB observed for the Grabowski profile. Further investigation of this mode’s features was carried out using a global framework, as discussed next.
Comparisons of global frequency
 $\unicode[STIX]{x1D714}_{g,r}$
and
 $\unicode[STIX]{x1D714}_{g,i}$
computed using local and global linear analyses with simulations (DNS) at different
 $S$
for the Maxworthy profile.

5.2 Global stability analysis
For
 $S=1.5$
, a single
 $m=+1$
mode was observed to be unstable when a global stability analysis was carried out (see appendix E, figure 21
b). Growth rates and frequencies of this mode at various
 $S$
are listed in table 2 and are seen to match closely with the simulations. Figure 16 shows real and imaginary parts of the eigenfunction associated with axial velocity,
 $\tilde{u} _{x}$
for
 $S=1.5$
, conveniently normalized based on the maximum velocity amplitude achieved over the entire domain. Similar behaviour was observed for other components, confirming that the bubble region remains unaffected by the linear mode. This should be contrasted with the marginally unstable
 $m=1$
global mode reported in figure 6(a) of Meliga et al. (Reference Meliga, Gallaire and Chomaz2012), where the mode has significant energy content in the bubble region.
Contours of axial velocity (upper half showing the real part and lower half, the imaginary part, with radial distance
 $r=|y|$
) of global mode for
 $m=1$
at
 $S=1.5$
from global analysis. The figure shows that the global mode is restricted to the bubble’s wake (
 $x\geqslant 4$
, see figure 2
a). Contrast with figure 6(a), Meliga et al. (Reference Meliga, Gallaire and Chomaz2012).

The amplitude associated with the unstable global mode,
 $\sqrt{E_{G}}$
, is compared with other results in figure 15(b). Here, the value was computed from the required eigenfunction using a definition similar to that for
 $E_{NS}$
, but in a cylindrical coordinate framework. For purposes of comparison with nonlinear fronts theory, the energy was conveniently normalized such that
 $E_{G}(x_{CA})=E_{NS}(x_{CA})$
. While variation in the far wake (
 $x\geqslant 4.5$
) is in good agreement with that observed in simulations, the linear analysis does not capture features of the saturated perturbations in the bubble region. This indicates that the linear global mode associated with the far wake interacts with the bubble and its near wake, suggesting possible nonlinear interactions leading to increased amplitude in this region. This can also be inferred from the PSD shown in figure 6(a) at
 $x=3$
(also see figure 2
a). It is interesting to note that this increase is present in a region where the linear mode’s energy is negligible. Further scrutiny of the azimuthally averaged distribution of individual velocity components and comparisons with numerical results are presented in appendix F, where this feature is further highlighted.
Summarizing the results of stability analyses, it has been established that a self-sustained
 $m=+1$
helical global mode becomes unstable in the wake due to a linear instability. This mode is not a nonlinear steep global mode as observed for SVB (Gallaire et al.
Reference Gallaire, Ruith, Meiburg, Chomaz and Huerre2006). It can be speculated that the two states, BVB with a spiral tail and SVB, are unique and originate through characteristically different helical modes. While an SVB has not been observed for swirling jets, both SVB and BVB with spiral tail have been observed to occur in swirling flows in tubes at different swirls (Sarpkaya Reference Sarpkaya1971; Faler & Leibovich Reference Faler and Leibovich1977) and it would be interesting to explore if similar differences exist in the latter case.
6 Assessment of some models for VB
Attempts were made to assess two major theories that have been proposed towards explaining the phenomenon of VB. The approaches based on negative azimuthal vorticity amplification (Brown & Lopez Reference Brown and Lopez1990) and criticality of flow (Squire Reference Squire1960; Benjamin Reference Benjamin1962) were considered. While these have been previously tested using both experimental and numerical results for BVB, with some success, it still remains an open question as to which explanation, if any, gives a complete understanding of the mechanisms underlying VB. In this study, both theories are further evaluated using CVB. Both assume steady axisymmetric inviscid flow. CVB is, to a good approximation, axisymmetric and steady, with unsteady non-axisymmetric developments being only secondary features that weakly distort its overall structure. For VB in swirling jets, the presence of an outer shear layer, compounded with the development of a recirculation zone, imply that deviations in predictions due to viscous effects are expected.
Investigation of models for predicting the critical swirl above which breakdown occurs is not reported here. While the critical swirl based on columnar initial conditions occurred at
 $S=1.39$
, Billant et al. (Reference Billant, Chomaz and Huerre1998) have demonstrated that hysteresis effects, which have not been considered in this study, influence this value.
6.1 Wave theories of Squire and Benjamin
One approach towards explaining VB has been from the perspective of hydrodynamic wave propagation. The first attempt is attributed to Squire (Reference Squire1960) (see Benjamin Reference Benjamin1962), who conjectured that VB occurred as the swirl is increased beyond a critical value above which regions of the flow were capable of sustaining infinitesimal ‘standing waves’. Benjamin (Reference Benjamin1962), while retaining the notions of criticality defined by Squire, proposed that VB occurred as a finite-amplitude transition from a supercritical to an adjacent subcritical ‘conjugate’ state. Both states were assumed to be columnar solutions,
 $\unicode[STIX]{x1D6F9}(r)$
, to the Squire–Long (or Bragg–Hawthorne) equation (see Benjamin Reference Benjamin1962)
 $$\begin{eqnarray}\displaystyle \frac{\unicode[STIX]{x2202}^{2}\unicode[STIX]{x1D713}}{\unicode[STIX]{x2202}x^{2}}+\frac{\unicode[STIX]{x2202}^{2}\unicode[STIX]{x1D713}}{\unicode[STIX]{x2202}r^{2}}-\frac{1}{r}\frac{\unicode[STIX]{x2202}\unicode[STIX]{x1D713}}{\unicode[STIX]{x2202}r}=r^{2}\frac{\text{d}H}{\text{d}\unicode[STIX]{x1D713}}-\unicode[STIX]{x1D6E4}\frac{\text{d}\unicode[STIX]{x1D6E4}}{\text{d}\unicode[STIX]{x1D713}} & & \displaystyle\end{eqnarray}$$
for the same distribution of Bernoulli head
 $H$
and circulation
 $\unicode[STIX]{x1D6E4}$
on streamsurfaces. Criticality of these base states was evaluated by searching for infinitesimal steady modal solutions. Introducing perturbations with complex wavenumber
 $k$
, and radial eigenfunction
 $\unicode[STIX]{x1D719}(r)$
, given by
 $\unicode[STIX]{x1D713}(x,r)=\unicode[STIX]{x1D6F9}(r)+\unicode[STIX]{x1D716}\unicode[STIX]{x1D719}(r)\exp (kx)$
, leads to the equation
 $$\begin{eqnarray}\displaystyle \frac{\text{d}}{\text{d}r}\left(\frac{1}{r}\frac{\text{d}\unicode[STIX]{x1D719}}{\text{d}r}\right)+\left(\frac{1}{r^{4}u_{x}^{2}}\frac{\text{d}(ru_{\unicode[STIX]{x1D703}})^{2}}{\text{d}r}-\frac{1}{u_{x}}\frac{\text{d}}{\text{d}r}\left(\frac{1}{r}\frac{\text{d}u_{x}}{\text{d}r}\right)\right)\unicode[STIX]{x1D719}=-\frac{k^{2}}{r}\unicode[STIX]{x1D719}, & & \displaystyle\end{eqnarray}$$
where
 $u_{x}$
and
 $u_{\unicode[STIX]{x1D703}}$
are velocity components of the base state
 $\unicode[STIX]{x1D6F9}$
. Boundary conditions were chosen by Benjamin (Reference Benjamin1962) as
 $\unicode[STIX]{x1D719}(0)=0$
and
 $\unicode[STIX]{x1D719}(R)=0$
assuming flow in a tube of radius
 $R$
with perturbations not changing the flow rate. This is a Sturm–Liouville problem with real and discrete eigenvalues,
 $k^{2}$
, which can be arranged in an ascending order (Benjamin Reference Benjamin1967). For the existence of wave-like solutions, the minimum eigenvalue
 $k_{m}^{2}$
must be negative. Benjamin (Reference Benjamin1962) used Sturm’s comparison theorem to observe that eigenfunctions for larger eigenvalues must ‘oscillate more rapidly’, i.e. have more zeroes in the interval
 $(0,R)$
compared to those for smaller eigenvalues. Thus, the eigenfunction
 $\unicode[STIX]{x1D719}_{0}$
for
 $k^{2}=0$
, must have at least one zero in
 $(0,R)$
if the flow is subcritical (
 $k_{m}^{2}<0$
). A modified condition for criticality in open flows can be arrived at by solving (6.2) with
 $k=0$
and initial conditions at
 $r\rightarrow 0$
being
 $\unicode[STIX]{x1D719}_{0}=0$
and
 $1/r\,\text{d}\unicode[STIX]{x1D719}_{0}/\text{d}r=1$
. The second condition reflects the notion that
 $\unicode[STIX]{x1D719}$
can be normalized, without loss of generality, using a scale associated with the perturbation axial velocity on the axis,
 $u_{x}^{\prime }(0)$
(e.g. see Fraenkel Reference Fraenkel1967, equation 2.5b). It should be clarified that some authors have reported employing
 $\text{d}\unicode[STIX]{x1D719}_{0}/\text{d}r=1$
at
 $r=0$
(Ruith et al.
Reference Ruith, Chen, Meiburg and Maxworthy2003; Oberleithner et al.
Reference Oberleithner, Paschereit, Seele and Wygnanski2012), which would amount to a singularity for
 $u_{x}^{\prime }$
at
 $r=0$
. The initial value problem gives the least critical radius
 $r_{c}$
at which
 $\unicode[STIX]{x1D719}_{0}$
vanishes. Assuming that waves could possibly exist only in regions where a vortex core is present, the condition for subcritical flow reduces to the requirement that
 $r_{c}$
must be smaller than the vortex core radius (e.g. Ruith et al.
Reference Ruith, Chen, Meiburg and Maxworthy2003). To account for the fact that vorticity is additionally present in the shear layer for the Maxworthy profile (2.1), the flow is approximately categorized as subcritical if
 $r_{c}\leqslant 1+\unicode[STIX]{x1D6FF}$
. The critical swirl
 $S_{0}$
for the Maxworthy profile (
 $\unicode[STIX]{x1D6FF}=0.2$
and
 $\unicode[STIX]{x1D6FC}=100$
) was found to be
 $S_{0}\approx 1.66$
, with
 $r_{c}\approx 1.2$
for
 $S\geqslant S_{0}$
and abruptly tending to infinity for lower
 $S$
(see Pradeep Reference Pradeep2019).
Ruith et al. (Reference Ruith, Chen, Meiburg and Maxworthy2003) have previously carried out this analysis locally at various streamwise locations of their steady solutions to the Grabowski inflow by assuming a weakly non-parallel flow and determined that BVB is indeed associated with transitions from supercritical to subcritical regions. A similar approach is employed here to examine solutions obtained for the Maxworthy profile.
Variation of critical radius with
 $x$
for steady solutions of (a)
 $S=1.38$
, (b)
 $S=1.39$
, (c)
 $S=1.5$
and (d) time-averaged solutions of CVB at
 $S=1.6$
: —— (thick),
 $r_{c}(x)$
; —— (thin),
 $r=1.2$
(criticality requirement); - - - -, projected streamlines; — ⋅ —,
 $u_{x}(r=0)$
. A transition from a supercritical to subcritical state is observed at the vicinity of VB for all cases with a stagnation point, including CVB.

Figure 17 shows variation of
 $r_{c}$
along
 $x$
for various flow states. Criticality is considered for the cases of pre-breakdown (
 $S=1.38$
), stagnation point formation (
 $S=1.39$
), steady solutions obtained for BVB with spiral tail (
 $S=1.5$
) using selective frequency damping and time-averaged state of CVB (
 $S=1.6$
). Streamwise variation of centreline velocity and projected streamlines are shown for reference. Additionally, the approximate radius of the vortex core,
 $r=1.2$
, is plotted and acts as an estimate that divides subcritical and supercritical regions. For
 $S=1.38$
, the flow was supercritical everywhere. In the vicinity of the swelling (
 $x\approx 5$
),
 $r_{c}$
took values just above 1.2 implying that the flow is close to criticality. However, the streamwise extent of this region was quite small while the analysis indicates waves of large wavelength (
 $k\rightarrow 0$
) when the flow is close to criticality. Thus, it is reasonable to conclude that the entire flow is approximately supercritical. For
 $S=1.39$
,
 $r_{c}\rightarrow 0$
near the stagnation point implying a rapid oscillation in
 $\unicode[STIX]{x1D719}_{0}$
indicating capability of flow to support waves of small wavelength. When
 $S=1.4$
(not shown), the entire recirculation zone was subcritical. For
 $S=1.5$
, a large subcritical region was observed which started from the breakdown point and extended almost till the outflow boundary. For CVB, the weakly non-parallel approximation is valid only in the region upstream of the conical structure. Interestingly, figure 17(d) indicates that a transition from a supercritical to a subcritical state occurs close to the position of the stagnation point.
From these results, it can be inferred that at the very least, a strong correlation exists between the stagnation point and recirculation zone formation and capability of flow to support infinitesimal waves, even for the case of CVB. Additionally, the flow is shown to be critical only when a stagnation point is present and not for
 $S=1.38$
. The flow was found to be critical for pre-breakdown swirls for the Grabowski profile (Ruith et al.
Reference Ruith, Chen, Meiburg and Maxworthy2003), while Oberleithner et al. (Reference Oberleithner, Paschereit, Seele and Wygnanski2012) reported a similar behaviour for turbulent swirling jets as the present study. The latter speculated that viscous effects, which can be neglected for turbulent flows, might be the reason for deviations in predictions of the former. The present results show that this is not the case.
It must be emphasized that only linear aspects of the theory proposed by Benjamin (Reference Benjamin1962) have been examined here. Additionally, the occurrence of wide-open CVB observed in the simulations only for a swirl of
 $S=2$
, well above criticality, is incompatible with the requirement of this theory that the flow should be supercritical upstream of VB.
6.2 Theory based on azimuthal vorticity
Starting from the same assumptions of inviscid axisymmetric steady flow that yield (6.1), Brown & Lopez (Reference Brown and Lopez1990) instead investigated variations of azimuthal vorticity,
 $\unicode[STIX]{x1D6FA}_{\unicode[STIX]{x1D703}}$
, on streamsurfaces,
 $\unicode[STIX]{x1D713}(x,\unicode[STIX]{x1D70E})=\text{const.}$
, where
 $\unicode[STIX]{x1D70E}$
is the radial position of a streamsurface at a given
 $x$
. Noting that the left-hand side of (6.1) is
 $-\unicode[STIX]{x1D70E}\unicode[STIX]{x1D6FA}_{\unicode[STIX]{x1D703}}$
, it can be reformulated as
 $$\begin{eqnarray}\displaystyle \unicode[STIX]{x1D6FA}_{\unicode[STIX]{x1D703}}=\frac{A}{\unicode[STIX]{x1D70E}}-B\unicode[STIX]{x1D70E}, & & \displaystyle\end{eqnarray}$$
where
 $A$
and
 $B$
are constants on a streamsurface based on
 $H$
and
 $\unicode[STIX]{x1D6E4}$
that can be determined based on inflow features. As an inviscid mechanism, the authors proposed that the development of negative
 $\unicode[STIX]{x1D6FA}_{\unicode[STIX]{x1D703}}$
in regions away from the axis induced deceleration in the core (Biot–Savart law) causing tilting of streamsurfaces which further reduced
 $\unicode[STIX]{x1D6FA}_{\unicode[STIX]{x1D703}}$
, eventually stabilizing into a steady state governed by equation (6.3) and containing a stagnation point when sufficient strengths of
 $\unicode[STIX]{x1D6FA}_{\unicode[STIX]{x1D703}}<0$
were achieved. Thus, the initial transition to VB was hypothesized to occur when streamwise oriented vortex lines associated with a swirling columnar core were tilted by self-induction into a counter-winding helical configuration due to generation of negative
 $\unicode[STIX]{x1D6FA}_{\unicode[STIX]{x1D703}}$
. It should be noted that although the mechanism in itself is inviscid, equation (6.3) is dependent on
 $\unicode[STIX]{x1D70E}$
, which is obtained from viscous solutions of the numerical simulations.
Azimuthal vorticity variation on a given streamsurface with
 $x$
for steady solutions of (a)
 $S=1.38$
, (b)
 $S=1.39$
and (c)
 $S=1.5$
and (d) time-averaged solutions of CVB for
 $S=1.6$
. Comparisons are made between results from simulations (thick curves) with predictions from (6.3) (thin curves) for streamsurfaces starting at inlet (
 $\unicode[STIX]{x1D70E}_{0}=\unicode[STIX]{x1D70E}(x=0)$
): ——,
 $\unicode[STIX]{x1D70E}_{0}=0.01$
; - - - -,
 $\unicode[STIX]{x1D70E}_{0}=0.5$
; — ⋅ —,
 $\unicode[STIX]{x1D70E}_{0}=0.8$
. Qualitative features are in agreement for BVB, while predictions for CVB deviate considerably from results.

Figure 18 compares the variation of
 $\unicode[STIX]{x1D6FA}_{\unicode[STIX]{x1D703}}$
along streamsurfaces starting from
 $\unicode[STIX]{x1D70E}(x=0)=0.01,$
0.5 and 1 between that observed in the numerical simulations and that predicted by equation (6.3) for the same cases studied in the previous section. For all, the large positive value of
 $\unicode[STIX]{x1D6FA}_{\unicode[STIX]{x1D703}}$
associated with the shear layer reduced in a more or less similar fashion as that predicted by the equation;
 $\unicode[STIX]{x1D6FA}_{\unicode[STIX]{x1D703}}\sim O(-1)$
was observed for the pre-breakdown solution of
 $S=1.38$
, implying that its development alone is not sufficient for predicting VB. As
 $S$
was increased, viscous effects associated with a larger recirculation region dominated leading to large deviations from theoretical predictions, although qualitative trends in variation and an overall decrease of
 $\unicode[STIX]{x1D6FA}_{\unicode[STIX]{x1D703}}$
were seen for cases containing BVB. For CVB, while the predictions match upstream of the stagnation point,
 $\unicode[STIX]{x1D6FA}_{\unicode[STIX]{x1D703}}$
was predicted to linearly reduce along the conical sheet, which was not observed in the results of the simulations. This discrepancy is probably due to the strong radial expansion associated with CVB implying that (6.3) simplifies to
 $\unicode[STIX]{x1D6FA}_{\unicode[STIX]{x1D703}}\approx -B\unicode[STIX]{x1D70E}$
, while for the simulations, viscous effects that dominate along the conical sheet lead to a reduction in meridional velocity gradients. Thus, while qualitative features are captured for BVB based on the viscous solutions obtained in simulations, this is not the case for CVB.
7 Summary and conclusions
The introduction of swirl to axisymmetric jets leads to a remarkable sequence of distinct states known to exist over overlapping ranges of control parameters. The present numerical investigation was performed to extend the understanding of features of various VB states that have been observed for these flows in the laminar regime. To this end, a steady axisymmetric inflow condition with the swirling jet modelled by the Maxworthy profile proposed in Ruith et al. (Reference Ruith, Chen and Meiburg2004) has been used. Only states for a given inflow condition that arise from a streamwise-invariant initial conditions have been discussed here.
The major focus of this study is on a small range of swirl numbers,
 $S\in [1.4,1.6]$
, where different flow states including two forms of VB were observed, while features of other states outside this range have also been briefly examined. For lower pre-breakdown values of swirls, as anticipated from experimental results, helical modes of
 $m=-2$
were observed. An axisymmetric swelling was observed at
 $S=1.38$
, followed by a stagnation point at
 $S=1.39$
(signifying the onset of VB) and a recirculation zone associated with a steady BVB at
 $S=1.4$
. The steady BVB was found to destabilize at
 $S=1.49$
, suggesting a supercritical Hopf bifurcation. Interestingly, the saturated long-time state contained a helical mode (
 $m=1$
) in the bubble’s wake which did not influence the dynamics in the upstream parts of the bubble, where the flow remained approximately steady and axisymmetric. This type is referred to as BVB with spiral tail. A local stability analysis showed that this instability arose due to the presence of a large pocket of absolutely unstable region in the bubble’s wake. In contrast to results obtained for the Grabowski profile for the spiral form of VB, where a nonlinear steep global mode was associated with the instability, the local analysis indicated that a linear frequency selection criterion is appropriate for predicting attributes of the global mode. This was further confirmed using a linear global analysis, which also showed that the mode’s amplitude was negligible in the entire bubble region. Together, these results suggest that BVB with a spiral tail is characteristically different from SVB. It would be interesting to consider aspects of helical instabilities associated with SVB and BVB with spiral tail occurring in flows in tube-vane apparatus to further examine the differences in underlying mechanisms.
For
 $S\in [1.55,1.58]$
, a pulsating type of BVB was observed with peculiar dynamical features. A bubble and a helical mode in its wake were present, with the former changing mildly in size, while the stagnation point’s location also varied weakly with time. Two additional frequencies, along with the one associated with the helical mode, were observed that seemed to be associated with the pulsating behaviour of the flow. It was not clear if this type has been observed previously, although similarities exist between some flow states described in other studies.
CVB was found to be the preferred state for
 $S\geqslant 1.58$
even in domains of limited lateral extent. The swirling jet was found to decelerate leading to the development of a stagnation point, downstream of which it spread out along a thin radially expanding conical sheet which maintained its shape in the upstream parts. It was revealed that in addition to a toroidal vortex present in the recirculation zone contained with the sheet, a weak vortex core existed downstream, indicating the structural similarities between BVB and CVB. Along the streamlines associated with the conical sheet, it was observed that all velocity components and pressure decayed rapidly, with the latter equalling ambient pressure. The thin sheet lost its right-conical shape for the highest swirl examined (
 $S=2$
) and curved away at an angle almost perpendicular to the axis, leading to what is referred to as a wide-open type of CVB, similar to the state observed in Mourtazin & Cohen (Reference Mourtazin and Cohen2007). Interestingly, certain structural similarities exist between various types of CVB and Taylor cones (see Fernández de la Mora Reference Fernández de la Mora2007, figure 1), although the associated physical phenomena differ for the two.
CVB was used to assess theories of Benjamin (Reference Benjamin1962) and Brown & Lopez (Reference Brown and Lopez1990) proposed towards explaining VB. Both assume inviscid axisymmetric steady flows and it is noted that the studies are carried out at a low Reynolds number of
 $Re=200$
. The linear aspect of the former was found to be valid for CVB when applied locally and in the vicinity of the stagnation point. The predictions of azimuthal vorticity variations on streamsurfaces did not match downstream of the stagnation with numerical simulations implying that viscous effects might play an important role in sustenance of the radially expanding sheet in the case of CVB.
In conclusion, swirling jets are shown to exhibit certain unique features that distinguish them from other families of swirling flows and this study serves to complement and extend the understanding gained from previous experimental studies. Further documentation of the behaviour of these flows will be provided by examining hysteresis effects, which will be reported separately.
Acknowledgements
We are grateful to K. Manoharan, N. Balakrishna and S. Hemchandra for providing us with the numerical codes to analyse stability features of the flow. Further, we acknowledge the developers of incompact3d, the open-source flow solver which has been extensively used in this study. The numerical simulations were performed using the SahasraT supercomputer of the Supercomputer Education and Research Centre at the Indian Institute of Science.
Supplementary movies
Supplementary movies are available at https://doi.org/10.1017/jfm.2019.401.
Appendix A. Concerns regarding prescribed steady inflow profile
Employing a steady inflow profile in VB simulations invites several objections. For swirling jets, Billant et al. (Reference Billant, Chomaz and Huerre1998), Liang & Maxworthy (Reference Liang and Maxworthy2005) and Oberleithner et al. (Reference Oberleithner, Sieber, Nayeri, Paschereit, Petz, Hege, Noack and Wygnanski2011) report the presence of VB close to the nozzle exit and for very high swirls, parts of the bubble were present in the nozzle. Thus, it must be cautioned that present results might have deviations from features of real flows, especially for high swirls. However, a posteriori, this choice can be justified by the fact that a majority of qualitative features observed in experiments on laminar swirling jets are reproduced here (compare results with Billant et al. Reference Billant, Chomaz and Huerre1998, figures 6a, 8 and 16). Additionally, Gore & Ranz (Reference Gore and Ranz1964), who employed a rotating perforated plate fitted into a pipe to generate a swirling jet at the pipe’s exit, noted that the stagnation point associated with VB was always positioned downstream of the rotating plate, i.e. downstream of the swirl generating equipment. Qualitative features of VB have been captured by other studies which employ steady inflow conditions including Snyder & Spall (Reference Snyder and Spall2000), Ruith et al. (Reference Ruith, Chen, Meiburg and Maxworthy2003) and Ruith et al. (Reference Ruith, Chen and Meiburg2004).
Another concern regarding fixing the inflow profile occurs when it is subcritical, i.e. can support steady axisymmetric infinitesimal waves (Benjamin Reference Benjamin1962). The flow upstream of VB has predominantly been reported to be supercritical in various studies on VB in tube flows (e.g. Faler & Leibovich Reference Faler and Leibovich1978; Leibovich Reference Leibovich1984). For turbulent swirling jets, Oberleithner et al. (Reference Oberleithner, Paschereit, Seele and Wygnanski2012) have noted that the inflow is subcritical at swirls where VB was observed in time-averaged fields. The Maxworthy profile was found to be supercritical for
 $S<1.66$
(see § 6.1). Except for the wide-open CVB at
 $S=2$
(§ 4.2.3), all states of flow reported here occurred for
 $S$
lower than this value. The major focus of this study is on BVB and CVB which occurred within a small range of swirl above the critical value associated with the onset of VB, i.e.
 $S\in [1.39,1.6]$
and thus the use of steady inflow conditions in this range is deemed to be appropriate.
Appendix B. Comparisons with experiments
As introduced previously, Billant et al. (Reference Billant, Chomaz and Huerre1998) have reported qualitative features of various states experimentally observed for laminar swirling jets including that of CVB. Their investigation employed a converging nozzle through which the jet entered into a chamber of square cross-section. This led to variations in the axial velocity profile as a function of swirl imparted, requiring an additional control parameter dependent on the nozzle’s convergence ratio. To remove this dependence, Liang & Maxworthy (Reference Liang and Maxworthy2005) employed a short pipe of constant cross-section in place of the nozzle, although this led to mild non-uniformities in velocity and relatively stronger turbulence levels at the pipe outlet compared to a contracting nozzle. The authors chose a similar definition of swirl as that used here, but their
 $Re_{D}=1000$
(based on diameter) is well above that used here.
While better models for the inflow velocity field measured by Billant et al. (Reference Billant, Chomaz and Huerre1998) are available (Gallaire & Chomaz Reference Gallaire and Chomaz2003), the authors of the present study have opted to employ the simpler Maxworthy profile which models a steady laminar swirling jet exiting a non-contracting outlet with the axial velocity component unaffected by changes to swirl
 $S$
. Thus, it must be emphasized that there exist significant differences between this study and that of Billant et al. (Reference Billant, Chomaz and Huerre1998) with respect to the inflow profile. Despite this difference, many qualitative similarities exist. Although Billant et al. (Reference Billant, Chomaz and Huerre1998) chose a different definition for the swirl number compared to that used in this study, for the profiles studied here, both yield approximately the same value. For comparison, the Reynolds number definition chosen by Billant et al. (Reference Billant, Chomaz and Huerre1998) based on nozzle diameter is approximately twice that used here, with the range studied by these authors (
 $300<Re_{D}<1200$
) being similar to that in the current investigation (
 $Re=Re_{D}/2=200$
). Billant et al. (Reference Billant, Chomaz and Huerre1998) used two nozzles of exit diameters 25 and 40 mm and a tank with a square cross-section of side 40 cm implying a non-dimensional lateral length of 20 and 32 based on exit radius of nozzle, which is similar to the lateral dimensions of D20 and D40, respectively; it is much smaller compared to that of D80. The swirl integral chosen by Mourtazin & Cohen (Reference Mourtazin and Cohen2007),
 $Si$
, when applied for the Maxworthy profile used here, gives
 $Si=0.91$
, 0.98 and 1.05 for
 $S=1.39$
, 1.5 and 1.6, respectively. The Reynolds number range is comparable with
 $Re_{D}\in [150,600]$
.
Appendix C. Validation using results reported for Grabowski profile
The numerical code for spatio-temporal and the global linear stability analysis are validated using the results reported by Gallaire et al. (Reference Gallaire, Ruith, Meiburg, Chomaz and Huerre2006) and Qadri et al. (Reference Qadri, Mistry and Juniper2013), respectively. This is done for the Grabowski profile for
 $S=1$
,
 $\unicode[STIX]{x1D6FC}=1$
and
 $Re=200$
, with the base flow extracted from the quasi-steady state attained in numerical simulations for convenience. Furthermore, the frequency and growth rate computed from the simulations are compared with Ruith et al. (Reference Ruith, Chen, Meiburg and Maxworthy2003). Table 3 lists global complex frequency
 $\unicode[STIX]{x1D714}_{g}$
from all studies including the present study (see also Pradeep Reference Pradeep2019). It is evident that all reported quantities are satisfactorily predicted by the codes employed in this study.
Comparisons of global frequency
 $\unicode[STIX]{x1D714}_{g,r}$
and growth rate
 $\unicode[STIX]{x1D714}_{g,i}$
predicted in present study based on local (steep mode) and global linear stability analyses along with those extracted from numerical simulations (DNS) with those reported in studies of Gallaire et al. (Reference Gallaire, Ruith, Meiburg, Chomaz and Huerre2006), Qadri et al. (Reference Qadri, Mistry and Juniper2013) and Ruith et al. (Reference Ruith, Chen, Meiburg and Maxworthy2003) respectively for the Grabowski profile (
 $S=1$
,
 $\unicode[STIX]{x1D6FC}=1$
and
 $Re=200$
).

Appendix D. Pre-breakdown helical structures
While VB occurs for strong swirl strengths, jets exhibit certain intriguing behaviours even for weaker ‘pre-breakdown swirls’, where a stagnation point is not present (Billant et al.
Reference Billant, Chomaz and Huerre1998; Gallaire & Chomaz Reference Gallaire and Chomaz2003; Loiseleux & Chomaz Reference Loiseleux and Chomaz2003), including the development of a double-helical mode. Since the focus of this study is on VB, only a preliminary investigation in this swirl range was carried out employing the grid D40 (see table 1 and § 2.1.3). Helical instabilities were observed for these domain dimensions for
 $S\geqslant 1$
. Some of the results obtained are presented here for the sake of completeness using a representative swirl of
 $S=1.2$
. Further details can be found in Pradeep (Reference Pradeep2019).
Features of pre-breakdown flow state for
 $S=1.2$
at
 $t=5500$
: contours of axial velocity on (a) meridional plane and (b) cross-sectional plane at
 $x=25$
. An
 $m=-2$
mode was present, with a front located at
 $x\approx 20$
. Note that the jet at inflow swirls clockwise (§ 2.1.1).

A counter-rotating helical mode of
 $m=-2$
eventually dominated in the downstream regions of the flow as highlighted by figure 19, where contours of
 $u_{x}$
are shown to highlight similarities between the ‘trident’ state observed in experiments (see Billant et al.
Reference Billant, Chomaz and Huerre1998, figures 16, 18). However, in additional to the
 $m=-2$
mode, weak
 $|m|=4$
helical structures were also observed, which seemed to be generated due to the Cartesian grid employed (not shown) and corrupted the flow features.
The streamwise position of the upstream front of the
 $m=-2$
mode was found to be well downstream of the inflow plane (
 $x\approx 20$
). An axial momentum deficit was observed to develop in the core region close to the inflow plane, which acted as a precursor to stagnation point formation as discussed in § 4.1.1. For swirls just above the critical value where VB was observed (
 $S=1.39$
), the helical structures were positioned further downstream with
 $x\approx 20$
and were not observed for higher swirls in the domain chosen for study.
Appendix E. Additional details of stability analysis
Some additional details of the stability analysis performed in the present study are provided here, with the focus on the estimation of the linear global mode features from the local analysis for the case of
 $m=1$
and
 $S=1.5$
, which has been examined in § 5. Assuming a parallel flow, a temporal analysis (see (2.3)) was performed using base flow velocity profiles at a few different
 $x$
positions in the bubble and wake regions. Two temporal branches which were unstable for a range of axial wavenumber
 $k_{r}$
, were identified (not shown, see Pradeep Reference Pradeep2019). The dispersion relation,
 $\unicode[STIX]{x1D714}(k)$
, was computed for each by tracking the variation of
 $\unicode[STIX]{x1D714}$
with
 $k_{r}$
as the latter was varied in the range
 $[-3,3]$
in increments of 0.025. The local absolute frequency and wavenumber (
 $k_{0}$
and
 $\unicode[STIX]{x1D714}_{0}$
) are defined based on that point in the complex
 $k$
-space, at which the perturbation group velocity
 $\text{d}\unicode[STIX]{x1D714}/\text{d}k=0$
(a saddle) and the Briggs–Bers criterion is satisfied (Huerre & Monkewitz Reference Huerre and Monkewitz1990). To identify this, a rational function was used to fit the discrete dispersion relation,
 $\unicode[STIX]{x1D714}(k_{r},0)$
, and analytic continuation was used to extend it for
 $k_{i}\neq 0$
. Figure 20(a) shows contour lines of
 $\unicode[STIX]{x1D714}_{i}$
for that temporal branch which yielded the required saddle for
 $S=1.5$
, with the saddle highlighted using a ‘
 $+$
’ symbol. Starting from this estimate, Newton’s method was used to find the root of the equation
 $\text{d}\unicode[STIX]{x1D714}/\text{d}k=0$
, which involved solving (2.3) for different complex
 $k$
. After convergence to required accuracy of
 $(k_{0},\unicode[STIX]{x1D714}_{0})$
, it was visually confirmed that the two spatial branches,
 $k^{+}$
and
 $k^{-}$
(Huerre & Monkewitz Reference Huerre and Monkewitz1990), pinch at this saddle point, thus satisfying the Briggs–Bers condition. This is shown in figure 20(b). Streamwise variation of
 $\unicode[STIX]{x1D714}_{0}$
was evaluated next by using the computed value at a given
 $x$
as the initial guess for Newton’s method and repeating the procedure in neighbouring locations to find
 $\unicode[STIX]{x1D714}_{0}(x)$
at all streamwise stations of the base flow (figure 15
a). For the WKBJ analysis, a similar procedure was employed to analytically continue
 $\unicode[STIX]{x1D714}_{0}(x)$
in the complex
 $x$
-plane to identify a saddle satisfying
 $\text{d}\unicode[STIX]{x1D714}_{0}/\text{d}X=0$
, which is associated with the required global frequency
 $\unicode[STIX]{x1D714}_{g}$
. This is shown in figure 21(a). Additionally, the temporal spectrum computed directly using the linear global analysis (see (2.4)) is shown in figure 21(b) for
 $S=1.5$
,
 $m=1$
and grid resolution of
 $n_{x}=n_{r}=110$
.
Results from spatio-temporal analysis at
 $x=5$
for the case
 $S=1.5$
. (a) Contour lines of
 $\unicode[STIX]{x1D714}_{i}$
in complex
 $k$
-plane based on analytic continuation using a rational function. (b) Pinching of the
 $k^{+}$
(red curve) and
 $k^{-}$
(green curve) branches, as obtained from spatial analysis about the saddle point,
 $(k_{0},\unicode[STIX]{x1D714}_{0})$
. The saddle point is highlighted using a ‘+’.

(a) Contour lines of
 $\unicode[STIX]{x1D714}_{i}$
in complex
 $X$
-plane based on analytic continuation using a rational function:
 $+$
, saddle point. (b) The temporal spectrum obtained directly from a linear global analysis:
 $+$
, unstable eigenvalue. Both figures are for the case of
 $S=1.5$
.

Appendix F. Energy distribution among velocity components for unstable global mode at
$S=1.5$

Comparisons of energy distribution of velocity components between simulations and the unstable mode in global stability analysis for the case of
 $S=1.5$
are considered. The azimuthally averaged energy contribution of a component is defined as
 $$\begin{eqnarray}\displaystyle \bar{E}_{i}^{\unicode[STIX]{x1D703}}(x,r)={\textstyle \frac{1}{2}}\int _{0}^{2\unicode[STIX]{x03C0}}|u_{i}^{\prime }|^{2}r\,\text{d}\unicode[STIX]{x1D703};\quad i=x,r,\unicode[STIX]{x1D703}. & & \displaystyle\end{eqnarray}$$
Figure 22 compares the amplitude distribution of perturbation velocity components, defined as
 $u_{i}^{n}=\sqrt{\bar{E}_{i}^{\unicode[STIX]{x1D703}}}$
and conveniently normalized based on the maximum total energy achieved in the numerical simulations. This was determined to occur at a position of
 $x\approx 5.25$
and
 $r\approx 1.7$
. The figures corroborate previous inferences that the linear global mode closely resembles the nonlinearly saturated perturbation observed in simulations except in regions around the bubble.
Comparisons of azimuthally averaged normalized perturbation velocity components (a)
 $u_{r}^{n}$
, (b)
 $u_{\unicode[STIX]{x1D703}}^{n}$
and (c)
 $u_{x}^{n}$
computed from global analysis (left) and numerical simulations (right). All quantities were conveniently normalized with the maximum magnitude achieved on the entire domain. Results of linear global analysis match features of perturbation obtained from simulations quite well in the far-wake region, but not in the bubble’s vicinity.



