Introduction
Surface plasmons have great potential for shrinking light. Since a surface plasmon polariton (SPP) has a wavelength that is shorter than the wavelength of light in vacuum, SPPs allow for the miniaturization of optics: they have the potential to bring the dimensions of optical devices down to the dimensions of modern electronic integrated circuits.
This realization has led to large recent interest in this phenomenon and the promise of applications in sensing, optical circuits, spontaneous emission control, and solar cells. In recent years, many metal structures have been presented that guide, confine, and manipulate plasmons, and exploit their ability to shrink light. Plasmonic devices based on such metal structures aim to control the excitation of plasmons, their propagation, dispersion, confinement, and mode structure at a length scale that is much shorter than an optical wavelength.Reference Pelton, Aizpurua and Bryant1
For the application of these structures, it is important to characterize their performance by accessing surface plasmon modes at the nanoscale. Optical microscopy reaches down to ∼200 nm and often allows addressing individual plasmonic elements. However, the spatial resolution of optical microscopy is limited by diffraction, and a higher resolution technique is required to probe surface plasmon devices at nanometer length scales. Near-field techniques using very small tips offer a higher resolution (see the Weber and Willets article in this issue). Near-field scanning optical microscopy (NSOM) is able to reach down to ∼50 nm, and apertureless or scattering-type NSOM allows access to the sub-15 nm scale.Reference Hillenbrand, Keilmann, Hanarp, Sutherland and Aizpurua2 However, these techniques suffer from challenging experimental conditions (e.g., single wavelength performance, stability, background noise) as well as interaction between the tip and the sample.Reference Burresi, Kampfrath, Oosten, Prangsma, Song, Noda and Kuipers3, Reference Koenderink, Kafesaki, Buchler and Sandoghdar4
In contrast to excitation of plasmons through photons in optical microscopy, surface plasmons can be directly excited by fast electrons. In fact, the first signatures of surface plasmons were obtained using electron beam experimentsReference Powell and Swan5, Reference Teng and Stern6 in the 1950s and 1960s. Since an electron incident on a metal surface functions as a point source for surface plasmons, an electron microscope, through excitation of surface plasmons, can thus open up ways to characterize plasmon devices with a resolution only limited by the size of the electron beam. Modern electron microscopes, either scanning electron microscopes (SEMs) or transmission electron microscopes (TEMs), routinely produce electron beams that are focused to subnanometer dimensions. In these systems, an electron beam offers a convenient way of coupling to plasmons at a resolution that is much higher, without suffering from the limitations of optical (near-field) microscopy. Due to recent advances in nanofabrication and electron microscope performance and detection equipment, excitation with an electron beam has become increasingly important as a characterization method for plasmonic devices at deep subwavelength resolution. This is illustrated by the increased number of publications over the last few years on increasingly complex geometries.Reference García de Abajo7
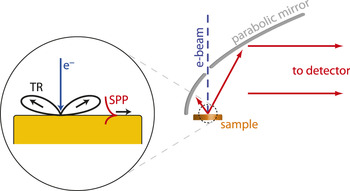
An electron beam incident on a metal surface can be positioned very accurately in an electron microscope (see schematic in Figure 1). At this exact position, incoming electrons couple to SPPs as well as free-space light (transition radiation, TR). Excitation by the electron beam is similar to excitation by a broadband dipole source positioned at the impact position on the interface,Reference Kuttge, Vesseur, Koenderink, Lezec, Atwater, García de Abajo and Polman8, Reference Coenen, Vesseur and Polman9 a property that forms the basis for the success of e-beam excitation. We note that in the case of multiple interfaces, the electron beam can also be used to excite hybrid modes.Reference Kuttge, García de Abajo and Polman10–Reference Cai, Sainidou, Xu, Polman and García de Abajo12
Coupling of an electron beam to surface plasmons. The electron beam couples to optical modes in a way that is similar to a vertical dipole that is positioned at the metal interface. A parabolic mirror is used to collect the emission into a spectroscopic detector. TR, transition radiation; SPP, surface plasmon polariton.Reference Vesseur52

In order to exploit this local dipole source for studying plasmonic properties at the impact position, several experimental techniques are available. Electron energy loss spectroscopy (EELS) measures the energy loss of the beam that is transmitted through a thin sample in a TEM.Reference Ritchie13–Reference Ferrell and Echenique15 Peaks in the energy loss spectrum represent coupling of the electron beam to surface and bulk plasmons. EELS has recently been used to measure the (time-resolved) resonant properties of nanoscale metallic particles.Reference Bosman, Keast, Watanabe, Maaroof and Cortie16–Reference Yurtsever, van der Veen and Zewail19
A technique complementary to EELS, and the major subject of this article, is cathodoluminescence (CL) spectroscopy, usually used in an SEM, in which the emitted light is detected. This light originates from surface plasmons that are converted to free-space light, as well as direct transition radiation. In contrast with EELS, CL spectroscopy is able to resolve the polarization and the angular emission profile; it is also suitable for thick samples. EELS on the other hand allows for the observation of non-radiant dark modes.Reference Chu, Myroshnychenko, Chen, Deng, Mou and García de Abajo20
Figure 1 shows a typical CL setup with a parabolic mirror positioned above the sample that collects the emission and subsequently guides it to a detector. The sample is excited by the electron beam, which typically provides several nA of 30 keV electrons. Even though dwell times up to a second are used, the excitation of plasmons by the electron beam does not induce damage to metal structures.
Finally, coupling of an electron beam to plasmon modes becomes apparent through induced forces on metallic nanostructures. This article presents results from experiments exploiting these effects.
Excitation of propagating SPPs
The excitation of propagating plasmons by an electron beam is best illustrated by an experiment in which the propagation length of SPPs is measured as they propagate over a metal film.Reference Kuttge, Vesseur, Verhoeven, Lezec, Atwater and Polman21 Due to several processes, plasmons are subject to decay. In the spectral region near the surface plasmon resonance, where plasmons are most dispersive and show the highest field strengths, absorption of plasmon energy in the metal is important and of interest. Losses can also be attributed to scattering processes, caused by surface roughness and crystal boundaries. To obtain efficient plasmonic devices that manage and reduce undesired losses, it is essential to characterize the losses of propagating plasmons on different metal interfaces at different wavelengths.
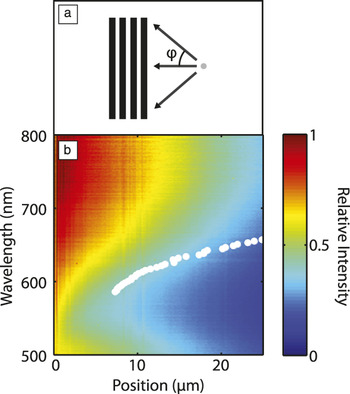
The electron beam presents us with a method to accurately measure the decay length of plasmons as they propagate. Plasmons excited by an electron beam, which are emitted radially from the impact position, are lost through absorption unless they are converted to free space light by, for example, a grating. The intensity of the light from the grating depends on the distance that the SPPs have traveled from the electron beam impact position to the grating. Figure 2 shows results from an experiment performed on a single-crystalline Au film in which a 400-nm pitch grating is patterned. Figure 2a schematically shows how plasmons excited near the grating will travel toward the grating, where they are coupled out.Reference van Wijngaarden, Verhagen, Polman, Ross, Lezec and Atwater22, Reference Bashevoy, Jonsson, Krasavin and Zheludev23 Using the setup of Figure 1, the emitted intensity from the sample is detected, consisting of radiation from the grating plus a constant TR background. Figure 2b shows the normalized intensity for a line scan close to the grating as a function of position and detection wavelength. The edge of the grating is located on the left side at zero distance. The figure shows that the emitted intensity decreases with increasing distance, which is true for every wavelength. The decrease in CL intensity is weaker for longer wavelengths, corresponding to a larger propagation length into the red part of the spectrum. The decay lengths of plasmons on this single-crystalline Au surface were fitted with exponential functions that take the azimuthal nature of the plasmon wave into account, yielding the values indicated with white dots in Figure 2b.
Measurement of plasmon decay using an electron beam. (a) Schematic drawing of surface plasmon polaritons (SPPs) propagating from the source to the grating with broadly varying incidence angle φ. (b) Cathodoluminescence (CL) intensity as a function of detection wavelength and distance to a grating in a single-crystalline gold surface. The edge of the grating is at zero distance. The CL intensity was normalized to the intensity at zero distance for each wavelength. The white dots show the fitted SPP propagation length L SPP for this sample. Reproduced with permission from Reference Reference Kuttge, Vesseur, Verhoeven, Lezec, Atwater and Polman21. ©2008, American Institute of Physics.

Electron beam excitation thus presents a method to measure the propagation length of plasmons on metal surfaces for a broad range of wavelengths. On polycrystalline films, where grain boundary scattering plays an important role, propagation lengths can be much shorter. Excitation with an electron beam was successfully used to measure such short propagation lengths (down to ∼1μm) and distinguish between losses originating from grain boundary scattering, scattering from roughness, and absorption.Reference Kuttge, Vesseur, Verhoeven, Lezec, Atwater and Polman21
In this experiment, TR was only considered a constant background in the CL emission. However, since direct TR and surface plasmons are generated in a coherent fashion, these two channels can be expected to interfere in the far field. In carefully carried out experiments, such interference was indeed observed.Reference Kuttge, Vesseur, Koenderink, Lezec, Atwater, García de Abajo and Polman8
Excitation of confined SPPs: Standing plasmon waves
Most plasmonic devices rely on localized resonances rather than propagating plasmons. Here, the true potential of electron beam excitation can be utilized due to its high spatial resolution.
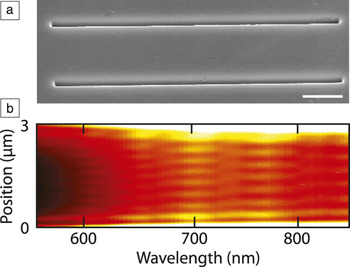
A simple plasmon resonator is shown in Figure 3a. This plasmonic Fabry–Pérot resonator consists of two grooves separated by 3 μm in an otherwise planar single-crystalline Au surface. Resonances are set up by plasmons traveling back and forth as they are reflected by the grooves.Reference Hofmann, Vesseur, Sweatlock, Lezec, García de Abajo, Polman and Atwater24 These plasmon resonances can be excited by the electron beam when it is positioned between the grooves. The grooves are not perfect reflectors: incident plasmons are partly transmitted and partly coupled to free-space radiation. The light emission provides a method to obtain insight into the plasmon resonances of this cavity. Figure 3b shows the results of an experiment in which the electron beam is scanned between the grooves, using the detection setup in Figure 1.Reference Kuttge, Vesseur and Polman25 The beam was scanned in 5-nm-steps with a dwell time of 1s. For each position, the emitted cathodoluminescence spectrum was recorded. The figure clearly shows that the emission from the cavity is dependent on electron beam position, whereas the metal surface here shows no features at all. At 700 nm, 8 emission maxima are encountered as the beam scans over the cavity; at 770 nm, there are only 7. These undulations in the emission are attributed to standing plasmon waves that are only excited when the electron beam dwells at its antinodes. Indeed, for a longer detection wavelength, fewer maxima are observed because fewer half-wavelengths fit in the resonator.
Resolving standing waves in a Fabry–Pérot resonator for surface plasmons. (a) Scanning electron micrograph of a plasmon resonator in single-crystalline Au. (b) Cathodoluminescence emission as a function of position and wavelength showing discrete plasmon resonances with resonance order 6 to 10. Data were taken in a line scan across a plasmon resonator with center-to-center groove separation w = 3000 nm. Reproduced with permission from Reference Reference Kuttge, Vesseur and Polman25. ©2009, American Institute of Physics.

The fact that a plasmon resonance is most efficiently excited at the antinodes of the electric field shows that the electron beam maps out the resonant field. This is a very important result for applications in plasmonics. The effect is directly linked to the local density of optical states (LDOS).Reference Kuttge, Vesseur, Koenderink, Lezec, Atwater, García de Abajo and Polman8 The electron beam, incident from the top, behaves as a source coupled to local modes according to the vertical component of the LDOS.Reference Zhu, Ma, Zhang, Xu, Wu, Zhang, Han, Fu, Liao, Chen and Yu26, Reference Kuttge, Cai, García de Abajo and Polman27
The field antinodes are spaced by a half-wavelength distance. As a consequence, the CL emission directly shows the wavelength of the resonant surface plasmon. In addition to the spatial profile, the resonance frequencies and line widths are directly derived from the emission spectra. A combination of these data allows determination of the modal dispersion relation.Reference Kuttge, Cai, García de Abajo and Polman27 Many other quantities can also be derived, such as, in this case, the Q factor of the Fabry–Pérot cavity (Q = 21 at 750 nm).
Plasmon resonators in which plasmons are further confined can be based on plasmon waveguides, such as strips,Reference Barnard, Coenen, Vesseur, Polman and Brongersma11 wires,Reference Ditlbacher, Hohenau, Wagner, Kreibig, Rogers, Hofer, Aussenegg and Krenn28 or multilayer stacks.Reference Miyazaki and Kurokawa29 When these waveguides are terminated at two ends, plasmon resonances are set up as a result of reflection. An example of this is a nanowire with a length comparable to the wavelength. In recent literature, these resonators are often called nanoantennas, due to the resemblance with their radio frequency counterparts. Nanoantennas provide coupling of far field light to a nanoscale volume.Reference Novotny and van Hulst30 Vice versa, the emission of localized emitters can be amplified and directed into a well-defined angle.
The use of an electron beam provides an excellent method to investigate the coupling of a local source to a nanoantenna. Exploiting this feature makes the e-beam a great nanoantenna characterization tool.
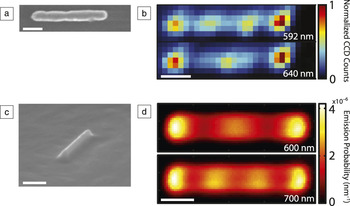
Figure 4 presents electron beam scans on two types of antennas.Reference Vesseur, de Waele, Kuttge and Polman31, Reference Vesseur, de Waele, Lezec, Atwater and García de Abajo32 Compared to the Fabry–Pérot resonator of Figure 3, these antennas confine plasmons in one more direction. The electron beam must now be scanned in a two-dimensional grid to obtain a map of the spatial extent of the antenna resonances.
Standing plasmon waves on optical nanoantennas. (a) Scanning electron micrograph of a polycrystalline Au nanoantenna. (b) Cathodoluminescence emission from the antenna in (a) at 592 and 640 nm. Reprinted with permission from Reference Reference Vesseur, de Waele, Kuttge and Polman31. ©2007 American Chemical Society. (c) Single-crystalline Au ridge nanoantenna. Reprinted with permission from Reference Reference Vesseur, de Waele, Lezec, Atwater and García de Abajo32. ©2008, American Institute of Physics. (d) Cathodoluminescence emission at 600 and 700 nm. Reprinted with permission from Reference Reference Coenen, Vesseur and Polman39. ©2012, American Chemical Society. Scale bars: 200 nm. CCD, charge-coupled device.

The scanning electron micrograph in Figure 4a shows an Au nanoantenna consisting of a 80-nm radius rod. Figure 4b shows spectral scans on this antenna. The electron beam is scanned in 7 by 30 pixels; for each excitation position, the emission is spectrally detected. In this figure, only the emission at two wavelengths is shown. The antenna emission at 592 nm shows four emission maxima, while at 640 nm, we observe three.
The antenna in Figure 4c consists of a ridge that extends from an Au surface. A plasmon mode is confined to the top of the ridgeReference Vesseur, de Waele, Lezec, Atwater and García de Abajo32 and reflects at its ends. The two-dimensional scans (Figure 4d) also show that on this ridge antenna, resonances are set up with increasing number of antinodes along the ridge.
The scans on these nanoantennas show the spatial extent of the plasmon modes and reveal the wavelength of plasmons propagating along the antenna. Note that both even (zero dipole moment) and odd modes are excited by the electron beam. Modes with zero dipole moment are not excited by light under normal incidence, but, as the data shows, the electron beam does not suffer from such coupling issues.
Similar to these antenna resonances, excitation with the electron beam is able to reveal standing plasmon waves on many other types of structures, including coupled antennasReference Denisyuk, Adamo, MacDonald, Edgar, Arnold, Myroshnychenko, Ford, García de Abajo and Zheludev33 and square resonator geometries.Reference Zhu, Ma, Zhang, Xu, Wu, Zhang, Han, Fu, Liao, Chen and Yu26, Reference Kuttge34
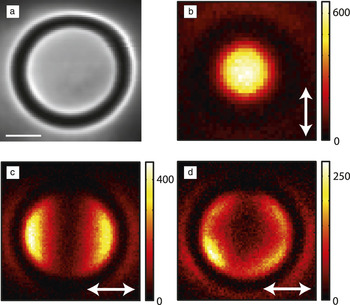
Whereas Figure 4 shows confinement through reflection at the waveguide ends of a linear antenna, plasmon waveguides also allow for tight confinement in the small volume of a circular waveguide by so-called whispering gallery resonances.Reference Vesseur, Garcia de Abajo and Polman35 A plasmonic whispering gallery resonator based on a circular V-groove is shown in Figure 5a. The resonator has a circumference that is on the order of a few plasmon wavelengths. Due to plasmons confined to the V-groove,Reference Bozhevolnyi, Volkov, Devaux, Laluet and Ebbesen36 a number of discrete ring resonances are set up for which an integer number of wavelengths fits in the circumference. These plasmon resonances can be excited by the electron beam.Reference Vesseur, Garcia de Abajo and Polman35 The spatial profile of these resonances can be resolved, but the resonances are twofold degenerate due to the circular symmetry, so an isolated picture of a mode is not obtained by a two-dimensional spectral image as in Figure 4.
Polarization-resolved cathodoluminescence detection in scans of a plasmonic whispering gallery resonator. (a) Scanning electron micrograph of a surface plasmon whispering gallery resonator, consisting of a circular groove in an Au substrate (scale bar: 200 nm). By using polarized cathodoluminescence detection (indicated by the white arrows), the excitation maps of a vertical dipole (b), an in-plane dipole (c), and a quadrupolar mode (d) can be distinguished. Color scales indicate charge-coupled device counts. Adapted with permission from Reference Reference Vesseur and Polman37. ©2011, American Chemical Society.

The degeneracy can be lifted by polarized detection.Reference Vesseur and Polman37Figure 5 shows polarized measurements of different resonant modes with increasing azimuthal order. From the spatial profile of the excitation maps in Figure 5, we can distinguish between an upward pointing dipolar mode with circular symmetry (Figure 5b), a dipolar mode with the dipole oriented along the surface of the substrate (Figure 5c), and a quadrupolar mode (Figure 5d). These mode orders are directly connected to the number of wavelengths that fit in the circumference.
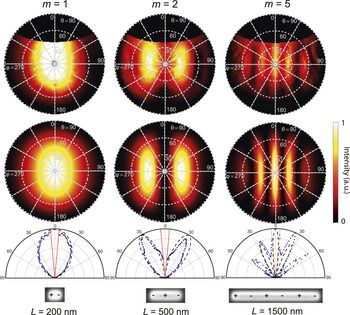
For the successful operation of an antenna, such as the wire, ridge, or ring antennas of Figures 4 and 5, it is critical to control the angular emission profile. This profile depends on the antenna but also on the position of the emitter that is coupled to the antenna.Reference Coenen, Vesseur, Polman and Koenderink38 Unlike quantum dots, dye molecules, or nitrogen-vacancy-centers, the electron beam source can quickly be positioned at will and is broadband. This makes it an ideal technique to study the angular properties of antennas in great detail. In our setup, an angle-resolved detection systemReference Coenen, Vesseur and Polman9 measures the emission profile of a single antenna upon excitation with an electron beam. By spectrally filtering the antenna emission, a resonant mode is selected, and the corresponding emission profile is observed. Figure 6 shows the angular profile of ridge antennas (similar to Figure 4c) for increasing mode order.Reference Coenen, Vesseur and Polman39 From these results, we can learn several things. First of all, we see in which directions light is emitted for different antenna lengths, which is important when applying such structures in an optical sensing device for instance. Furthermore, we observe that the even order standing wave resonances do not emit toward the normal. From reciprocity, we can conclude that it is indeed impossible to excite these resonances with light under normal incidence. Finally, we find that such antennas can be accurately described as two radiating sources at the end facets, since the confined ridge mode can only couple to free space at these points.
Measured angle-resolved antenna emission patterns (top row) and calculated emission patterns (second row). The antennas are oriented horizontally. Azimuthal (θ) and polar (φ) angles are indicated. The third row shows cross cuts through measurements (blue dots) and calculations (black dashed line) along φ = 90, and 270˚, showing emission patterns for resonances with order m = 1, 2, and 5, collected from ridges with different lengths L (see scanning electron microscopy [SEM] images in the bottom row). In the SEM images, we have also indicated snapshots of the charge distributions corresponding to each resonance. From left to right, the measurements were collected at wavelengths λ = 550, 600, and 650 nm. The angular range that is not collected by the mirror because of the hole as indicated by the red curves (θ < 5˚). Reproduced with permission from Reference Reference Coenen, Vesseur and Polman39. ©2012, American Chemical Society.

The results obtained on the resonators presented here can be extended to more complex geometries such as coupled structures,Reference Kuttge, García de Abajo and Polman10, Reference Frimmer, Coenen and Koenderink40 other nanoparticle shapes,Reference Chaturvedi, Hsu, Kumar, Fung, Mabon and Fang41 or plasmonic crystals.Reference Takeuchi and Yamamoto42
Excitation and manipulation of particle resonances: Nanobilliards
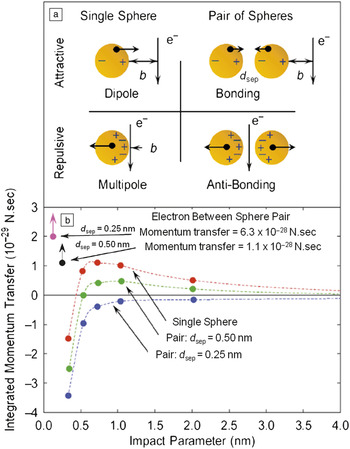
The ability of swift electrons to excite localized plasmons produces an ideal platform to generate forces acting on the particles. Charged particles traveling in the proximity of metallic structures are known to produce longitudinal and transverse forces as a result of the interaction between the oscillating surface charges induced at the metal surface (surface plasmons) and the incoming charge acting as a probe. A particularly interesting effect is achieved when the target structures are nanoscale metallic particles of finite size, and the probing charges are the swift electrons commonly used in the scanning transmission electron microscope (STEM). As pointed out in the previous sections, the nature and intensity of the localized surface plasmons produced at the particles depends strongly on the impact parameter, b, of the incoming electron, defined as the transversal distance between the particle and the ultranarrow electron beam. Depending on the particular nature of the localized modes induced in a particle or set of particles, a rich variety of forces can be acting on the particles. A simple and basic chart of the main induced charge density patterns and the corresponding forces produced by the swift electrons for different canonical situations are shown in Figure 7a. When the electron beam passes near an isolated nanoparticle, the ratio between the impact parameter, b, and the particle radius, R, determines the probability of exciting different 1-order modes.Reference Ferrell and Echenique15 For relatively large impact parameters, the particles respond according to the small-particle limit, producing a dipolar localized surface plasmon excitation (top left schematic in Figure 7a). In such a case, a small attractive force toward the electron beam is produced. When the impact parameter becomes smaller, the electron is said to pass in an aloof trajectory: passing, but not intersecting the surface of the particle. In an aloof configuration, higher-order multipolar plasmons are excited at the particle due to the strongly localized excitation close to the surface (bottom-left schematic in Figure 7a). The different nature of the modes excited has large implications for the forces generated on the particles. The dipolar surface plasmon interacts with the passing electron with an attractive force, thus producing a motion of the particle toward the electron beam. Surprisingly, coherent excitation of high-order modes by the aloof electron beam results in a repulsive force that pushes the particle away from the electron beam.Reference Reyes-Coronado, Barrera, Batson, Echenique, Rivacoba and Aizpurua43 Because the repulsive force gets much stronger as the beam approaches, small beam movements should elicit very large forces. On the other hand, the variation of the attractive force with distance is weak, so the particle location is only weakly controlled by the probe position. This situation opens the door to a reversible control of forces acting on particles, providing a simple recipe to manipulate particles on demand simply by modifying the separation distance between the particle and electron beam.
Chart of forces induced by a swift electron beam for different impact parameters and different configurations. (a) Schematics of the surface charge densities induced by electron beams in different situations: (left) electron beam passing in an external trajectory close to a single particle with a large (top) and small (bottom) impact parameter b. Right, electron beam passing in an external trajectory close to a metallic dimer (top) and at a central trajectory (bottom). Interparticle distance is indicated by d sep. (b) Momentum transferred by a swift electron beam to the set of configurations presented in (a): a single sphere (red curve), a pair of particles in external trajectory (green and blue curves), and a pair of particles in central trajectory (violet and black dots). A variety of forces are available within the presented scheme. Reproduced with permission from Reference Reference Batson, Reyes-Coronado, Barrera, Rivacoba, Echenique and Aizpurua51. ©2011, American Chemical Society.

A calculation of the impulse produced at a single metallic gold nanoparticle for a 100 keV electron beam with large and small impact parameters is shown in Figure 7b, as a red line, showing this reversal of the force when the large impact parameter (small attractive force) and the small impact parameter (larger repulsive force) are compared. The reversal of the force is produced for impact parameters of the order of the size of the nanoparticle in small particles.
A very interesting situation is produced when a particle is located in proximity to other particles. In such a situation, the localized surface plasmons induced at the particles interact via Coulomb fields, producing hybridized modes of lower energy commonly known as bonding dimer plasmons.Reference Batson14, Reference Prodan, Radloff, Halas and Nordlander44
The surface charge density associated with these low-energy hybridized modes is characterized by a pile up of surface charge density of a different sign at each side of the gap between particles. These positive and negative charge densities produce strong attractive forces between the particles, as illustrated in the top-right panel of Figure 7a. The bonding mode is also representative of the class of modes that gives rise to large localized field enhancements in field-enhanced spectroscopies, such as in surface-enhanced Raman spectroscopy.Reference Xu, Bjerneld, Käll and Börjesson45, Reference Xu, Aizpurua, Käll and Apell46 If the electron beam is located in between the particles, it is possible to excite an antisymmetric solution of modes at a higher energy. This mode is characterized by surface charge densities of the same sign at both sides of the particle’s gap. In such a situation, a large repulsive force between the particles is produced, as schematically depicted at the bottom-right in Figure 7a.
The calculation of the impulse produced at a particle in close proximity to another one is presented in Figure 7b (green and blue dashed lines) for external trajectories. As the particles come closer together, the bonding plasmon is more effectively excited, thus pushing the particles toward each other and away from the electron beam, forcing them to coalesce. This effect can be observed, for example, in the repulsive force produced at the pair of particles for very small separation distance (d sep = 0.25 nm), marked by a blue line.
The calculation of the force induced at the particles for a central electron trajectory is shown in Figure 7b (violet and black dots), producing a repulsive force that pushes the particles apart. The repulsion is stronger as the particles get closer (larger impulse transfer for smaller separation distance d). The calculation of the impulse suffered by metallic particles in the interaction with swift electrons supports the scheme of forces presented in Figure 7a.
Nevertheless, the nature of the force (repulsive or attractive) is a result of a delicate balance between impact parameter and inter-particle separation. Certain impact parameters with relative large separation distances between particles might put more emphasis on the single particle force, whereas other impact parameters and/or separation distances might trigger the activation of bonding and/or antibonding plasmons, thus reversing the nature of the force.
The possibility of governing the motion of nanoscale objects, including particles, molecules, and supramolecular entities with aloof electron beams on demand, sets a powerful framework for nanomechanical engineering and nanoscale positioning control. Even though electron energy loss spectroscopy and cathodoluminescence have been explored in metallic particles,Reference Nelayah, Kociak, Stéphan, García de Abajo, Tencé, Henrard, Taverna, Pastoriza-Santos, Liz-Marzán and Colliex17, Reference Vesseur, de Waele, Kuttge and Polman31, Reference Batson47–Reference Yamamoto, Ohtani and García de Abajo50 the forces associated with the excitation of plasmons have been the object of much less attention. One of the reasons for this is the tough experimental challenges encountered to control and envision particle motion simultaneously. Recently, control of the electron beam positioning with exquisite resolution of the particle motion has made it possible to govern the impact parameter of the electron beam with respect to the particles in a controlled manner and trace the corresponding motion of the nanoparticle.Reference Reyes-Coronado, Barrera, Batson, Echenique, Rivacoba and Aizpurua43
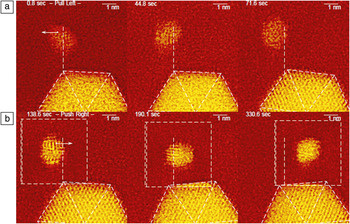
We can verify the single particle theoretical findings above by observing the motion of nanoscale Au particles in the STEM.Reference Batson, Reyes-Coronado, Barrera, Rivacoba, Echenique and Aizpurua51 This instrument produces images by scanning a 100 keV electron beam in a raster fashion, from left to right and top to bottom. In the VG microscopes STEM used in this study, the electron beam is also stopped briefly at the beginning of each scanning line, producing additional beam intensity at the left edge of the image. In the top panels of Figure 8, this additional intensity lies approximately 4.5 nm to the left of the 1.5 nm particle, out of the field of view. In the bottom panels, the scanned area is indicated by the dashed square, so that the additional beam intensity lies about 1 nm to the left of the smaller particle. In these experiments, documentation of the movement of the small particle is difficult, requiring use of a larger nearby particle as a fiducial mark. This introduces the complication that inter-particle plasmon forces are possible. Therefore in this example, the scanned area has been carefully oriented to balance bonding and anti-bonding dimer forces between the two particles to reveal the movement of the 1.5 nm particle under the influence of the electron beam alone.
Top: From left to right, sequence of the pulling motion of a gold nanoparticle by an area of larger beam current density located to the left of the panels at a relatively large impact parameter. The white dashed lines serve as a positioning reference. Bottom: From left to right, pushing motion of a gold nanoparticle by extra electron density at a small impact parameter. The larger particle serves as a relative positioning reference. Reproduced with permission from Reference Reference Batson, Reyes-Coronado, Barrera, Rivacoba, Echenique and Aizpurua51. ©2011, American Chemical Society.

Conclusion
With the advances described, an electron beam proves to be an excellent external probe, complementary to optical excitation, to access surface plasmon losses in metallic nanostructures, their dispersion, and the local density of states with extremely high spatial resolution. In combination with optical collection, such as in cathodoluminescence, it is possible to routinely access the emission properties of surface plasmons, as well as explore the degree of confinement of particular plasmons and their dependence on particular geometrical features of novel structures. Furthermore, electron beams are introduced as possible candidates to control and manipulate polarizable nano-objects, including metallic nanoparticles and molecules, opening a new path to mechanical control of mechanical motion at the nanoscale.
Acknowledgments
Martin Kuttge is acknowledged for providing article figures. This work is part of the research program of the “Stichting voor Fundamenteel Onderzoek der Materie (FOM),” which is financially supported by the “Nederlandse Organisatie voor Wetenschappelijk Onderzoek (NWO).” P.E.B. acknowledges financial support from the Basic Energy Sciences Division of the US Department of Energy, Award #DE-SC0005132. J.A. acknowledges financial support from the project FIS2010-19609-C02-01 of the Spanish Ministery of Science and A.R.C. acknowledges Consejo Nacional de Ciencia y Tecnología of Mexico and Benemérita Universidad Autónoma de Puebla.