

INTRODUCTION
Mangrove forests occur on sheltered tropical coastlines throughout the world. They provide vital ecosystem services including waste processing, habitat, food production and recreation, and contribute to energy flow between land and sea (Mumby et al., Reference Mumby, Edwards, Arlas-Gonzalez, Lindeman, Blackwell, Gall, Gorczynska, Harborne, Pescod, Renken, Wabnitz and Llewellyn2004; Blaber, Reference Blaber2007). The structure of mangrove trees, trunks, and prop roots provide fish with protection from predation, while at the same time, they enhance sedimentation rates and lateral trapping of suspended particles, which is important for the settling of fish larvae (Kathiresan & Bingham, Reference Kathiresan and Bingham2001). Leaves and epiphytes form the basis of the food web within mangrove systems and support high primary production and production of leaf litter (Kathiresan & Bingham, Reference Kathiresan and Bingham2001). Many fish species enter estuaries as post-larvae and juveniles after spending the larval stage in offshore waters, where the adults spawn (Dankwa & Gordon, Reference Dankwa and Gordon2002). Mangroves and associated creek systems provide breeding, feeding and recruitment areas for a wide variety of marine fish species (Sheridan & Hays, Reference Sheridan and Hays2003), and hence are critical sustaining habitats. Mangrove wetlands provide estuarine residents, marine and freshwater transient species with essential food and shelter resources (Laegdsgaard & Johnson, Reference Laegdsgaard and Johnson2001). Shervette et al. (Reference Shervette, Aguirre, Cevallos, Gonzalez, Pozo, Blacio and Gelwick2007) indicated that 36 species belong to 16 families in mangrove creeks in Palmar, Ecuador.
Higher commercial catches are reported to be associated with mangrove habitats in many parts of the world (Hamilton & Snedaker, Reference Hamilton and Snedaker1984; Singh et al., Reference Singh, Chong, Sasekumar, Lim, Wilkinson, Suraphol and Chou1994). At the same time, a number of direct and indirect evidences support the idea that mangroves increase the biomass of fish and fisheries yields in adjacent habitats (Manson et al., Reference Manson, Loneragan, Skilleter and Phinn2005b; Aburto-Oropeza et al., Reference Aburto-Oropeza, Ezcurra, Danemann, Valdez, Murray and Sala2008). The worldwide fishery is of immense importance and most of the people in the coastal region earn their living from yield of their catch. Because of this, fishing methods were improved and modernized in order to maximize yield per unit effort especially with the increase in demand as a result of the rapid rise in world population. This study was carried out to monitor fish communities and compare the traditional fisheries methods in Hara Biosphere Reserve (HBR), Khuran Strait, in the northern Persian Gulf.
MATERIALS AND METHODS
Study area
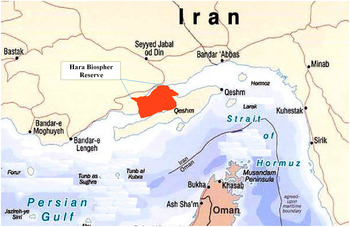
Hara Biosphere Reserve covering an area of 85686 hectares is located between longitude 55°21′ and 55°50′E and latitude 26°40′ and 26°59′N on the southern coast of Iran. This site was added to the Man and the Biosphere Programme in 1975 (IDEO, 2000). Figure 1 shows the location of HBR. There are reported to be more than 211 strait creeks in this region (Dehghani, Reference Dehghani2009). The Strait of Khuran with an area more than 100000 hectares was designated as an ‘International Lagoon’ by the Ramsar Convention in 1974 (Harrington, Reference Harrington1976).
Location of the Hara Biosphere Reserve situated in the northern Persian Gulf.

Hara Biosphere Reserve was recorded in the list of protected areas of Iran in 1981 (IDEO, 2000). Many coastal wetlands and other estuarine habitats, mudflats, shallow waters, many small islands, vast intertidal zones, freshwater inflow estuaries and mangrove forests coverage, have created an appropriate area for habitat, reproduction, nutrition and growth of migrant and indigenous aquatics. In fact, this is a vast nursery for aquatic animals. More than 24 villages, as well as a city are located on the periphery of coastline and mangrove forests where the inhabitants mostly spend their lives fishing. There are different methods of fishing in this region because of the ecological, economic and social conditions in particular, as well as the location of fishing regions and habitats.
Methodology
This study was conducted in two stages. In the first stage, identification of aquatic organisms was done. For this purpose samples were taken of three fisheries methods (trawling, stake net and gillnet) at 6 positions located in the northern, southern and central part of HBR. Then, the fish were classified based on species. In addition, some parameters including dissolved oxygen, pH, salinity, electrical conductivity and turbidity were measured according to standard methods (APHA, 2005).
The second stage of the study involved comparison of abundance (number of fish collected in catch per unit effort (CPUE)) and weight of fish (weight of fish collected in CPUE) using various fishing methods. Fishing is considered as the most crucial economic component along the coastal regions of the study area. Inhabitants of this area apply three methods of fishing:
-
1) The stake net method (Moshta in local language), is a form of net for catching fish in shallow inter-tidal zones. It consists of a sheet of network stretched on stakes fixed into the ground, generally in sea ebbs and flows, for entangling and catching the fish. In order to evaluate this method, 31 stake nets distributed in appropriate conditions throughout the HBR were sampled.
-
2) The gillnet method catches fish in their estuary. Gillnet is carried out through a net installed in the inlet of an estuary, so that it traps the fish during ebb. To evaluate this method, 29 gillnets were studied using a sampling process.
-
3) Trawling is a method of fishing that involves pulling a net through the water behind one or more boats. Results of sampling of 43 hauls in the region were recorded.
Sampling of all three above-mentioned methods was done randomly during February, May, August and November in 2008. Therefore, there were a total of 103 samples (31 stake nets, 29 gillnets and 43 trawling).
Average frequency of each method was calculated based on species diversity and average weight of fish in grams. Moreover, standard deviation of all averages was identified in repeated sampling. In order to compare the weights of the fish as well as frequency of captured fish in three defined methods, the t-test and ANOVA statistical analysis were applied.
RESULTS
Water quality
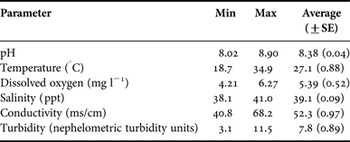
Water quality parameters were sampled 4 times and results showed that maximum and minimum temperatures measured in August and February were 34.9°C and 18.7°C, respectively. Average water temperature during 1 year was calculated as 27.1°C (Table 1). In addition, average dissolved oxygen content in surface water was 5.39 mg/l which decreased to 4.21 in August. Average water pH was 8.14 and salinity varied between 38.1 and 41.0 ppt. Average electrical conductivity was measured 52.3 ms/cm. As shown in Table 1, maximum and minimum water turbidity was calculated as 11.5 and 3.1 nephelometric turbidity units. Also average water depth in the sampling area was 1.9 m (±0.1).
Average maximum (Min) and minimum (Max) measured of parameters in surface water.

Aquatics
IDENTIFIED AQUATIC ORGANISMS
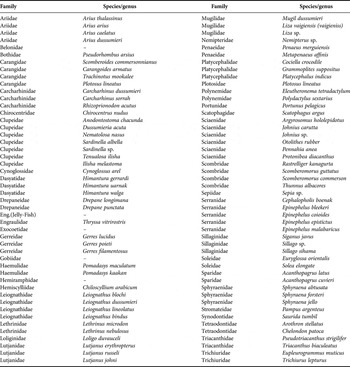
Sampling of aquatic inhabitants in HBR detected 43 different families (Table 2). Amongst the detected families, Clupeidae, Sciaenidae and Serranidae, with 7, 6 and 5 species respectively showed the highest diversity. Whereas, among them 4 species were from the Ariidae, Carangidae, Leiognathidae and Scombridae families; 3 species were from the Dasyatidae, Gerreidae, Lutjanidae, Mugilidae, Platycephalidae, Sillaginidae, Sphyraenidae and Carcharhinidae families; 2 species from the Drepaneidae, Haemulidae, Lethrinidae, Penaeidae, Trichiuridae, Polynemidae, Soleidae, Sparidae, Tetraodontidae and Triacanthidae families were also observable. Other families possessed only one species.
Identified aquatic organisms in Hara Biosphere Reserve.

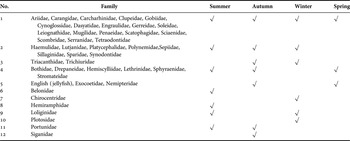
The result of sampling showed that 18 families were observed during four seasons of samplings, 14 families in three seasons, 7 families in two seasons and 5 families in one season (Table 3). The highest diversity of fish was observed during winter (February) and autumn (November), while the highest weight was in May (spring). Aquatics distribution in sampling months was as follows: May, 27 families; August, 31 families; November, 39 families and February, 36 families.
Seasonal sequencing of detected families in Hara Biosphere Reserve.

FISH ABUNDANCE
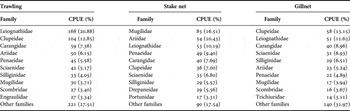
Investigation of aquatics fishing by trawling methods proved that the Leiognathidae and Clupeidae families with 20.88% and 12.85%, and 7.36% frequencies had the highest density in the study area. It has also been proved that Mugilidae (16.51%), Ariidae (10.43%), Leiognathidae (10.19%), Penaeidae (9.40%) and Carangidae (7.69%) had the highest density in the stake net method. The Clupeidae, Leiognathidae, Carangidae, Sciaenidae and Sillaginidae families provided the highest abundance in the gillnet method (Table 4). In general, it is clearly observable that the Clupeidae, Carangidae and Mugilidae families had higher density than the other families surveyed.
Abundance of fish caught by various fisheries methods (number).

CPU, catch per unit effort.
FISH WEIGHT
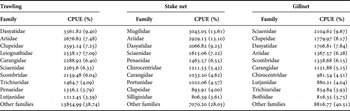
In the trawling method, the highest average weight was reported for the Dasyatidae (9.40%), Ariidae (7.48%), Clupeidae (7.25%), Leiognathidae (7.09%) and Carangidae (6.40%) families (Table 3). The Mugilidae, Ariidae, Dasyatidae, Sciaenidae and Penaeidae families (13.61, 13.10, 9.25, 7.22% and 6.55%, respectively) have provided the highest average weight in the stake net method. The Sciaenidae, Clupeidae and Dasyatidae families have provided the highest average weight in in gillnet method (Table 5). The Dasyatidae, Ariidae, Sciaenidae and Clupeidae families are more weighted than the other families surveyed.
Weight of fish caught by various fisheries methods (gram).

CPU, catch per unit effort.
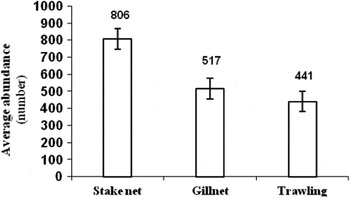
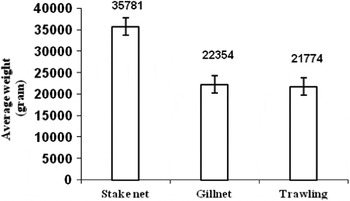
Figures 2 and 3 demonstrate the aquatic organisms' frequency and weight in different methods. It is clear that the highest CPUE in the trawling method was 806 (±151.09) gr. Then, the stake net and gillnet methods achieved 517 (±119.17) and 441 (±124.41) gr, respectively (Figure 2). On the other hand, comparison between the caught fish weight showed that the highest CPUE is achieved for the trawling method 35781 (+9354) gr, whereas this amounts in the two other methods were 22354 (±6897) and 21774 (± 59810) gr per unit effort, respectively (Figure 3).
Average abundance of fish caught in catch per unit effort (number).

Average weight of fish caught in catch per unit effort (gram).

BIODIVERSITY INDICES
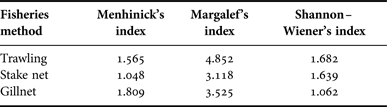
In order to compare the caught aquatics diversity in the three mentioned methods Margalef's, Menhinick's and Shannon–Wiener's diversity indices were applied. Results showed that the trawling method provided the highest species diversity which was calculated as 1.565 by Menhinick's index and 4.852 by Margalef's index. Menhinick's index for the stake net and gillnet methods was 3.048 and 2.809, respectively. Moreover, Margalef's index for the two defined methods was 3.118 (stake net) and 3.525 (gillnet). Shannon–Wiener's diversity index for three methods (trawling, stake net and gillnet) was 1.682, 1.639 and 1.062, respectively (Table 6).
Comparison of ecological indices (Margalef's, Menhinick's and Shannon–Wiener's) in trawling, gillnet and stake net methods.

DISCUSSION
Hara Biosphere Reserve as a marine–coastal region is mainly located in nearshore areas. Substantial parts of this area are considered as an ‘International Lagoon’, which is of high ecological importance. Moreover, mangrove forest coverage plays a key role in ecological services (Valiela et al., Reference Valiela, Bowen and York2001; Whitfield & Elliott, Reference Whitfield and Elliott2002). Hence, study areas, such as other mangrove ecosystems located in tropical and subtropical regions are considered an appropriate habitat for juvenile species and a great nursery for fish as well as invertebrates (Yáñez-Arancibia et al., Reference Yáñez-Arancibia, Linares, Day and Kennedy1980; Odum et al., Reference Odum, McIver and Smith1982; Thayer et al., Reference Thayer, Colby and Hettler1987; Chong et al., Reference Chong, Sasekumar, Leh and D'Cruz1990; Robertson & Duke, Reference Robertson and Duke1990; Ikejima et al., Reference Ikejima, Tongnunui, Medej and Taniuchi2003; Hindell & Jenkins, Reference Hindell and Jenkins2004). Results of the present study detected 44 families that reveal a high rich diversity. Leiognathidae, Clupeidae, Carangidae and Mugilidae are more abundant. Mugilidae, Clupeidae, Carangidae and Mugilidae were detected as high frequent families. The highest weight range was found among the Clupeidae, Dasyatidae, Ariidae and Sciaenidae families. In mangrove estuaries of Kenya, Gerreidae, Atherinidae and Clupeidae accounted for 78.5% of the total number of fish (Kimani et al., Reference Kimani, Mwatha, Wakwabi, Ntiba and Okoth1996). According to Spach et al. (Reference Spach, Santos, Godefroid, Nardi and Cunha2004) in mangrove estuaries throughout Brazil Ariidae, Engraulida, Leiognthidae and Sillaginida are among the most dominant families.
Poulakis et al. (Reference Poulakis, Blewett and Mitchell2003) recorded 81 fish species of which 10 constituted 90% of total abundance in estuary with mangrove and seagrasses in Florida. The present survey showed 7 fish species were recorded and identified which comprised 90% of total abundance. Shervette et al. (Reference Shervette, Aguirre, Cevallos, Gonzalez, Pozo, Blacio and Gelwick2007) caught a total of 12231 individuals including 16 families (36 species) from Rios Palmer and Javita. Gobiidae with 7 species were the most diverse family for mangrove habitats, then Gerreidae with 5 species and Engraulidae with 4 species. In this study the lowest weight of catch was observed during summer and autumn. According to Heck et al. (Reference Heck, Orth and Hays2003) and Manson et al. (Reference Manson, Loneragan, Harch, Skilleter and Williams2005a), most of the detected aquatics that are mostly in juvenile period of their life had the lowest weight during winter and autumn. In reality, at the coastal dry season, in other words during October or November, catch richness and diversity measures were higher compared to March or April yields of catch during the rainy season. This is inconsistent with the increase in fish diversity and richness during the wet season which has been recorded in many other mangrove fish communities (Barletta et al., Reference Barletta, Barletta-Bergan, Saint-Paul and Hubold2003).
The results of this survey showed that in the trawling method of fishing more fish were caught in comparison with the other two: stake net and gillnet methods. Surely, this was because in the trawling method which covers an expansive catch area, the same reason applies for the weight of catch in such a way that the average weight is approximately 1.5 times more than other fishing methods.
Differences in ecological area, as well as ecological and social conditions of the study area resulted in great attention of the coastal inhabitants to different methods of marine fishing. Results showed the trawling was more popular than the other two methods. However, there was no significant difference among the three studied fisheries methods. On the other hand, the highest population frequency and average weight were detected in the trawling method. It is worth mentioning that all these differences are as a result of the different fishing gears used and the position of catch location of the three fishing methods.
ACKNOWLEDGEMENTS
The author thanks all colleagues in the Environmental Protection Organization, as well as the Islamic Azad University Bandar Abbas Branch, for their appreciable assistance during this study.