I. INTRODUCTION
The solute element would redistribute in solid and liquid phases at solidification front during the solidification process of alloys. This phenomenon is the intrinsic property of alloy solidification. The ratio of the solute concentrations between the solid and liquid phases is called the solute equilibrium partition coefficient (k i), and the solute segregation is mainly determined by k i during alloy solidification.Reference Bazhenov, Pikunov and Cheverikin1 In the simulation study of solute segregation, k i is an important characteristic parameter for characterizing the redistribution of solute elements at the solid–liquid interface,Reference Gui, Long, Chen, Huang, Liu, Chen and Duan2 and its accuracy has a great influence on the prediction results of solute segregation.Reference Hobbs, Tin and Rae3 The solute equilibrium partition coefficient (k i) could be obtained by experimentalReference Sung and Poirier4 and theoretical calculation,Reference Battle and Pehlke5,Reference Kagawa, Iwata, Nofal and Okamoto6 and the research objects mainly included Fe–C-based alloys,Reference Okamoto, Morita, Kagawa and Tanaka7,Reference Kagawa and Okamoto8 Ni based alloys,Reference Bazhenov, Pikunov and Cheverikin1 rare earth alloys,Reference Heckl, Rettig and Singer9 and so on.Reference Wang, Su, Zhang, Huang, Liu and Fu10 HobbsReference Hobbs, Tin and Rae3 and SungReference Sung and Poirier4 applied a linear regression to solute partition coefficient for Ni-based alloys through experiment. ImaiReference Imai, Tanaka, Yuki, Iida and Morita11 and KagawaReference Kagawa, Okamoto and Goda12 explored the effect of experimental temperature and component content on k i for Fe–C-based alloys. The experimental method to measure k i is intuitive and reliable. But, in fact, the solidification process of the alloy was difficult to achieve equilibriumReference Min, Shen, Feng, Wang and Liu13 and k i was varied with solidification temperature,Reference Ocansey and Pourier14 which will increase the complexity of the experiment. The theoretical calculation method is generally by calculating the thermodynamic equilibrium of the alloy solidification system. And its feasibility and accuracy has been verified by Kagawa et al.Reference Kagawa, Hirata and Sakamoto15 and Thomas et al.Reference Battle and Pehlke5 for Ni-based and Fe-based alloys with different components.
During the solidification process of the alloy, k i was greatly influenced by the component, solidification path, and phase transition of the alloy system.Reference Sung and Poirier4 KagawaReference Kagawa, Hirata and Sakamoto15 found that the coagulation temperature, solute concentrations, and the interaction between components all have a different effect on k i for Ni-based alloys. For Fe–C-based alloys, studies were mainly focused on Fe–C–X ternary alloys.Reference Kagawa and Okamoto16,Reference Morita and Tanaka17 OcanseyReference Ocansey and Pourier14 found that the k C in Fe–C–Si–Mn quaternary alloys has a great difference from that in Fe–C binary alloys during the solidification process. In the simulation of solute segregation for steel (Fe–C-based alloys), elements of Fe, C, Si, Mn, P, and S were usually need to be considered.Reference Sun and Zhang18 As the alloy component increased, k i would also be different. But research about k i in the Fe–C–Si–Mn–P–S alloy solidification process was not comprehensive.Reference Chen, Long, Cao, Chen, Liu and Dong19
In high sulfur steel, the S content is higher and different from the conventional steel, and a large amount of MnS inclusion would precipitate and the solute concentrations at solidification front would be influenced,Reference Xu, Liu, Guo and Chen20,Reference You, Michelic, Bernhard, Loder and Wieser21 which may finally have an effect on k i during the solidification process. YouReference You, Michelic, Bernhard, Loder and Wieser21 and LongReference Huang, Long, Liu, Chen, Chen, Gui, Liu and Yu22 have studied the effect of solute equilibrium partition coefficient on inclusion formation and solute segregation. But there were few studies focused on the influence of inclusion precipitation on k i. In this study, the variation of the solute equilibrium partition coefficient with solidification temperature during the solidification process of high sulfur steel (Fe–C–Si–Mn–P–S alloy system) was investigated by using the thermodynamic theoretical calculation. And the effect of MnS precipitation and the content of solutes Mn and S on the solute equilibrium partition coefficients were explored and analyzed.
II. SOLUTE EQUILIBRIUM PARTITION COEFFICIENT THERMODYNAMIC MODEL
A. Model description
During the solidification process of a multicomponent alloy, the ratio of solute concentrations between solid phase and liquid phase was known as the solute equilibrium partition coefficient when the equilibrium exists at the solid–liquid interface.Reference Sung and Poirier4 And the equilibrium partition coefficient of solute i could be defined as
 $${k_i} = {{{C_{{\rm{S,}}i}}} \over {{C_{{\rm{L,}}i}}}}\quad ,$$
where C S,i and C L,i are the solid and liquid compositions of solute i at the solid–liquid interface, respectively. If k i is near to 1, there will be almost no partitioning of solute element i between the solid phase and liquid phase during the solidification process. If k i > 1, there will be a preferential partitioning of solute element i from the liquid to the solid phase. By contrast, if k i < 1, the solute element i will partition from the solid to the liquid phase.Reference Sung and Poirier4
When the thermodynamic equilibrium exists during the solidification process of a multicomponent alloy, the thermodynamic parameters, such as chemical potential of solute element i, are equal between the solid phase and liquid phase. The fundamental equation based on the thermodynamic equilibrium to calculate the equilibrium partition coefficients of the solute can be described as followsReference Chen, Long, Cao, Chen, Liu and Dong19:
 $$\mu _{i,0}^{\rm{S}} + RT\ln a_i^{\rm{S}} = \mu _{i,0}^{\rm{L}} + RT\ln a_i^{\rm{L}}\quad ,$$
where  $\mu _{i,0}^{\rm{L}}$ and
 $\mu _{i,0}^{\rm{S}}$ are the chemical potential of element i in the liquid and solid phases, respectively, J/mol.
 $a_i^{\rm{L}}$ and
 $a_i^{\rm{S}}$ are the activity of element i in the liquid and solid phases, respectively. R represents the gas constant, J/(mol K). T is the solidification temperature, K.
The parameter of element activity (a i) is determined by the concentration and activity coefficient of solute i in solid or liquid phase. And a i is defined as
 $${a_i} = {c_i}{\gamma _i}\quad ,$$
where c i is the composition of solute i. γi is the activity coefficient, which is influenced by other components and it is applied to consider the effect of solute interactions, which is between the solute components of the multicomponent alloy, on the equilibrium partition coefficients of solute. γi can be expressed as
 $${\gamma _i} = \ln \gamma _i^0 + \varepsilon _i^i{c_i} + \varepsilon _i^j{c_j} + \varepsilon _i^k{c_k} + \cdots \varepsilon _i^n{c_n}\quad ,$$
where  $\gamma _i^0$ is the activity coefficient of solute i in infinite dilution solution system,
 $\varepsilon _i^i$ represents the self-interaction of element i, and
 $\varepsilon _i^j$,
 $\varepsilon _i^k$,…,
 $\varepsilon _i^n$ are the interaction coefficients of solute j, k,…, n on i. i, j,…, n represent the solute elements in the multicomponent alloy.
Combining Eqs. (1)–(4), the equilibrium partition coefficient of solute i could be expressed as
 $${k_i} = {{\gamma _i^{0,{\rm{L}}}} \over {\gamma _i^{0,{\rm{S}}}}}\exp \left[ {\matrix{ {{{\mu _{i,0}^{\rm{L}} - \mu _{i,0}^S} \over {RT}} + \left( {\varepsilon _i^{i,{\rm{L}}}c_i^{\rm{L}} - \varepsilon _i^{i,{\rm{S}}}c_i^{\rm{S}}} \right) + \left( {\varepsilon _i^{j,{\rm{L}}}c_j^{\rm{L}} - \varepsilon _i^{j,{\rm{S}}}c_j^{\rm{S}}} \right)} \cr { + \left( {\varepsilon _i^{k,{\rm{L}}}c_k^{\rm{L}} - \varepsilon _i^{k,{\rm{S}}}c_k^{\rm{S}}} \right) + \cdots \left( {\varepsilon _i^{n,{\rm{L}}}c_n^{\rm{L}} - \varepsilon _i^{n,{\rm{S}}}c_n^{\rm{S}}} \right)} \cr} } \right]\quad ,$$
where  $\varepsilon _i^{i,{\rm{L}}}$ and
 $\varepsilon _i^{i,S}$ are the self-interaction coefficient of solute i in the liquid and solid phases, respectively. In Eq. (5), the term
 ${{\mu _{i,0}^{\rm{L}} - \mu _{i,0}^{\rm{S}}} \over {RT}}$ is decided by the thermochemical nature of solute i, which is mainly influenced by temperature. The polynomial of
 $\left( {\varepsilon _i^{i,{\rm{L}}}c_i^{\rm{L}} - \varepsilon _i^{i,{\rm{S}}}c_i^{\rm{S}}} \right)$ is the concentration dependence term and it was characterized by the concentration of solute i in liquid and solid phases. And
 $\left( {\varepsilon _i^{j,{\rm{L}}}c_j^{\rm{L}} - \varepsilon _i^{j,{\rm{S}}}c_j^{\rm{S}}} \right) + \left( {\varepsilon _i^{k,{\rm{L}}}c_k^{\rm{L}} - \varepsilon _i^{k,{\rm{S}}}c_k^{\rm{S}}} \right) + \cdots \left( {\varepsilon _i^{n,{\rm{L}}}c_n^{\rm{L}} - \varepsilon _i^{n,{\rm{S}}}c_n^{\rm{S}}} \right)$ is an interaction term between solutes i and j, k,…, n, which represent the effect of element j, k,…, n on the equilibrium partition coefficient of element i in the multicomponent alloy,Reference Kagawa, Hirata and Sakamoto15,Reference Chen, Long, Cao, Chen, Liu and Dong19 and the influence of the interaction between components on the solute equilibrium partition coefficient is embodied by using this polynomial.
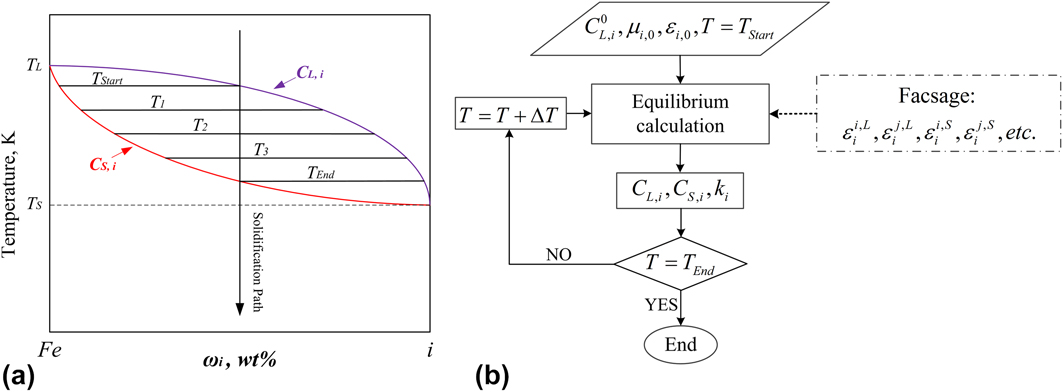
The thermodynamic theoretical calculation model of the solute equilibrium partition coefficient (k i) was based on the thermodynamic equilibrium of the multicomponent alloy during the solidification process. Equations (1)–(5) were the theoretical basis for the calculation of k i. According to the definition of k i as in Eq. (1), k i can be calculated if the solute concentrations in the solid and liquid phases can be obtained. As shown in Fig. 1(a), during the solidification process of the alloy, the solute concentrations in the solid and liquid phases were different and varied with solidification temperature. Therefore, the thermodynamic equilibrium of the alloy solidification system should be calculated at each solidification temperature to gain the solute concentrations in solid and liquid phases, as well as the k i.
Schematic diagram of the calculation model. (a) Calculation principle and (b) calculation process.

The thermodynamic calculation process is presented in Fig. 1(b). During the solidification process of the alloy, the solidification starting temperature (T Start) was first determined according to the initial solute concentrations in the alloy. When the temperature of the alloy solidification system was decreased to T = T Start, the alloy system started to solidify, and the phase transition of liquid → solid phase occurred. And then, the thermodynamic equilibrium between the liquid and solid phases was calculated, based on Eq. (2), according to the system temperature and the thermodynamic parameters in Eq. (5). As a result, the equilibrium concentrations of the solute in liquid and solid phases as well as the equilibrium partition coefficients in Eq. (1) (C i,L, C i,S, and k i) could be obtained. With the decrease of system temperature (T = T 1, T 2, T 3,…), the solid phase was continuously generated from the liquid phase. Accordingly, the equilibrium of the alloy solidification system was broken, and the value of the thermodynamic parameters in Eq. (5) would change. Based on Eq. (2), the thermodynamic equilibrium of the alloy solidification system at this system temperature would be calculated again. The calculation of the thermodynamic equilibrium was repeated until the system temperature was decreased to the solidification end temperature (T End). Finally, the changing rule of the solute equilibrium partition coefficient with solidification temperature was obtained.
In addition, at each calculation step, it was necessary to calculate whether there was inclusion precipitation in the alloy, according to the thermodynamic parameters and temperature of the alloy. If there was inclusion precipitation, the solute concentrations would be consumed, and the thermodynamic equilibrium and solute concentration of the alloy would be different, which may ultimately influence the solute equilibrium partition coefficient.Reference Bale, Bélisle, Chartrand, Decterov, Eriksson, Gheribi, Hack, Jung, Kang, Melançon, Pelton, Petersen, Robelin, Sangster, Spencer and Van Ende23 Please refer to the literature for a more detailed description of the calculation principle and method.Reference Bale, Bélisle, Chartrand, Decterov, Eriksson, Gheribi, Hack, Jung, Kang, Melançon, Pelton, Petersen, Robelin, Sangster, Spencer and Van Ende23 In this study, the solution of Eqs. (1)–(5), which were applied to calculate the k i, was carried out by thermodynamic software of FactSage. FactSage has the Equilib module and the basic thermodynamic parameters in Eq. (5), which can be used to calculate the thermodynamic equilibrium of Fe–C-based alloy solidification.
B. Model validation
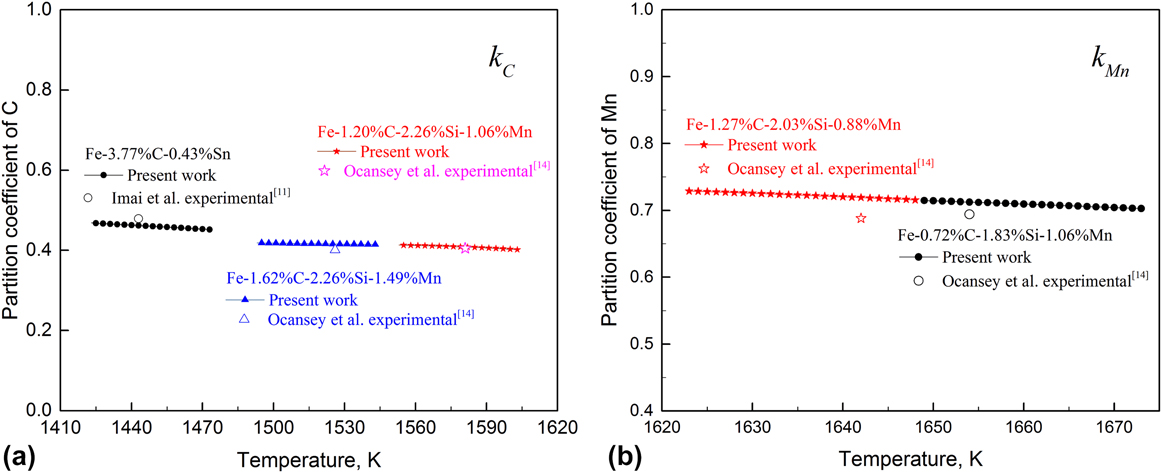
To verify the accuracy of the present model, the equilibrium partition coefficients for elements of C and Mn (k C and k Mn) in ternary and quaternary of the Fe–C-based alloy were calculated, and the prediction results were compared with the literature studies,Reference Imai, Tanaka, Yuki, Iida and Morita11,Reference Ocansey and Pourier14 as shown in Fig. 2. For Fe–C–Sn alloy solidification, the k C at 1443 K was 0.479 by the experimental result,Reference Imai, Tanaka, Yuki, Iida and Morita11 while the calculation result by the present model was 0.462, and the deviation between the prediction and experimental result was −3.5%. Moreover, the experimental results of k C at 1581 K and at 1526 K in two different Fe–C–Si–Mn alloys were 0.405 and 0.401,Reference Ocansey and Pourier14 while the present calculation results were 0.408 and 0.416, respectively. And the deviations were 0.7% and 3.7%, respectively. Furthermore, as shown in Fig. 2(b), the experimental results of k Mn at 1381 K and at 1369 K in two other Fe–C–Si–Mn alloy systems were 0.694 and 0.688,Reference Ocansey and Pourier14 while the present calculation results were 0.712 and 0.719, respectively. And the deviations were 2.6% and 4.5%, respectively.
Model validation for k C and k Mn in the multicomponent alloy system. (a) k C and (b) k Mn.

The results showed that the prediction results of k C and k Mn in different multicomponent alloy systems were in good agreement with the literature studies, and the deviations between present calculated values and experimental data were all less than 5%. Therefore, the present model was reliable and accurate to calculate the solute equilibrium partition coefficient for the Fe–C-based alloy.
III. RESULTS AND DISCUSSION
A. Solidification path and phase transition
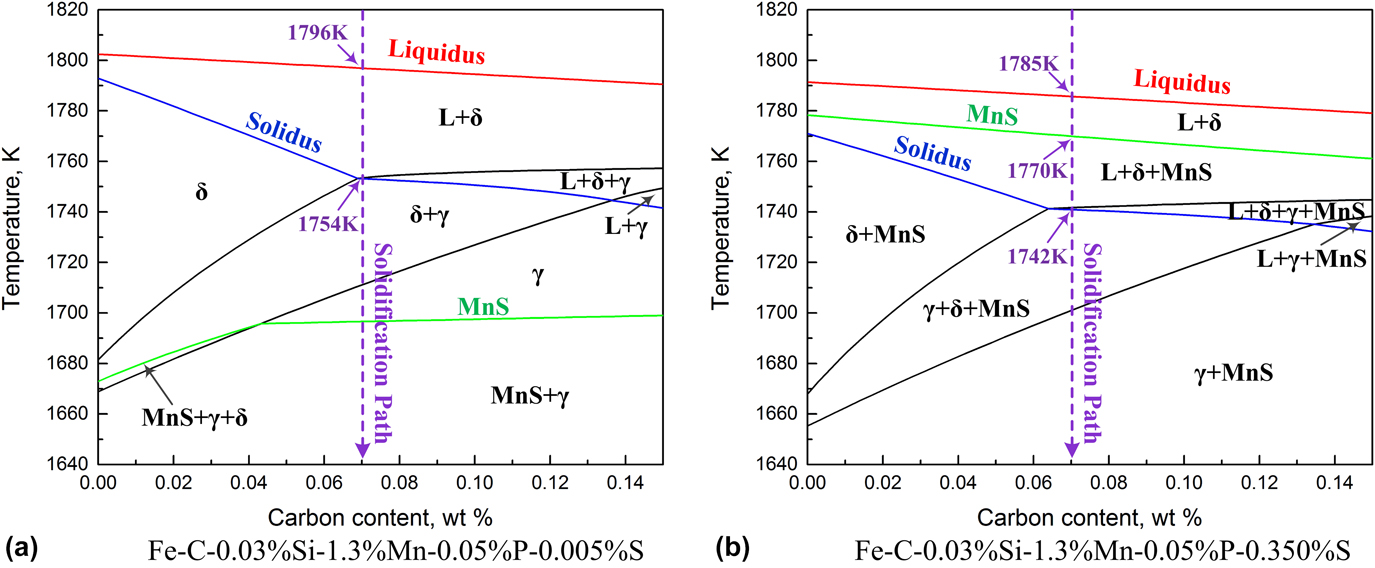
Due to the fact that k i is sensitive to the solidification temperature and phase composition (δ/L or γ/L), the solidification path and phase transition, which is influenced by the components content, would have a great effect on k i during multicomponent alloy solidification.Reference Huang, Long, Liu, Chen, Chen, Gui, Liu and Yu22 The phase diagram of high sulfur steel was calculated and shown in Fig. 3. When the content of solute S was 0.005 wt%, the alloy system started to solidify when the system temperature was dropped to 1796 K, as presented by the purple line in Fig. 3(a). And then, the liquid phase (L) gradually transformed into the δ phase (L → δ phase transition) and formed the coexistence area of the L + δ phase. Until the solidification temperature was decreased to 1754 K, the alloy solidified completely. In the process of alloy solidification, the solid phase was basically δ phase and almost no γ phase formed. In addition, there is no MnS precipitation in the liquid phase and liquid–solid coexistence phase because the S content was too low, and MnS only precipitated in the solid phase after the alloy solidified completely (the green line).
Solidification path and phase transition of high sulfur steel (C-0.07%). (a) S-0.005% and (b) S-0.35% (in wt%).

The solidification path and phase transition of S-0.35 wt% was similar to that of S-0.005 wt% as it was mainly determined by solute C in the Fe–C alloy and the content of the solute elements of C, Si, Mn, and P in the alloy was the same. There was L + δ phase coexistence between 1785 and 1742 K. But, the precipitation starting temperature of MnS inclusion increased and it began to precipitate in the liquid–solid phase coexistence at 1770 K due to a higher S content in alloy, as shown in Fig. 3(b).
The results show that the chief form of the solidification path and phase transitions were similar under different S contents, and there was a little difference in the phase transition temperature. The dominant phase transition during high sulfur steel (C-0.07 wt%) solidification was L → δ. Nevertheless, the S content has a great effect on the precipitation of MnS inclusion. Because the k i could be influenced by the alloy component content,Reference Kagawa, Hirata and Sakamoto15 the precipitation of MnS, which influenced the redistributions and concentrations of solutes Mn and S in liquid and solid phases, may have an effect on k i during the solidification process of high sulfur steel.
B. Evolution of solute equilibrium partition coefficients
1. Effect of S content on k i
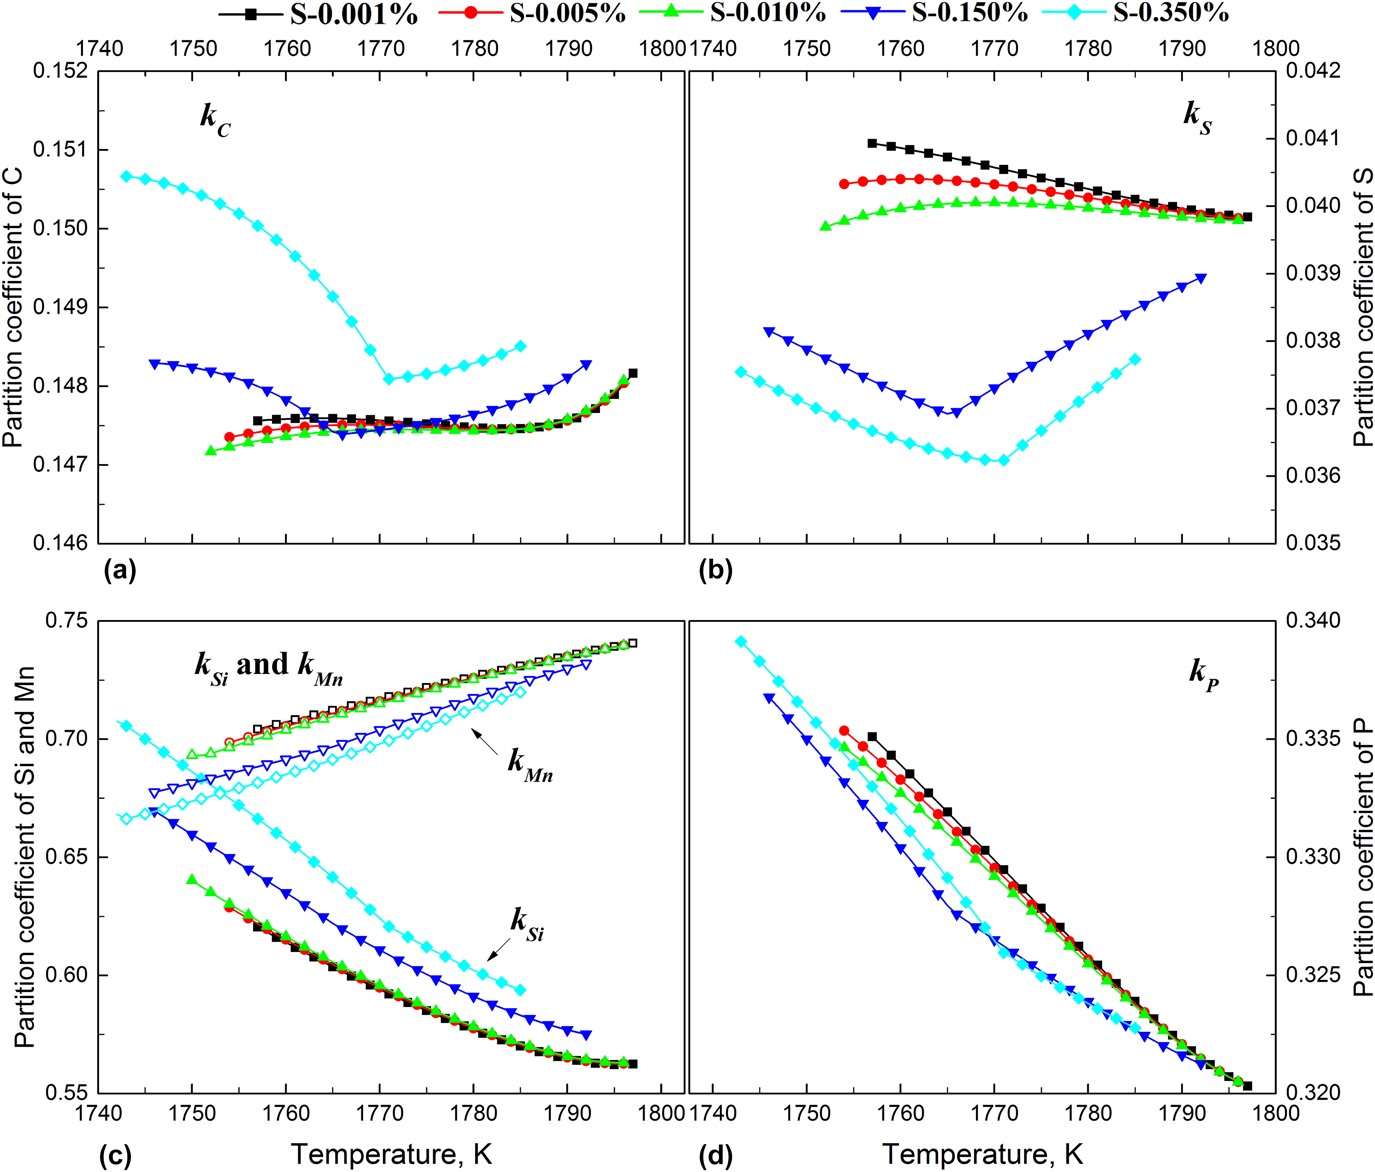
The solute equilibrium partition coefficient (k i) changed with the components of alloy. Figure 4 presents the change rule of k i with solidification temperature under different S contents (ranged from 0.001 to 0.35 wt%) during the solidification process of high sulfur steel. Figure 4(a) shows that when the S content was ranged from 0.001 to 0.01 wt%, the S content almost has no effect on the equilibrium partition coefficient of solute C (k C). And with the decrease of the solidification temperature, all the k C first decreased slightly and then almost remained unchanged. But, while the S content was increased to 0.15 or 0.35 wt%, the effect of S content on k C was significant. The k C decreased first and then increased with the decrease of temperature. And there was an obvious turning point in the change trend of k C with temperature, and the turning point temperatures were 1765 and 1770 K for S-0.15 wt% and S-0.35 wt%, respectively. Above and below the turning point temperature, the change rule of k C with temperature was opposite. Besides, k C for S-0.35 wt% was always larger than k C for S-0.15 wt% during the solidification process.
Change rule of solute equilibrium partition coefficient (k i) with temperature under different S contents (Fe–0.07% C–0.03% Si–1.3% Mn–0.05% P–0.001–0.350% S, wt%). (a) k C, (b) k S, (c) k Si, and k Mn, and (d) k P.

Figure 4(b) shows the variation of k S with solidification temperature under different S contents. At the same temperature, the higher the S content was, the lower the k S was. k S almost increased monotonously with temperature decreasing when the S content was 0.001 wt%, while k S increased first and then has little changing when S content was 0.005 wt%, and k S increased first and then decreased when S content was 0.01 wt%. The effect of S content on k S was more significant at the late stage of solidification when the S content was ranged from 0.001 to 0.01 wt%. Nevertheless, the k S decreased first and then increased with the decrease of temperature when the S contents were 0.15 and 0.35 wt%, which presented that the changing trend of k S with temperature was obviously different from that of when the S content was 0.001–0.01 wt%. Namely, there was a turning point in the change trend of k S with temperature, which was similar to that of k C. The turning point temperatures were 1765 and 1770 K when the S contents were 0.15 and 0.35 wt%, which were the same as that of k C, respectively. In addition, solidification temperature has a greater effect on k S when the S content was higher.
The variation of k Si and k Mn with temperature under different S contents are presented in Fig. 4(c). It indicates that with the increase of S content, k Si increased and k Mn decreased. And there was a little difference of k Si as well as k Mn when the S content was ranged from 0.001 to 0.01 wt%. But S content has some effect on the k Si and k Mn while the S content was higher (0.15 and 0.35 wt%), especially for k Si. Under different S contents, all the k Si increased while k Mn decreased with the decrease of solidification temperature. The effect of temperature on k Si and k Mn was more significant, especially for k Si. Therefore, it is necessary to pay attention to the effect of solidification temperature on the prediction results of k Si and k Mn in the Fe–C-based alloy solidification. Figure 4(d) indicates that S content has little effect on k P, especially in the early stage of solidification (1795–1770 K). And all the k P increased with the decrease of temperature under different S contents.
The above analysis shows that the k Si, k Mn, and k P varied monotonously with the decrease of solidification temperature during the solidification process of high sulfur steel. And when the S content was higher and increased to 0.15 or 0.35 wt%, both of k C and k S decreased first and then increased with the decrease of temperature, which has a turning point. It illustrates that not only the solidification temperature but also the S content have an effect on the solute equilibrium partition coefficients during high sulfur steel solidification process.
2. Effect of Mn content on k i
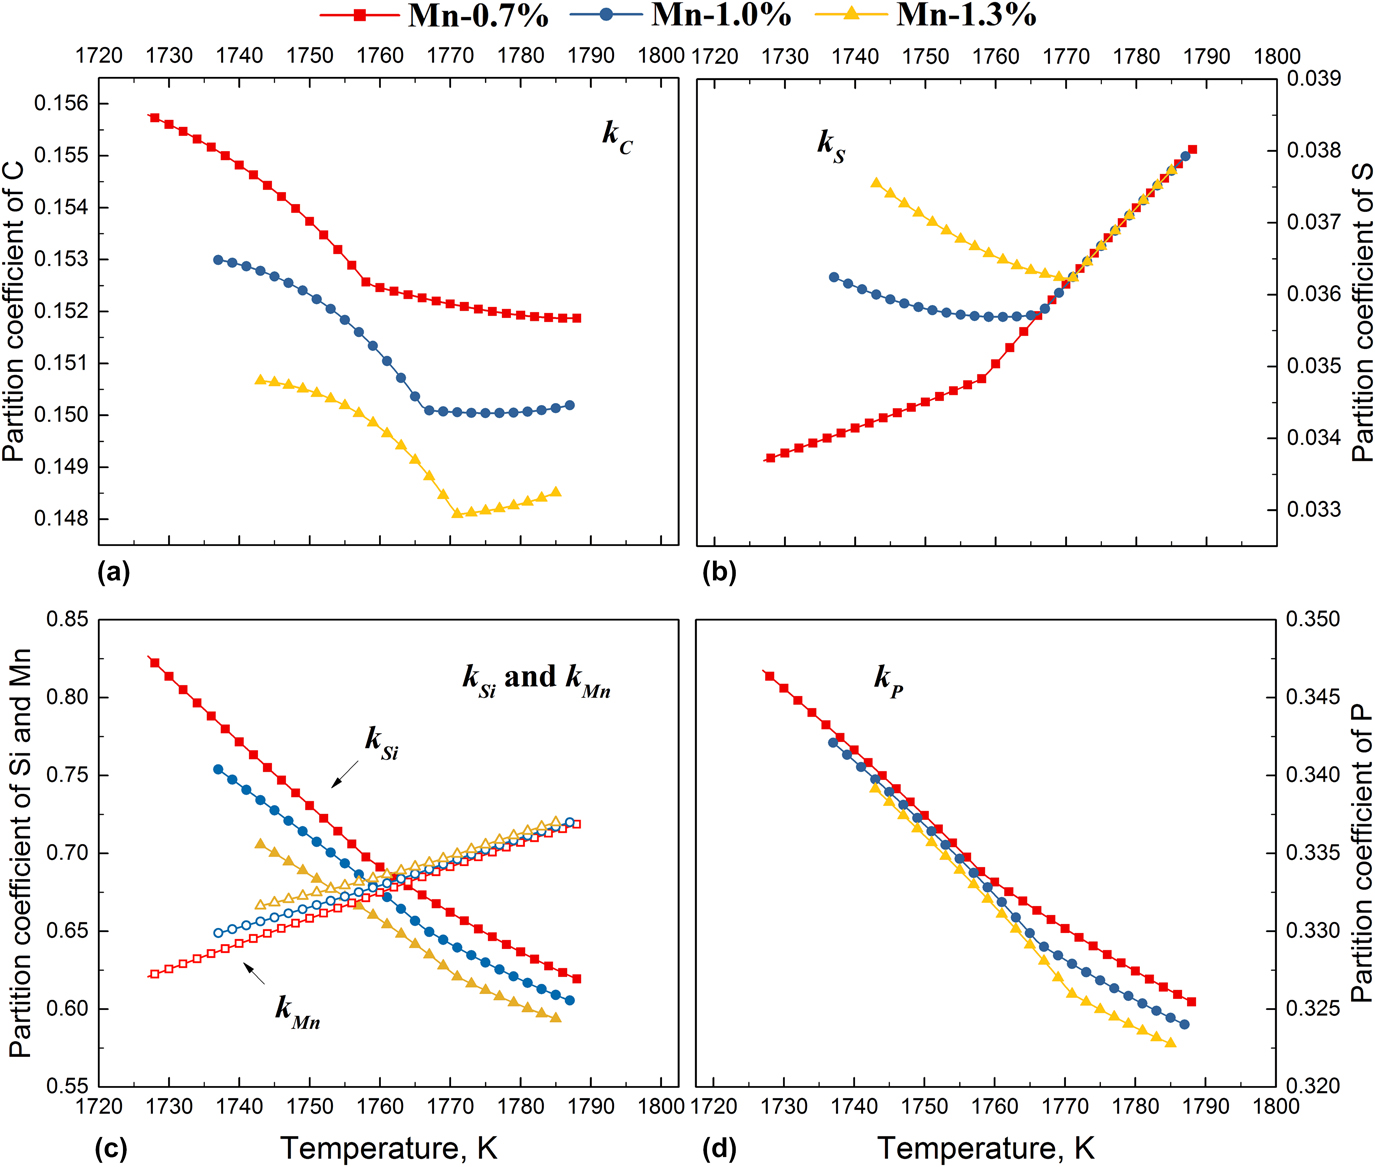
Figure 5 presents the variation regularity of k i with solidification temperature under the condition of Mn content in high sulfur steel were 0.7, 1.0, and 1.3 wt%. Figure 5(a) shows that when the Mn content was 0.7 wt%, with the decrease of solidification temperature, k C first increased slowly in the early solidification (1790–1758 K) and then the increase amplitude of k C increased when the solidification temperature was below 1758 K. But k C first decreased slowly and then increased gradually when the Mn content was 1.0 and 1.3 wt%, which were different from that of Mn content was 0.7 wt%. There was a turning point in the change trend of k C with temperature, which was similar to the change trend of k C under a higher S content that mentioned earlier. And the turning point temperatures were 1766 and 1770 K for Mn-1.0 wt% and Mn-1.3 wt%. In addition, the higher of Mn content was, the lower of k C was.
Change rule of solute equilibrium partition coefficient (k i) with temperature under different Mn contents (Fe–0.07% C–0.03% Si–0.7%–1.3% Mn–0.05% P–0.350% S, wt%). (a) k C, (b) k S, (c) k Si, and k Mn, (d) k P.

The change rule of k S with temperature is shown in Fig. 5(b). Under the condition of Mn content was 0.7 wt%, k S decreased gradually with the decrease of solidification temperature, but the decrease amplitude of k S decreased when the temperature was below 1758 K. However, k S first decreased and then increased with temperature decreasing when the Mn content was 1.0 and 1.3 wt%. The change trend of k S with temperature also has a turning point, which was similar to k C. Moreover, the Mn content almost has no effect on k S when the temperature was above the turning point temperature. And if the solidification temperature was below the turning point temperature, the higher of Mn content was, the higher of k S was, which was contrary to that of k C. As mentioned earlier, the equilibrium partition coefficients of solute were influenced by solidification temperature, solute concentrations and the interaction between components.Reference Kagawa, Hirata and Sakamoto15 For the components of high sulfur steel, solute Mn has little effect on k S, but k S was great influenced by the content of solute S. Therefore, there was almost no difference of k S under different Mn content when the temperature was above the turning point temperature, which there was no MnS precipitation. Nevertheless, MnS inclusion started to precipitate when the temperature was below the turning point temperature, and the concentration of solute S was affected and consumed significantly, which has a great effect on k S, as shown in Fig. 4(b). The effect of MnS precipitation on the equilibrium partition coefficients of solute would be discussed later.
Figure 5(c) indicates that with the increase of Mn content, k Si decreased while k Mn increased slightly. And under different Mn content, all the k Si increased monotonously while k Mn decreased monotonously with the decrease of solidification temperature. The effect of temperature on k Si and k Mn was significant, especially for k Si. The Mn content almost has no effect on k P, especially at the end of solidification. And k P increased monotonously with the decrease of solidification temperature, as shown in Fig. 5(d).
Figures 4 and 5 state clearly that the contents of solutes Mn and S have an effect on the solute equilibrium partition coefficients during the solidification process of high sulfur steel. When the contents of solutes S and Mn were high enough, all the k C and k S decreased first and then increased with temperature decreasing, and there was a turning point for its change trend. But k Si, k Mn, and k P changed monotonically with temperature. A higher contents of solutes S and Mn have a more significant effect on the change trend of k C and k S with temperature, which was due to the precipitation of MnS inclusion, and it will be discussed later.
3. Average equilibrium partition coefficients of the solute
The previous analysis shows that S and Mn contents have different effects on the equilibrium partition coefficients of the solute. Figure 6 presents the change rule of the average equilibrium partition coefficients of solute  $\left( {k_i^{{\rm{Ave}}}} \right)$, which referred to the average value of the equilibrium partition coefficient of the solute across the whole stages of alloy solidification, with the change of S and Mn contents. It could be found that when the S content increased from 0.001 to 0.35 wt% (Mn-1.35 wt%),
 $k_{\rm{C}}^{{\rm{Ave}}}$,
 $k_{{\rm{Si}}}^{{\rm{Ave}}}$, and
 $k_{\rm{P}}^{{\rm{Ave}}}$ increased gradually, while
 $k_{\rm{S}}^{{\rm{Ave}}}$ and
 $k_{{\rm{Mn}}}^{{\rm{Ave}}}$ decreased gradually. And the change percentage of
 $k_{\rm{C}}^{{\rm{Ave}}}$,
 $k_{{\rm{Si}}}^{{\rm{Ave}}}$,
 $k_{{\rm{Mn}}}^{{\rm{Ave}}}$,
 $k_{\rm{P}}^{{\rm{Ave}}}$, and
 $k_{\rm{S}}^{{\rm{Ave}}}$ were 1.2%, 10.4%, −4.4%, 0.9%, and −8.7%, respectively, as presented in Fig. 6(e). Whereas, when the Mn content increased from 0.7 to 1.3 wt% (S-0.35 wt%),
 $k_{\rm{C}}^{{\rm{Ave}}}$,
 $k_{{\rm{Si}}}^{{\rm{Ave}}}$, and
 $k_{\rm{P}}^{{\rm{Ave}}}$ decreased, while
 $k_{\rm{S}}^{{\rm{Ave}}}$ and
 $k_{{\rm{Mn}}}^{{\rm{Ave}}}$ increased. And the change percentage of
 $k_{\rm{C}}^{{\rm{Ave}}}$,
 $k_{{\rm{Si}}}^{{\rm{Ave}}}$,
 $k_{{\rm{Mn}}}^{{\rm{Ave}}}$,
 $k_{\rm{P}}^{{\rm{Ave}}}$, and
 $k_{\rm{S}}^{{\rm{Ave}}}$ were −2.6%, −9.0%, 3.1%, −1.5%, and 4.3%, respectively. This illustrates that the effect of Mn content on solute equilibrium partition coefficients was contrary to that of S content. And the effect of S and Mn contents on the k Si and k S was more significant. The order of influenced extent was k Si > k S > k Mn > k C > k P.
Average equilibrium partition coefficients of solute  $\left( {k_i^{{\rm{Ave}}}} \right)$ and the change percentage with different S and Mn contents. (a)
 $k_{\rm{C}}^{{\rm{Ave}}}$, (b)
 $k_{{\rm{Si}}}^{{\rm{Ave}}}$ and
 $k_{{\rm{Mn}}}^{{\rm{Ave}}}$, (c)
 $k_{\rm{P}}^{{\rm{Ave}}}$, (d)
 $k_{\rm{S}}^{{\rm{Ave}}}$, and (e) change percentage of
 $k_i^{{\rm{Ave}}}$.

Under different S and Mn contents, the value of  $k_{\rm{C}}^{{\rm{Ave}}}$,
 $k_{{\rm{Si}}}^{{\rm{Ave}}}$,
 $k_{{\rm{Mn}}}^{{\rm{Ave}}}$,
 $k_{\rm{P}}^{{\rm{Ave}}}$, and
 $k_{\rm{S}}^{{\rm{Ave}}}$ were 0.147–0.149, 0.585–0.646, 0.723–0.691, 0.327–0.330, and 0.040–0.037, respectively. And all of them were less than 1, illustrating that all the elements C, Si, Mn, P, and S are positive segregation elements in the Fe–C-based alloy during solidification. And the order of element segregation extent is S > C > P > Si > Mn, which is in accordance with the literature.Reference Chen, Long, Cao, Chen, Liu and Dong19 Therefore, it is needed to focus on the segregation of solutes S and C in high sulfur steel during the solidification process.
C. Effect of MnS precipitation on k i
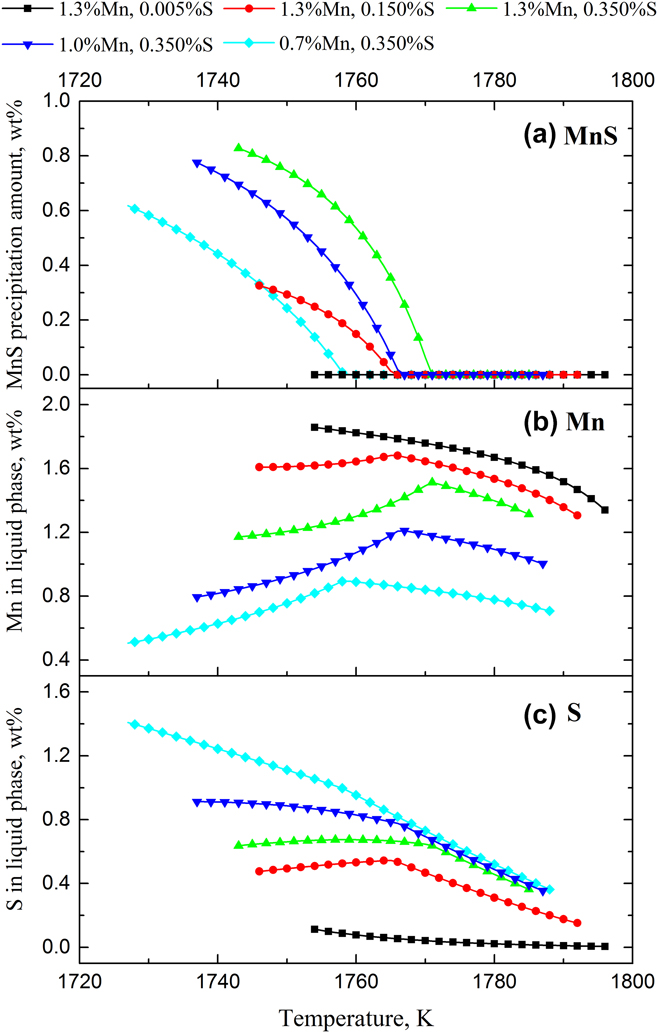
MnS inclusion would precipitate during the solidification process of high sulfur steel.Reference Gui, Long, Chen, Huang, Liu, Chen and Duan2 And the precipitation starting temperature and the precipitation amount of MnS were influenced by the content of solutes Mn and S, as shown in Fig. 7(a). Under the condition of Mn content was 1.3 wt%, there was no MnS precipitation during the solidification process when the S content was 0.005 wt%, but there were a large precipitation amount of MnS while S content were 0.15 and 0.35 wt%. Moreover, the higher the S content was, the higher the precipitation starting temperature of MnS inclusion was and the larger the precipitation amount was. Similarly, the precipitation starting temperature and the precipitation amount of MnS inclusion increased with the increase of Mn content (0.7–1.3 wt%). This revealed that the increase of Mn or S content will have a positive effect on the precipitation of MnS inclusions during the solidification process.
Variation of MnS precipitation amount, solute concentrations of Mn and S with temperature in the solidification process. (a) MnS, (b) Mn, and (c) S.

The precipitation of MnS inclusion has an effect on the concentrations of solutes Mn and S at the solidification front. Figures 7(b) and 7(c) state the variation of the concentrations of solutes Mn and S in the liquid phase (C Mn and C S) with temperature decreasing during the solidification process, respectively. Combined with Fig. 7(a), it can be found that when the Mn content was 1.3 wt% and S content was 0.005 wt%, of which there was no MnS precipitation, both the C Mn and C S increased monotonously with the decrease of solidification temperature due to the effect of solute redistribution and enrichment. But, all the change trends of C Mn and C S with temperature have a turning point at a certain temperature when the contents of solutes Mn and S were 0.7–1.3 wt% and 0.15–0.35 wt%, respectively, which were similar to the change trend of k C and k S with temperature as discussed earlier. Besides, the higher the content of Mn or S was, the more significant the turning trend was. This phenomenon was caused by the precipitation of MnS inclusion during the solidification process.
The precipitation starting temperatures of MnS inclusion  $\left( {T_{{\rm{MnS}}}^{{\rm{ps}}}} \right)$ under different Mn and S contents are shown in Table I. The changing trend of k C, k S, C Mn, and C S with temperature has a turning point, as previously mentioned, and the turning point temperatures of them (k C, k S, C Mn, and C S) were all the same as
 $T_{{\rm{MnS}}}^{{\rm{ps}}}$ under each component of the alloy system. From the above analysis, it indicates that the changing trend of C Mn and C S with temperature would appear a turning point once the MnS inclusion started to precipitate in the high sulfur steel during the solidification process. As a result, the variation regularity of k C and k S with temperature changed accordingly due to the fact that it was easily influenced by C Mn and C S, as mentioned previously.
Precipitation starting temperature of MnS  $\left( {T_{{\rm{MnS}}}^{{\rm{ps}}}} \right)$ with different Mn and S contents.

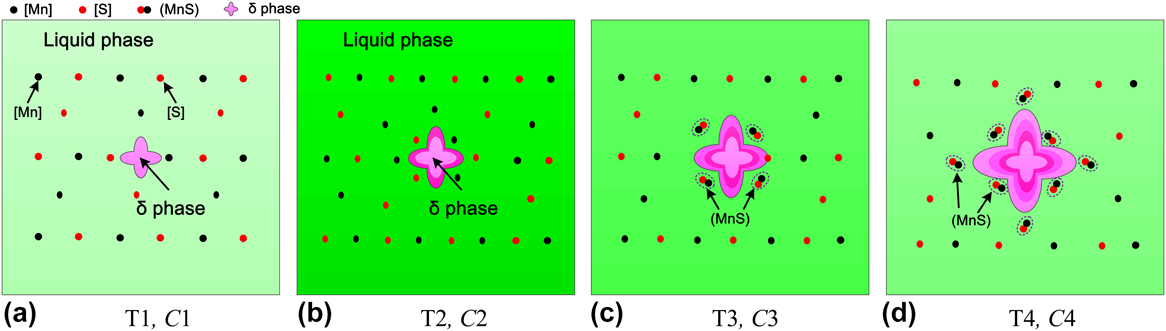
Figure 8 reveals the influence mechanism of MnS precipitation on the equilibrium partition coefficient of the solute during the solidification process of high sulfur steel. When the temperature of the alloy system was dropped to T 1 which was the liquidus temperature, the alloy system started to solidify and the liquid phase began to transform into the solid phase (L → δ phase transition), leading to an uneven distribution of solute elements in the solid and liquid phases. With the decrease of solidification temperature (T 2), the amount of the δ phase increased gradually, and the solute concentrations in the liquid phase were also correspondingly increased (C 2 > C 1) due to the redistribution and enrichment of solute elements from the solid phase to liquid phase (k i < 1). When the solidification temperature was decreased to T 3 and the thermodynamic condition was satisfied, the MnS inclusion started to precipitate at the solidification front. The concentrations of solutes Mn and S would be consumed due to MnS precipitation, and they started to reduce (C 3 < C 2) and reached a turning point. Accordingly, the thermodynamic equilibrium of the alloy solidification system would be broken and different from that where there was no MnS precipitation. The balance relation of Eq. (2) and the thermodynamic parameters in Eq. (5) would change, which have an effect on the redistribution of solute elements between solid and liquid phases. As a result, the solute concentrations in the solid phase and liquid phase would be changed, and the changing trend of solute concentrations with temperature would also be affected and present a turning point, which would finally has an effect on the solute equilibrium partition coefficients (k i) because k i were influenced by solute concentrations,Reference Kagawa, Hirata and Sakamoto15 especially for k C and k S which were more easily affected by the concentrations of Mn and S, as presented in Figs. 4 and 5. And the k C was increased with the increasing of S concentration and the decreasing of Mn concentration, while k S was opposite to k C. As the solidification temperature continued to decrease (T 4), the precipitation amount of MnS increased, and the solute concentrations continued to be consumed and influenced (C 4 < C 3). And also, the thermodynamic equilibrium of the alloy solidification continued to be influenced by MnS precipitation, and the solute equilibrium partition coefficient would continue to be affected until the end of the solidification process.
Schematic diagram of MnS precipitation and solute concentration changing in high sulfur steel solidification, T 1 < T 2 < T 3 < T 4, C 1 < C 2, and C 2 > C 3 > C 4. (a) T 1, C 1, (b) T 2, C 2, (c) T 3, C 3, and (d) T 4, C 4.

Briefly, the equilibrium partition coefficient of the solute was influenced and determined by the solute concentrations, temperature, and thermodynamic parameters [ $\varepsilon _i^{j,{\rm{L}}},\;\varepsilon _i^{j,{\rm{S}}},\;\varepsilon _i^{k,{\rm{L}}},\;\varepsilon _i^{k,S}, \ldots ,\varepsilon _i^{n,{\rm{L}}},\;\varepsilon _i^{n,S}$ in Eq. (5)] during the solidification process of the alloy, as shown in Eqs. (1)–(5). Once the MnS precipitates during solidification, the solute concentrations of Mn and S at the solidification front will be reduced. Then, the thermodynamic equilibrium of Eq. (2), the thermodynamic parameters, and the solute concentrations for the high sulfur steel solidification will be changed, leading to the changing of the solute redistribution between the solid and liquid phases. As a result, the equilibrium partition coefficient of the solute will be influenced. The changing rule with temperature will represent a turning point once there is MnS precipitation, as shown in Figs. 4 and 5.
IV. CONCLUSION
The variation of the solute equilibrium partition coefficient (k i) with solidification temperature for high sulfur steel solidification was investigated by thermodynamic calculation. And the effect of MnS precipitation on k i was explored. The conclusions are as follows:
(1) The precipitation of MnS inclusion would influence the concentrations of solutes Mn and S at the solidification front during the solidification process, leading to changing of k i.
(2) Due to the precipitation of MnS, k C and k S decreased first and then increased with solidification temperature decreasing, which has a turning point. But k Si, k Mn, and k P changed monotonously with temperature. The effect of solidification temperature on k Si and k Mn was greater than that on k C, k S, and k P.
(3) With the increase of S content, k C, k Si, and k P increased while k Mn and k S decreased. Whereas, an opposite effect was found with the increase of Mn content. The order of influenced extent by S and Mn content was k Si > k S > k Mn > k C > k P.
ACKNOWLEDGMENTS
The authors would like to thank the National Natural Science Foundation of China (NSFC) for the financial support (Project Nos. 51504048, 51611130062, and 51374260).