Implications
Feeding strategies to manipulate fat deposition have economical implications in the pig industry, as it affects carcass value and consumer’s acceptance of pork. Reported results on the impact of reduced protein diets on fat deposition in genetically diverse pigs for body fatness could advance our understanding on the biology of fat deposition in the pig and other mammalian species, including humans.
Introduction
The development of feeding strategies to improve fat partitioning in pigs is highly desirable for the meat industry. The ultimate goal is to produce pork with increased intramuscular fat (IMF) content to meet consumers’ expectations and to enhance the competitiveness of meat producers and markets.
Recently, it has been suggested that a reduction in dietary protein impacts pig’s fat partitioning, with an increase in IMF and a minor effect on the amount of subcutaneous adipose tissue (SAT) (Wood et al., Reference Wood, Nute, Richardson, Whittington, Southwood, Plastow, Mansbridge, Da Costa and Chang2004; Doran et al., Reference Doran, Moule, Teye, Whittington, Hallett and Wood2006). Reducing the proportion of protein relative to energy in the diet consistently increases fat deposition, especially at the intramuscular level, because excess energy is diverted to fat deposition (Lebret et al., Reference Lebret, Noblet and Bonneau2001; Wood et al., Reference Wood, Nute, Richardson, Whittington, Southwood, Plastow, Mansbridge, Da Costa and Chang2004). The increase in intramuscular lipids in reduced dietary protein-fed growing pigs (Da Costa et al., Reference Da Costa, Mcgillivray, Bai, Wood, Evans and Chang2004) could have important health implications because it could inadvertently reduce circulating insulin, possibly contributing to increase the risk for insulin resistance (Kelley and Goodpaster, Reference Kelley and Goodpaster2001; Guo, Reference Guo2007). This remains to be elucidated.
Adiposity may be modulated not only by reducing fat accumulation in differentiated adipocytes, but also by inhibiting the complex differentiation of preadipocytes, throughout life, into mature adipocytes (Berryman et al., Reference Berryman, List, Sackman-Sala, Lubbers, Munn and Kopchick2011). The conversion of preadipocytes into adipocytes involves the activation of key transcription factors in an orchestrated action, such as peroxisome proliferator-activated receptor γ (PPARG) and CAAT/enhancer-binding protein α (CEBPA) (Gregoire et al., Reference Gregoire, Smas and Sul1998). Both PPARG and CEBPA regulate the expression of adipocyte-characteristic genes, such as lipoprotein lipase or adipocyte fatty-acid–binding protein (A-FABP, encoded by FABP4 gene). In a terminal phase of differentiation, adipocytes markedly increase de novo lipid synthesis, and acquire sensitivity to insulin, namely, through FABP4 (Gregoire et al., Reference Gregoire, Smas and Sul1998). As the amount of triacylglycerols increases inside the mature adipocytes, leptin is produced and released into the bloodstream, signalling the brain about the total energy stored in the body (Houseknecht et al., Reference Houseknecht, Baile, Matteri and Spurlock1998).
The current study was undertaken to investigate the impact of reduced protein diets (RPDs) on fat deposition in genetically diverse pigs for body fatness, for which the cellular and molecular knowledge is still insufficient. To do so, male pigs with distinct genetic backgrounds, commercial crossbred and Alentejana purebred were selected, as they can mimic lean and fat animal models, correspondingly. The lipid content, histological features such as the adipocytes’ area and number, extramyocellular lipids (EMCLs) and intramyocellular lipids (IMCLs) stores were quantified in the SAT and longissimus lumborum (LL) muscle, respectively, in both pig genotypes fed control or RPDs. In parallel, the gene-expression levels of factors with a determinant role upon adipogenic and lipogenic processes were assessed in the same tissues and complemented with relevant systemic markers.
Material and methods
Experimental design: animals and diets
This trial was conducted at the facilities of L-INIA (INRB, Vale de Santarém, Portugal) under the guidelines for the care and use of experimental animals, following EU directive 86/609/EEC.
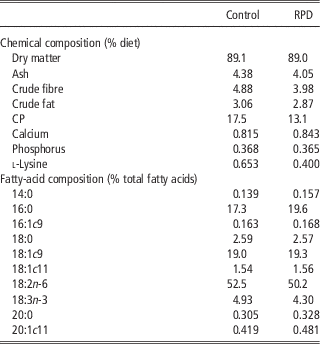
Forty crossbred (50% Large White, 25% Landrace and 25% Pietrain) ageing 138±12 days and Alentejana purebred ageing 179±8 days entire male pigs with an average weight set at 60±2 kg were selected. Before the beginning of the experiment, all animals were fed a ‘starter diet’ containing 13.0 MJ ME/kg and 1.2% of total lysine from weaning to 1 month of age, followed by an ‘intermediate diet’ containing 13.0 MJ ME/kg and 1.1% of total lysine until 25 to 30 kg of live weight and, finally, a ‘growing diet’ containing 13.0 MJ ME/kg and 0.9% of total lysine until about 60 kg of live weight. Thereafter, 10 animals from each genotype were randomly assigned to one of two diets in a 2×2 factorial design. Pigs were housed in two pens of four pigs each and one pen of two pigs per treatment (n=10 pigs per treatment). During the experiment, the animals were fed individually twice a day and had ad libitum access to water. Feed offered and refusals were recorded daily for each pig to calculate individual feed intake. The diets were isoenergetically formulated (13.5 MJ ME/kg) and differed in CP and lysine contents as follows: 17.5% of CP and 0.7% of lysine (control diet); and 13.1% of CP and 0.4% of lysine (RPD). The proximate and fatty-acid compositions of the diets are given in Table 1.
Proximate composition and fatty-acid profile of control and reduced protein (RPD) diets

Slaughter and tissue sampling
Feed was removed 17 to 19 h before slaughter. Slaughter weight was set at 93±2 kg (L-INIA experimental abattoir), corresponding to 180±14 days and 220±11 days for crossbred and Alentejana pigs, respectively. After electrical stunning and exsanguination, blood samples were collected and centrifuged (3000 r.p.m. for 15 min at room temperature) to harvest heparinized plasma. Immediately after slaughter, the SAT and LL muscle samples for gene-expression analysis were collected from the right side of the carcass at the 1st lumbar vertebra level, rinsed with sterile RNAse-free cold saline solution, cut into small pieces (thickness~0.3 cm) and stabilized in RNA later solution (Qiagen, Hilden, Germany). For histometrical analyses, samples from SAT (~100 mg) were fixed by immersion in 10% neutral-buffered formalin (Merck, Darmstadt, Germany) for 24 h and processed for paraffin (Microscopy Histosec, Merck) embedding. In addition, the LL muscle samples were dissected carefully, free of any visible fat and blood, rapidly frozen in isopentane cooled by liquid nitrogen, and stored at −80ºC, until further analyses.
Plasma biochemical assays
Triacylglycerols and glucose concentrations were analysed through diagnostic test kits (Roche Diagnostics, Mannheim, Germany), using a Modular Hitachi Analytical System (Roche Diagnostics). Insulin and leptin concentrations were determined through the Porcine Insulin RIA kit (PI-12K, Linco Research, Millipore, MA, USA) and a Multi-Species Leptin RIA kit (XL-85 K, Linco Research), respectively. The degree of insulin resistance was calculated by the homeostasis model assessment using the insulin-resistance index (HOMA-IR) (Matthews et al., Reference Matthews, Hosker, Rudenski, Naylor, Treacher and Turner1985).
IMF content
The LL muscle samples were lyophilized (−60°C, 2.0 hPa) to constant weight, kept dry at room temperature and analysed within 2 weeks. The IMF content was quantified according to the Soxhlet method with previous acid hydrolysis and extraction by petroleum ether (AOAC, 2000).
Histometrical analysis for the adipocytes in the SAT and LL muscle (EMCLs)
SAT and LL muscle serial sections with 10 μm thick were cut on a microtome (Leica, SM 2000R, Nussloch, Germany) from each of the paraffin-embedded specimens and on a cryostat (Leica, CM 3050S), correspondingly. Sections from both the tissues were stained with the classic hematoxylin (Bio-Optica, Milan, Italy) and eosin (H&E) procedure (Richard-Allan Scientific, Kalamazoo, MI, USA) to assess tissue morphology under a light microscope (Olympus BX51 equipped with a DP11 microscope digital camera system, Olympus, Tokyo, Japan). For the histometrical analysis, the area (μm2) of 100 adipocytes was determined in five fields per section, each field with a fixed area of ∼560×103 μm2 under the microscope (magnification ×100), using the DP software for image analysis (Olympus DP-Soft version 3.0 for Windows 95/98). The number of adipocytes was also determined in five fields per section, at a magnification of ×100, that is, corresponding to 80 up to 200 adipocytes per field in the SAT, and 15 to 30 adipocytes per field in the LL muscle. The entire histological plan was followed as described by Corino et al. (Reference Corino, Di Giancamillo, Rossi and Domeneghini2005).
Oil red O staining of IMCLs
LL muscle serial sections, 10 μm thick, were cut on a cryostat (Leica, CM 3050S) and mounted on uncoated precleaned (96% v/v ethanol) glass slides. The oil red O staining was performed according to Koopman et al. (Reference Koopman, Schaart and Hesselink2001) protocol. Oil red O-stained sections were examined under a light microscope (Olympus BX51 equipped with a DP11 microscope digital camera system, Olympus) and captured images (magnification of ×400) processed using the ImageJ software (NIH, http://rsb.info.nih.gov/ij/). The lipid droplet area (IMCLs) was determined and expressed in μm2.
Real-time quantitative PCR (RT-qPCR)
The detailed procedures concerning RNA extraction, cDNA synthesis, primer sequences for PPARG, CEBPA, and FABP4 and housekeeping genes (RPLP0 and RPS29), and overall RT-qPCR are described in Madeira et al. (Reference Madeira, Pires, Alfaia, Costa, Luxton, Doran, Bessa and Prates2013). Briefly, total RNA was isolated and purified using the RNeasy lipid tissue mini kit (Qiagen) and the RNeasy fibrous tissue mini kit (Qiagen) for the SAT and LL muscle, respectively. Reverse transcription was performed with a High-Capacity cDNA Reverse Transcription Kit (Applied Biosystems, Foster City, CA, USA). Gene-specific intron-spanning primers were designed based on Sus scrofa sequences (www.ncbi.nlm.nih.gov). RT-qPCR was performed on a StepOnePlus thermocycler (Applied Biosystems) at standard cycling conditions. Relative amounts for each target gene was calculated using the geometric mean of RPLP0 and RPS29 as a normalizer.
Statistics
Values are presented as mean±standard error (s.e.) for plasma metabolites, and histological and gene expression analyses of the SAT and LL muscle. Data were checked for normal distribution and variance homogeneity. As variance heterogeneity was detected for most parameters, data were analysed using Proc MIXED of SAS software package, version 9.2 (SAS Institute, Cary, NC, USA) with a model including the genotype and diet and its interactions as fixed effects, but allowing for variance heterogeneity between groups. Least-square differences were applied to detect differences between means when significant effects were detected. The level of statistical significance was set at P<0.05.
Results
Plasma insulin and leptin concentrations are influenced by genotype, and triacylglycerols are affected by dietary protein reduction
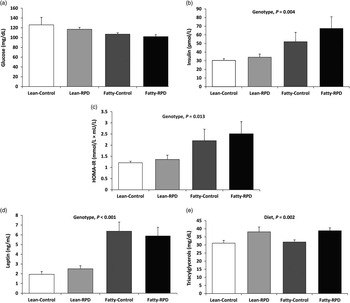
A genotype effect (Figure 1) was observed for insulin, insulin-resistance index and leptin concentrations in plasma, with the fat pigs having higher values of these systemic markers than the lean pigs (Figure 1b, P<0.01; Figure 1c, P<0.05; Figure 1d, P<0.001, respectively). Pigs fed on RPDs had higher plasma triacylglycerol than pigs fed the control diet (Figure 1e, P<0.01). Neither genotype nor dietary protein reduction influenced circulant glucose levels (Figure 1a, P>0.05).
Effect of genotype and dietary protein on plasma hormones and metabolites. Statistical significances are shown for the effects of genotype (lean v. fatty) and diet (control v. reduced protein diet (RPD)) at P<0.05.

Subcutaneous fat deposition is strongly determined by genotype but not by dietary protein reduction
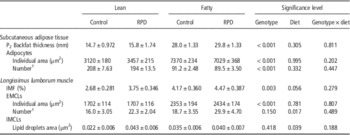
Table 2 and Supplementary Figure S1 (panel A) display the effects of both dietary treatments on fat deposition parameters in the SAT from the lean and fat pigs. Subcutaneous fat deposition at the P2 level was strongly influenced by genotype (P<0.001), with consistently higher thickness values in the fat than in the lean pigs. The fat pigs also displayed larger adipocytes (P<0.001) when compared with the lean pigs. Consequently, the number of adipocytes in a fixed tissue area was much lower in fatty than in lean genotype (P<0.001). Dietary protein level had no significant effect on these SAT traits (P>0.05).
Effect of the reduced protein diets (RPD) on fat deposition parameters in the subcutaneous adipose tissue and longissimus lumborum muscle from lean and fat pigs

IMF=intramuscular fat; EMCLs=extramyocellular lipids; IMCLs=intramyocellular lipids.
†In a fixed area with 560×103 μm2.
EMCL area and number are affected by genotype and dietary protein reduction
The IMF content of the LL muscle was higher in the fat pigs (P<0.001, Table 2). Moreover, on average, the IMF tended to be higher in pigs fed the RPD when compared with pigs fed the control diet (P=0.056, Table 2). Supplementary Figure S1 (panel B) illustrates typical muscle cross-section stained with classic H&E for EMCLs, as the adipocytes marked by a large arrowhead, clustered along myofibre fascicule. The number of these adipocytes was influenced by diet (P<0.05, Table 2) with pigs fed RPD having more adipocytes than pigs fed the control diet. In contrast, when assessing individual adipocyte’s area, the fat pigs had larger adipocytes than the lean pigs (P<0.001, Table 2), in resemblance to the variations reported for the SAT, but the dietary protein level did not influence the individual adipocyte’s area (P>0.05).
Larger adipocytes in the SAT than in the LL muscle are influenced by genotype
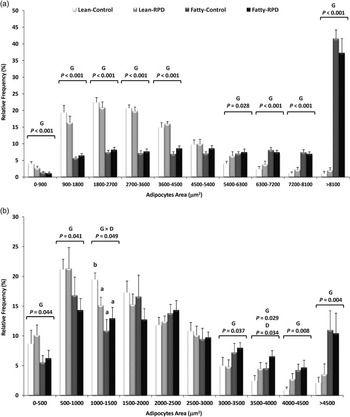
When comparing adipocytes’ individual area between SAT and LL, smaller adipocytes were observed in the muscle (Table 2). Following on this result, we decided to perform a histometrical analysis applying the Sturges’ rule (Sturges, Reference Sturges1926) to both the tissues. Ten classes of adipocytes’ area of 900 and 500 μm width were constructed for the SAT and LL muscle, respectively. Both histograms are presented in Figure 2. The range of adipocytes’ area varied from 0 to >8100 μm2 in the fat depot, whereas for the LL muscle it varied from 0 to >4500 μm2. For the SAT (Figure 2a), a consistent pattern of genotype effect was observed for most of the adipocyte classes with larger adipocytes in fat pigs (P⩽0.028). The only noteworthy exception was for the medium adipocyte class, ranging from 4500 to 5400 μm2, for which no significant genotype variation was detected (P>0.05). Similarly, in the LL muscle, for smaller (0 to 500 and 500 to 1000 μm2) and larger (3000 to 3500, 3500 to 4000, 4000 to 4500 and >4500 μm2) adipocytes’ classes, a genotype influence was observed as the lean pigs had, once more, minor adipocytes’ area (P<0.05; Figure 2b). Curiously, in the class ranging from 1000 to 1500 μm2, an interaction between genotype and diet (P<0.05) was detected. The lean pigs fed the control diet displayed a higher proportion of adipocytes in this class (i.e. higher percentage of small adipocytes) in comparison with the lean pigs fed RPD diet and with fat pigs fed both the diets. In addition, the adipocyte class ranging from 3500 to 4000 μm2 was affected by diet (P<0.05) with the lean and fat pigs fed RPD showing higher proportion of these large adipocytes than pigs from both genotypes fed the control diet.
Adipocyte area distribution of subcutaneous adipose tissue (a) and longissimus lumborum muscle (b) from lean and fat pigs fed control or reduced protein (RPD) diets. Statistically significant differences are shown for the effects of genotype (G) (lean v. fatty), diet (D) (control v. RPD) and interaction between genotype and diet (G×D) at P<0.05. Means on columns with different superscript letters are significantly different (P<0.05).

IMCLs are dependent on dietary protein reduction rather than on genotype
Supplementary Figure S1 (panel C) shows typical muscle cross-section stained for IMCLs, as lipid droplets marked by a small arrowhead, within myofibre cytoplasm. The area occupied by lipid droplets in the LL muscle fibres was higher in pigs fed RPD (P<0.05), but it was not influenced by genotype (P>0.05) (Table 2).
mRNA expression levels of PPARG, CEBPA and FABP4 are different between the SAT and LL muscle
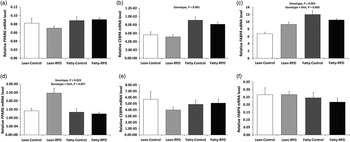
Figure 3 presents the relative expression levels of PPARG, CEBPA and FABP4 mRNA in the SAT and LL muscle of the lean and fat pigs fed control and RPD. Interestingly, the pattern of mRNA expression of these key lipogenic factors was differential between those tissues, as detailed below. No significant differences were found for the PPARG gene expression among groups in the SAT (Figure 3a, P>0.05). In contrast, in the LL muscle, the PPARG mRNA expression level was higher in the lean than in the fat pigs (Figure 3d, P<0.05), mainly because of the higher expression level in the lean pigs fed RPD diet compared with other groups (genotype×diet interaction, P=0.057). Compared with the lean pigs, the relative CEBPA and FABP4 mRNA levels in the SAT were significantly higher (Figure 3b and c, P<0.001) in the fat pigs, but no significant differences were detected in the LL muscle between the two genotypes (Figure 3e and f, P>0.05). Relative to the SAT, in the lean pigs fed the RPD, the FABP4 expression was higher than in the lean pigs fed the control diet (Figure 3c, P<0.01), the fat pigs fed control or RPD diets being intermediate (genotype×diet interaction, P=0.005).
Relative mRNA levels of PPARG, CEBPA and FABP4 in the subcutaneous adipose tissue (a, b and c) and longissimus lumborum muscle (d, e and f) from lean and fat pigs fed control or reduced protein (RPD) diets. Statistically significant differences are shown for the effects of genotype (lean v. fatty) and interaction between genotype and diet at P<0.05.

Discussion
The pig, a monogastric species, is susceptible to changes in the fat composition of tissues, using different feeding strategies (Gondret and Lebret, Reference Gondret and Lebret2002; Wood et al., Reference Wood, Nute, Richardson, Whittington, Southwood, Plastow, Mansbridge, Da Costa and Chang2004; Alonso et al., Reference Alonso, Campo, del, Provincial, Roncalés and Beltrán2010). This study documents and compares fat deposition in the SAT and LL muscle of lean and fat pigs under dietary protein reduction from a cellular and gene-expression perspective. Deficiency in lysine, which is the first limiting amino acid in feedstuffs based on cereal grains fed to pigs (Corino et al., Reference Corino, Musella, Pastorelli, Rossi, Paolone, Costanza, Manchisi and Maiorano2008), reduces protein synthesis and leads to increased fat deposition in pigs (Witte et al., Reference Witte, Ellis, McKeith and Wilson2000). Information concerning the biology and regulation of fat deposition in the SAT opposing to the skeletal muscle is still somewhat limited.
In this study, plasma leptin and insulin concentrations showed a consistent relationship with fatness, as the fat pigs from Alentejana purebred had higher values of both systemic markers. Leptin is synthesized and released into the bloodstream in a direct proportion to the amount of body fat mass, reflecting primarily the triacylglycerols content of lipid depots, but also functioning as a sensor of energy balance (Houseknecht et al., Reference Houseknecht, Baile, Matteri and Spurlock1998). In addition, systemic leptin levels are strongly associated with leptin mRNA expression in the SAT, and also with adipose cellularity (Zhou et al., Reference Zhou, Zhao, Wei, Xia, Xu and Chen2004). This is in line with enlarged adipocytes found in the fat pigs. Sequestration of lipids into the adipose tissue is a critical process in the control of glucose homeostasis (Le Lay and Dugail, Reference Le Lay and Dugail2009). Indeed, leptin has the ability to reduce intracellular lipid levels in the skeletal muscle, thereby improving insulin sensitivity (Ronti et al., Reference Ronti, Lupattelli and Mannarino2006). Following on the results found for insulin, the HOMA-IR index was, as one would expect, affected by genotype with higher values in the fat pigs when compared with the lean pigs, although without evidence for insulin resistance. In fact, the HOMA-IR values found are low and therefore indicative of insulin sensitivity rather than insulin resistance (Liu et al., Reference Liu, Wang, Yin, Li, Cai, Zhang, Xiao, Hou, Li and Zu2007). Moreover, in a terminal phase of differentiation, adipocytes markedly increase their de novo lipid synthesis and become responsive to insulin, namely, through A-FABP, which is responsible for the transport of fatty acids into adipocytes (Furuhashi and Hotamisligil, Reference Furuhashi and Hotamisligil2008). The gene encoding this protein was overexpressed in the SAT from fat relative to lean pigs, thus corroborating both cellularity and the aforementioned plasma metabolites. In turn, the skeletal muscle is the primary site of insulin-stimulated glucose disposal and whole-body lipid oxidation (Koranyi et al., Reference Koranyi, Bourey, Vuorinen-Markkola, Koivisto, Mueckler, Permutt and Yki-Jiirvinen1991).
The histogram analysis for the SAT revealed that for smaller adipocytes, the relative frequency was the highest in the lean pigs, whereas for larger adipocytes the relative frequency was the highest in the fat pigs. For the intermediate class (4500 to 5400 μm2), there was no prevalence of a genotype. This pattern was concomitant with the differential expression of lipogenic genes in the SAT from lean and fat pigs. The higher CEBPA mRNA levels (Madeira et al., Reference Madeira, Pires, Alfaia, Costa, Luxton, Doran, Bessa and Prates2013) could therefore be a consequence of larger, more mature adipocytes in the fat pigs, when compared with the lean pigs. These results could indicate that adipocyte’s differentiation occurred earlier in the fat than in the lean pigs. However, at 93 kg of live weight, the fat pigs were 40 days older than the lean pigs. Therefore, one cannot conclude whether differences in adipocyte hypertrophy between the lean and fat pigs result from a strict genetic effect, or from an age effect. Moreover, these differences in the stage of adipose tissue development might have contributed to a greater sensitivity of the lean genotype to diet composition. Indeed, FABP4 expression was enhanced when the lean pigs were fed RPD, but the same response was not observed in the fat pigs.
The PPAR signalling pathway is of key importance during adipogenesis and lipogenesis (Cánovas et al., Reference Cánovas, Quintanilla, Amills and Pena2010). PPARG is generally accepted a master regulator of adipocyte differentiation (Le Lay and Dugail, Reference Le Lay and Dugail2009) and a transcription factor that promotes fat accumulation (Tontonoz and Spiegelman, Reference Tontonoz and Spiegelman2008). The PPARG gene-expression patterns in the muscle tissue stand in opposition to the variations of the remaining lipogenic factors. In fact, CEBPA and FABP4 mRNA levels in the SAT were increased in the fat pigs, without noticeable changes in the LL muscle. FABP4 protein level has been associated with pig’s growth stage (Cho et al., Reference Cho, Kwon, Kim, Park, Kim, Nam, Jang, Choi, Bang and Kim2011), backfat thickness (Michal et al., Reference Michal, Zhang, Gaskins and Jiang2006) and IMF content (Damon et al., Reference Damon, Louveau, Lefaucheur, Lebret, Vincent, Leroy, Sanchez, Herpinand and Gondret2006). Moreover, FABP4 could be perceived as a marker for adipocyte number (Hocquette et al., Reference Hocquette, Gondret, Baeza, Medale, Jurie and Pethick2010). For the SAT, FABP4 mRNA levels were 40% higher in the fat than in the lean pigs, which is in agreement, again, with higher backfat thickness. In contrast, the FABP4 mRNA expression level in the LL muscle was unaltered neither by genotype nor by dietary protein reduction (Madeira et al., Reference Madeira, Pires, Alfaia, Costa, Luxton, Doran, Bessa and Prates2013), despite the higher IMF contents found in fat than in lean pigs, in agreement with Damon et al. (Reference Damon, Louveau, Lefaucheur, Lebret, Vincent, Leroy, Sanchez, Herpinand and Gondret2006). Moreover, the IMF tended to increase with low levels of dietary protein without variation in backfat thickness, as reported by Lebret et al. (Reference Lebret, Noblet and Bonneau2001). These results are pointing towards a tissue-specific activation of porcine lipogenic enzymes and transcription factors by RPD. The intramuscular adipose tissue, which is the last fat depot to develop, may respond differently to external signals, particularly nutritional requirements, than other fat sites (Gondret and Lebret, Reference Gondret and Lebret2002; Berryman et al., Reference Berryman, List, Sackman-Sala, Lubbers, Munn and Kopchick2011). Finally, the histogram analysis for the LL muscle revealed a similar pattern to the one found for the SAT. However, contrary to the SAT, neither CEBPA nor FABP4 mRNA levels in the muscle were significantly different among experimental groups. Yet, for PPARG it was found that lean pigs, particularly those fed RPDs, had higher expression levels in the LL muscle than fat pigs. This could indicate that, in lean pigs, protein and lysine reduction promoted adipogenesis in the muscle, by stimulating preadipocyte differentiation, which would be in agreement with a higher frequency of smaller adipocytes in comparison with fat pigs.
It is possible that, as a result of its low potential for lean tissue deposition, the protein and lysine levels used in this study exceeded the Alentejana purebred nutritional requirements and substantial amounts of the feed protein provided were used for fat gain, increasing indiscriminately all body fat depots, including both IMF content and EMCLs by means of larger adipocytes. According to Damon et al. (Reference Damon, Louveau, Lefaucheur, Lebret, Vincent, Leroy, Sanchez, Herpinand and Gondret2006), the main part of IMF variability depends on differences in the number of intramuscular adipocytes located between fibre bundles, which are not related to fibre-type composition and energy catabolism, but would rather reside within the intramuscular adipocytes per se in relation to their environment. This explanation fits well with the variations on lipid deposition and adipocyte cellularity found in the LL muscle of pigs fed reduced protein level within both genotypes. In these former pigs, EMCL number and IMCLs were increased by dietary protein reduction, as well as the content of triacylglycerols in plasma, as confirmed through the quantification of more adipocytes and larger area occupied by lipid droplets. This can be partially explained by the key regulator of adipogenesis, PPARG (Le Lay and Dugail, Reference Le Lay and Dugail2009), for which mRNA levels were increased (P=0.057) in the LL muscle by RPDs in lean but not in fat pigs.
This variation observed in the LL muscle, but not in the SAT, of lean pigs fed low protein diets with high energy has been previously described by Guo et al. (Reference Guo, Tang, Wang, Liu and Wang2011). The increase of intramuscular lipids in dietary protein-restricted growing pigs (Da Costa et al., Reference Da Costa, Mcgillivray, Bai, Wood, Evans and Chang2004) could have negative health implications, if a reduction in circulating insulin occurs. This possibility cannot be ruled out even if not confirmed in this study. Herein, dietary protein level had no impact whatsoever on systemic insulin and this might be related to the fact that, although IMCLs were increased ~1.5-fold between control and RPD-fed pigs, the respective lipid droplet area was actually very small. In addition, it may also refer to difference in the period of dietary induction that started in young pigs (i.e. in a period of marked myofibre hypertrophy) and not in adult individuals (Guillerm-Regost et al., Reference Guillerm-Regost, Louveau, Sébert, Damon, Champ and Gondret2006). Reinforcing this argument, the mRNA levels of CEBPA and FABP4, assessed in the LL muscle with divergent intramuscular phenotypes, remained unaltered by dietary protein reduction.
The differential gene expression pattern of key lipogenic factors PPARG, CEBPA and FABP4 between the SAT and the LL muscle, regarding genotype and diet effects as well as the magnitude of responses, has already been reported (Zhou et al., Reference Zhou, Wang, Wang, Zhu, Shu, Liao, Yu, Gao, Xi, Wang, Zhang, Yuan and Jiang2010; Madeira et al., Reference Madeira, Pires, Alfaia, Costa, Luxton, Doran, Bessa and Prates2013). One can speculate that the lipogenic and lipolytic pathways are downregulated in intramuscular adipocytes compared with fat cells from other depots, in particular SAT. This result might be a direct consequence of the relatively low proportion of adipocytes found in the LL muscle.
Conclusions
The genetic background plays a determinant role upon fat deposition in the pig model. Increased backfat thickness in fat pigs was supported by enlarged adipocytes in parallel with the upregulation of transcription factor CEBPA and insulin-sensitizing protein FABP4 genes. This last marker might be held responsible for enhanced circulating insulin and leptin levels found in the fatty genotype. The reduction of dietary protein negatively affected plasma triacylglycerols, the area of lipid droplets within the LL fibres and the number of EMCLs, which were proven to be unrelated to PPARG, CEBPA and FABP4 mRNA levels in the LL muscle. Overall, the pattern of gene expression of the selected key lipogenic factors in the SAT was distinct from the one found in the LL muscle, both in terms of regulation and magnitude of responses, given the composition in adipocytes and individual metabolic function of both tissues.
Acknowledgements
Financial support from Fundação para a Ciência e a Tecnologia (FCT) grant (PTDC/CVT/2008/99210) and individual fellowships to Ana S. H. Costa (SFRH/BD/2009/61068), Paulo Costa (SFRH/BPD/2008/46135), Virgínia M. R. Pires (SFRH/BPD/2009/64347) and Marta S. Madeira (SFRH/BD/2008/48240) are acknowledged. Paula A. Lopes is a researcher from the FCT program ‘Ciência 2008’. The authors are grateful to Instituto Nacional dos Recursos Biológicos (INRB, Fonte Boa, Vale de Santarém, Portugal) slaughterhouse staff, in particular Paula Menezes for help in tissue sampling. They also thank Sandra Carvalho for assistance in microscope slides preparation.