


Who runs for office? How many candidates can we expect to compete in a winner-take-all election? Are those who run for political office representative of the views of the general polity? How might entry depend upon the role of political organizations, such as parties, in the selection of candidates? Here, we examine these and related questions in a laboratory experiment by testing predictions derived from a citizen–candidate entry game and comparing entry behavior across several different environments. The citizen–candidate model, which originates in Besley and Coate (Reference Besley and Coate1997) and Osborne and Slivinski (Reference Osborne and Slivinski1996), departs from the canonical spatial model of electoral competition with exogenous politicians (Downs Reference Downs1957; Hotelling Reference Hotelling1929) in two important ways.Footnote 1 First, the candidates are citizens with policy preferences (as in Wittman Reference Wittman1983) who vote in the election and, once elected, implement their own taste as the common policy. Second, the voting stage is preceded by an entry stage where each citizen decides whether to throw her hat in the ring. Thus, a citizen’s objective function not just takes into account the benefits of holding office (“spoils of office”) as in the canonical model, but it also includes the cost of candidacy and the benefit of reducing the possibility of less desired policies that would be implemented by other potential candidates. Because the citizens themselves decide on whether to run for office, both the number and the ideological composition of entering candidates are modeled as equilibrium outcomes. Crucially, their entry decisions are asymmetric since citizens with different policy preferences will anticipate different benefits from policy implementation. Coordination problems are also present due to nontrivial strategic uncertainties.
In the standard citizen-candidate model, all citizens are endowed with complete information about the exact location of all others’ ideal points, and hence can infer the exact location of each entering candidate. However, many empirical studies indicate that citizens tend to have limited knowledge about the candidates’ exact stances on policy issues (e.g., Campbell et al. Reference Campbell, Converse, Miller and Strokes1960; Lupia Reference Lupia2016; Palfrey and Poole Reference Palfrey and Poole1987; Zaller Reference Zaller1992). We can think of various reasons why this is the case. For example, time and willpower is scarce so that many citizens simply cannot be as well informed about the policy intentions of candidates as, say, special interest groups. Or, politicians often remain quiet about their true intentions during campaigns due to strategic incentives and it is almost impossible for citizens to discover these tastes, even if they are willing to exert effort. More realistically, citizens have only incomplete information about the location of the entering candidates, and this leads us to adopt a Bayesian game formulation of the entry game.
The experiment is based on a laboratory implementation of the following citizen–candidate entry game with incomplete information (Großer and Palfrey Reference Großer, Palfrey, Aragonés, Beviá, Llavador and Bilbao2009, Reference Großer and Palfrey2014). An electorate of n citizens is electing a leader to implement a policy outcome by plurality voting. Each citizen has a privately known ideal point in a one dimensional policy space. These ideal points are iid draws from a commonly known, uniform distribution over the policy space. A citizen’s utility from the policy outcome declines linearly in the absolute distance from her ideal point. The game has two decision-making stages. In the first stage (Entry), citizens decide independently and simultaneously whether and pay a cost c > 0 to become a candidate in the election, or not enter and bear no cost. In the second stage (Voting), each citizen casts a vote for exactly one of the candidates. In the baseline model, citizens must vote without any additional information about the candidates’ ideal points (of course, the contenders know their own ideal point). The candidate with the most votes becomes the leader and receives a bonus b > 0 (i.e., the spoils of office) and her ideal point is automatically implemented as the common policy. Ties are broken randomly. Finally, if nobody enters, then a leader is randomly selected from all the citizens and her ideal point becomes the common policy.
This citizen–candidate entry game with incomplete information yields sharp predictions about the distribution of the entrants’ ideal points and the rate of entry (i.e., entry as a fraction of the electorate size). The key property of equilibrium is political polarization in the sense that candidate entry is from the extremes of the policy space, contrary to usual centrist predictions of most models of political competition. Specifically, the unique symmetric Bayesian Nash equilibrium (BNE) in the baseline entry game consists of a left and right cutpoint,  $\left( {{{\check{x}}_{\rm{l}}},{{\check{x}}_{\rm{r}}}} \right)$, where each citizen with an ideal point at either cutpoint or to the left of
 ${\check{x}_{\rm{l}}}$ or to the right of
 ${\check{x}_{\rm{r}}}$ enters the political competition, while every citizen with an ideal point between the two cutpoints does not enter.Footnote 2 Based on this equilibrium, one can also compute expected economic welfare and its various components, and derive comparative statics predictions of interest such as the effects of electorate size, entry costs, benefits of holding office, and the distribution of ideal points on entry decisions and welfare.
The intuition for why asymmetric information about citizen and candidate ideal points creates political polarization can be explained by a simple example. Suppose the policy space is [−1, 1] and there are three entrants with ideal points at −1, 0, and 1, respectively. Then, each candidate has a one-third chance of winning the election (i.e., they each vote for themselves and, because ideal points are private information, each non-candidate votes randomly for one of them). With identical entry costs and office-holding benefits, they only differ in their expected policy losses if a rival candidate happens to win. In our example, for each of the two extreme candidates, the expected loss equals 1, while the expected loss is only 2/3 for the moderate candidate. This illustrates what turns out to be a general property of the model: extreme citizens have a stronger incentive to enter the political competition than moderate citizens, and this is the basis for the emergence of political polarization in the model. The result holds more generally for any smooth probability distribution of ideal points (Großer and Palfrey Reference Großer and Palfrey2014) and weakly concave preferences of voters. Importantly, polarization is welfare reducing since ex ante the expected total policy loss is minimized when the common policy is a centrist ideal point.
Because in our baseline model symmetric BNE in cutpoint strategies is unique, potentially difficult issues of equilibrium selection are avoided. By contrast, citizen–candidate models with complete information about candidate ideal points (e.g., Besley and Coate Reference Besley and Coate1997; Osborne and Slivinski Reference Osborne and Slivinski1996) usually have multiple equilibria and therefore are more difficult to evaluate empirically even in the lab. A second advantage of the incomplete information approach is that our distributional predictions are qualitative predictions about polarization and the number of entrants is more robust to a wide range of environmental parameters one expects to encounter in the field. In fact, existing empirical evidence strongly suggests that policy preferences of politicians are more polarized than the citizens they represent (e.g., Bafumi and Herron Reference Bafumi and Herron2010; DiMaggio, Evans, and Bryson Reference DiMaggio, Evans and Bryson1996; Fiorina, Abrams, and Pope Reference Fiorina, Abrams and Pope2006; McCarty, Poole, and Rosenthal Reference McCarty, Poole and Rosenthal2006). Beyond this empirical support, our approach offers a theoretical foundation for possible mechanisms that can lead to political polarization. The experiment provides additional evidence by generating data on entry behavior in carefully controlled environments, in order to assess the plausibility of these theoretical mechanisms.Footnote 3
While incomplete information is surely an important consideration in elections, the model described above explores a polar case where citizens are completely uninformed about the candidates’ ideal points, except for the inference they can make from equilibrium strategies, to wit, that entry comes from the extremes. It is interesting to explore an intermediate case of incomplete information that also corresponds to the widely observed phenomenon that ideologically based parties act as gatekeepers in the candidate entry stage. As a result, most citizens are aware of the party affiliations of candidates, which are, for example, communicated via nominating conventions, and since parties are ideological they can use this crucial piece of information as a credible cue about a candidate’s ideal point, for their voting decision (e.g., Ansolabehere, Rodden, and Snyder Reference Ansolabehere, Rodden and Snyder2008; Snyder and Ting Reference Snyder and Ting2002).
To account for relevant party cues, we extend the baseline citizen–candidate entry game by introducing a left and a right party that each nominates a candidate from the pool of entrants on their side of the political spectrum (we assume that each entrant has an equal chance of becoming her party’s nominee), and citizens are informed about each nominee’s party affiliation. This provides some useful voting information, although the exact ideal points of the party nominees are not revealed. This “directional information” has two important effects. First, it leads to fewer and even more polarized entrants than in the absence of parties. This is because a citizen always votes for her preferred party nominee so, availing the own vote, her updated belief that this nominee prevails in the election is greater than 50 percent for our symmetric distribution of ideal points. As a consequence, ceteris paribus, the ex-ante expected loss from the policy outcome is smaller with than without parties, which in equilibrium translates into a lower incentive to run for office, more extreme cutpoints, and thus fewer entrants. Second, political parties enable implicit vote coordination; that is, citizens vote for the nominee whose ideal point is from the same direction as the own one. Importantly, such coordination is welfare enhancing in expectation since the majority party is more likely to win. Notice that while the majority can sometimes also be defeated if none of its citizens runs for office, this must not be inefficient as they are all more moderate than the respective cutpoint. Overall, in expectation, political parties raise welfare since the lower total entry expense and greater chances of the majority party outweigh the greater total policy loss caused by more extreme leaders.
By including treatments both with and without political parties, our experiment offers a clean test of the hypothesis that party-organized elections increase political polarization on average but at the same time do not reduce welfare. The experiment also varies the environment in two other dimensions: electorate size and entry cost. Both of these have intuitive theoretical effects, that is, expected entry rates decrease in both electorate size and entry cost. The decrease in entry rates arises from the equilibrium cutpoints becoming more extreme, which immediately implies that political polarization is increasing in both the electorate size and the entry cost.
Casual observation of historical trends in U.S. politics is suggestive of support for some of these theoretical comparative statics. For example, the snowballing costs of mounting a successful campaign for national office in the United States in the past decades (e.g., due to greater costs of television advertisement and the relaxation of contribution limitations) should lead to greater candidate polarization according to our model, which has indeed been observed. Also, in the U.S. Congress, the number of senators and representatives (100 and 435, respectively) has been constant since 1963, while at the same time, the U.S. population has grown by about eighty percent since 1960 and so the electorate has also grown. Our model predicts that an increase in the electorate size increases candidate polarization. Of course, neither of these observations provides a clean test of the theory. There are many other confounding factors, so a causal effect cannot be reasonably argued. Indeed, this is one of the benefits of a laboratory experiment, where the specific variables of interest can be isolated, enabling valid causal inferences.
Looking ahead at the results briefly, in all treatments conducted in the experiment, we observe the key polarization effect: the probability of candidate entry is increasing in the distance between the median and a citizen’s ideal point. All of the model’s primary comparative static properties of entry behavior find support in the data. And, all the model’s primary comparative static properties about welfare are also supported. Quantitatively, relative to the theoretical equilibrium, we observe higher rates of entry for those treatments where entry is predicted to be below 50 percent and weakly lower entry rates for those treatments where predicted entry is above 50 percent. This pattern of departure from BNE is consistent with past experiments on entry in much different settings (see Goeree and Holt Reference Goeree and Holt2005) and is a general property of regular quantal response equilibrium in these games (Goeree, Holt, and Palfrey Reference Goeree, Holt and Palfrey2016).
RELATED LITERATURE
We are aware of just three other citizen candidate experiments, which all study plurality elections with complete information about candidate ideal points and vary the entry cost (Cadigan Reference Cadigan2005; Elbittar and Gomberg Reference Elbittar, Gomberg, Aragonés, Beviá, Llavador and Bilbao2009; Kamm Reference Kamm2016).Footnote 4 Specifically, Cadigan (Reference Cadigan2005) uses a pen-and-paper experiment with electorates of five participants who have distinct ideal points and independently and simultaneously decide on whether to become a candidate. The electoral composition and ideal points are constant throughout, but after each election ideal points are reallocated among the participants. Furthermore, participants automatically vote sincerely for the candidate nearest to the own location to select the leader, who receives a bonus and whose ideal point is declared the common policy. If nobody enters, then one participant is randomly appointed the leader. Elbittar and Gomberg (Reference Elbittar, Gomberg, Aragonés, Beviá, Llavador and Bilbao2009) and Kamm (Reference Kamm2016) employ setups similar to the one just described, but a few differences are worth mentioning. For example, their experiments are computerized and sincere votes are exclusively cast by an infinite number of non-candidate robots with uniformly distributed ideal points over the continuum [0,100]. Also, Elbittar and Gomberg use electorates of three or five participants located at three feasible policies and the default policy if none of them enters is that all must pay a large penalty.Footnote 5 We can summarize the three main common results of these citizen-candidate experiments as follows. First, there are more candidates on average when the entry cost is lower. Second, relative to Nash equilibrium (NE), there is over-entry on average. Third, the qualitative predictions of entry are mostly supported by the data and some learning toward equilibrium play is observed. Looking more closely at their results, if the entry cost is high, the unique NE is that only the median citizen enters (Elbittar and Gomberg have two pure strategy NE, each where one of two median citizens enters). The median participant does indeed enter often but, against the prediction, so do her or his immediate neighbors (albeit to a much lesser extent in Cadigan). By contrast, two pure strategy NE arise for a low entry cost, one with only the median citizen entering and one with the median’s immediate neighbors entering (again, Elbittar and Gomberg have multiple such equilibria). However, in the experiments, coordination on one of these equilibria usually does not occur. Next, in addition to plurality elections, Elbittar and Gomberg (Reference Elbittar, Gomberg, Aragonés, Beviá, Llavador and Bilbao2009) study run-off elections and Kamm (Reference Kamm2016) examines proportional representation. Elbittar and Gomberg observe a predicted shift in average entry toward the median in run-off elections relative to plurality voting. Kamm adopts proportional representation à la Hamlin and Hjortlund (Reference Hamlin and Hjortlund2000), where the common policy is the vote-weighted average of the candidate ideal points and the leader bonus is given to the contender with most votes (ties are broken randomly). As predicted, he finds more polarized entry than with plurality voting. Although we too explore plurality voting and how the entry cost affects the decision to run for office, our study is very different from these other citizen-candidate experiments. In particular, we explore incomplete information about candidate ideal points, as opposed to the complete information they study, which yields mostly unique distributional predictions of who enters. To our knowledge, we also present the first experiment examining how party cues and electorate size influence political polarization and welfare.
THE MODEL
We adapt the Großer and Palfrey (Reference Großer and Palfrey2014) citizen–candidate model with a continuous policy space for the case of a discrete policy space, which is implemented in the experiment. An electorate of n citizens is electing a leader to implement a common policy γ from the set Γ = {1, 2,…, 100}. Each citizen i has a privately known ideal point x i that is an iid draw from a uniform distribution also over Γ, where i’s payoff from the policy outcome, v(x i, γ) = −|x i − γ|, is linearly decreasing in the absolute distance between her ideal point and the policy outcome, γ.
Equilibrium without Parties
We first describe and analyze the case where there are no parties. In the first stage (Entry), citizens independently and simultaneously decide whether to enter as a candidate and pay a cost c > 0, or not enter and bear no cost. In the second stage (Voting), each citizen (including each of the entrants) votes for one of the candidates, possibly herself. The candidate with the most votes is elected and receives an office holding benefit of b ≥ 0. Ties are broken randomly. If no citizen enters, then a default policy, d, takes effect, randomly selecting one citizen as the leader who receives b but does not pay c. The leader’s ideal point is implemented as the policy outcome. Summarizing, the total payoff of citizen i is given by
 $${\pi _i}\left( {K,{x_i},\gamma ,{e_i},{w_i}} \right) = K - \left| {{x_i} - \gamma } \right| - {e_i}c + {w_i}b \hbox,$$
where K is a constant, e i = 1 if she entered (e i = 0 otherwise), and w i = 1 if she is the leader (w i = 0 otherwise). We assume citizen i is risk neutral and maximizes the expected value of πi.
The perfect Bayesian equilibrium (PBE) of our citizen candidate game has the following properties.Footnote 6 In the Voting stage, each candidate votes for herself and each non-candidate votes randomly with equal probability for one of the contenders. In the symmetric BNE of the Entry stage, each citizen i follows the cutpoint strategy
 $${\check{e}_i} = \left\{ {\matrix{ 0 \hfill & {{\rm{if}}} \hfill & {{x_i} \in \left\{ {{{\check{x}}_{\rm{l}}} + 1, \ldots ,{{\check{x}}_{\rm{r}}} - 1} \right\}} \hfill \cr 1 \hfill & {{\rm{if}}} \hfill & {{x_i} \in \left\{ {1, \ldots {{\check{x}}_{\rm{l}}}} \right\} \cup \left\{ {{{\check{x}}_{\rm{r}}}, \ldots ,100} \right\}} \hfill \cr} \hbox,} \right.$$
where  $\left( {{{\check{x}}_{\rm{l}}},{{\check{x}}_{\rm{r}}}} \right)$ is an ideal point pair with
 $1 \,\le\, {\check{x}_{\rm{l}}} \,\le\, 50$ and
 ${\check{x}_{\rm{r}}} = 101 - {\check{x}_{\rm{l}}}$.Footnote 7 That is, the cutpoint strategy
 ${\check{e}_i}$ dictates that each citizen with an ideal point at or more “extreme” than
 ${\check{x}_{\rm{l}}}$ or
 ${\check{x}_{\rm{r}}}$ runs for office, and each citizen with an ideal point more “moderate” than
 ${\check{x}_{\rm{l}}}$ and
 ${\check{x}_{\rm{r}}}$ does not run. The equilibrium cutpoints are derived by comparing a citizen’s expected payoffs for entering and not entering, given that other individuals are using such cutpoints (see online supplementary material, henceforth OSM, for details). For the specification assumed here, if all other citizens j ≠ i are using cutpoint strategy
 $\left( {{{\check{x}}_{\rm{l}}},{{\check{x}}_{\rm{r}}}} \right)$, the optimal entry strategy of a citizen type x i is to enter if and only if
 $$\eqalignb{ {\left( {1 - p} \right)^{n - 1}}\left( {{{n - 1} \over n}} \right)\cr \times\left [ {b + E\left[ {v\left( {{x_i},d} \right)\left| {d \in \left\{ {{{\check{x}}_{\rm{l}}} + 1, \ldots ,{{\check{x}}_{\rm{r}}} - 1} \right\}} \right.} \right]} \right] \cr + \mathop\sum\limits_{m = 2}^n {\left( {\matrix{ {n - 1} \cr {m - 1} \cr} } \right)} {p^{m - 1}}{\left( {1 - p} \right)^{n - m}}\cr\times{1 \over m}\left[ {b + E\left[ {v\left. {\left( {{x_i},\gamma } \right)} \right|\gamma \,\, \notin\, \left\{ {{{\check{x}}_{\rm{l}}} + 1, \ldots ,{{\check{x}}_{\rm{r}}} - 1} \right\}} \right]} \right] \ge \,c\hbox, \cr}$$
where the left-hand side (LHS) gives the difference between the expected benefit from entering and expected benefit from not entering, excluding the cost of entry, which appears on the right-hand side (RHS). We use the notation  $m \,\,\equiv \, \mathop\sum\limits_{i = 1}^n {{e_i}}$ to denote the number of entrants and p to denote the ex-ante probability that a randomly selected citizen j ≠ i enters. If nobody enters, then the default policy d takes effect, where the expected loss from the absolute distance in citizen i’s ideal point and the common policy, or policy loss, is given by
 $$\eqalign{&E\left[ {v\left. {\left( {{x_i},d} \right)} \right|d \in \left\{ {{{\check{x}}_{\rm{l}}} + 1, \ldots ,{{\check{x}}_{\rm{r}}} - 1} \right\}} \right] \cr&= {1 \over {1 - p}}\mathop\sum\limits_{x = {{\check{x}}_{\rm{l}}} + 1}^{{{\check{x}}_r {- 1}}} {{{\left| {{x_i} - x} \right|} \over {100}}} \hbox,$$
and if at least one citizen j ≠ i enters, the respective expected policy loss is given by
 $$\eqalign{&E\left[ {v\left. {\left( {{x_i},\gamma } \right)} \right|\gamma \,\,\notin\,\, \left\{ {{{\check{x}}_{\rm{l}}} + 1, \ldots ,{{\check{x}}_{\rm{r}}} - 1} \right\}} \right] \cr&= {1 \over p}\left[ {\mathop\sum\limits_{x = 1}^{{{\check{x}}_{\rm{l}}}} {{{\left| {{x_i} - x} \right|} \over {100}}} + \mathop\sum\limits_{x = {{\check{x}}_{\rm{r}}}}^{100} {{{\left| {{x_i} - x} \right|} \over {100}}} } \right].$$
The LHS of (3) has a straightforward interpretation. The first term corresponds to the event that no citizen j ≠ i enters, which occurs with probability (1 − p)n−1. The intuition is that if only citizen i enters, then she can ensure leadership by entering and so receives b and avoids an expected loss (4) from someone else’s policy decision. Note that if i does not enter, these two payoffs accrue with probability 1/n and (n − 1)/n, respectively, due to the specification of the stochastic default policy, d. The second term on the LHS of (3) represents the event where at least one other citizen j enters. For each possible number of entrants m ≥ 2, including herself, citizen i both receives b and avoids a loss from policy with probability 1/m. The expected policy loss is different depending on whether the leader’s ideal point is in the same direction as i’s ideal point, which is captured by the two terms in brackets in (5). Finally, our experimental parameters yield interior equilibrium entry cutpoints, which is computed by setting  ${x_i} = {\check{x}_{\rm{l}}}$ and
 ${{x}_{\rm{r}}} = 100-{{x}_{\rm{l}}}$ and then solving (3) at equality.
Equilibrium with Parties
In elections where the entry stage is organized by ideological political parties, the two decision-making stages have the following differences. First, all citizens with an ideal point x ∈ {1,…, 50} ({51,…, 100}) automatically belong to the Left (Right) Party. If one or more citizens from a party choose to enter, then one of them becomes the party nominee in the election. For simplicity, we assume each candidate from the party is selected as the party’s nominee with equal probability. The party affiliation of each nominee, albeit not exact ideal point, is then revealed to all citizens. Furthermore, each citizen votes for a nominee, possibly herself. If only one party has a nominee, everyone must vote for her. If nobody enters, then the default policy d is activated. As in the case with no parties, the chosen leader’s ideal point is implemented as the policy outcome.
The PBE of the citizen candidate game with parties has the following structure. In the Voting stage, each nominee votes for herself and each non-nominee, entrant or not, votes for the nominee who yields her the highest expected payoff. This will be the nominee from their own party (whose ideal point is expected to be closer to the own taste), if there is one.Footnote 8 In the symmetric BNE equilibrium of the Entry stage, each citizen follows a cutpoint strategy as in (2). Analogous to expression (3), the optimal entry strategy of a citizen with ideal point x i in the Right Party is to enter if and only if (and similar for a citizen in the Left Party):
 $$\eqalign{ {\left( {1 - p} \right)^{n - 1}}\left( {{{n - 1} \over n}} \right)\cr \times \left[ {b + E\left[ {v\left. {\left( {{x_i},d} \right)} \right|d \in \left\{ {{{\check{x}}_{\rm{l}}} + 1, \ldots ,{{\check{x}}_{\rm{r}}} - 1} \right\}} \right]} \right] \cr + \mathop\sum\limits_{{m_{\rm{r}}} = 2}^n {\left( {\matrix{ {n - 1} \cr {{m_{\rm{r}}} - 1} \cr} } \right)} {\left( {{p \over 2}} \right)^{{m_{\rm{r}}} - 1}}{\left( {1 - p} \right)^{n - {m_{\rm{r}}}}} \cr \times {1 \over {{m_{\rm{r}}}}}\left[ {b + E\left[ {v\left( {{x_i},\gamma } \right)\left| {\gamma \in \left\{ {{{\check{x}}_{\rm{r}}}, \ldots ,100} \right\}} \right.} \right]} \right] \cr + \mathop\sum\limits_{{m_{\rm{l}}} = 1}^{n - 1} {\mathop\sum\limits_{k = 0}^{n - {m_{\rm{l}}} - 1} {\left( {\matrix{ {n - 1} \cr {{m_{\rm{l}}}} \cr} } \right)} } {\left( {{p \over 2}} \right)^{{m_{\rm{l}}}}}{\left( {1 - p} \right)^{n - {m_{\rm{l}}} - 1}} \cr \times \left( {\matrix{ {n - {m_{\rm{l}}} - 1} \cr k \cr} } \right){\left( {{1 \over 2}} \right)^{n - {m_{\rm{l}}} - 1}} \cr\times {\rho _{\rm{r}}}\left[ {b + E\left[ {v\left( {{x_i},\gamma } \right)\left| {\gamma \in \left\{ {1, \ldots ,{{\check{x}}_{\rm{l}}}} \right\}} \right.} \right]} \right] \cr + \mathop\sum\limits_{{m_{\rm{r}}} = 2}^{n - 1} {\mathop\sum\limits_{{m_{\rm{l}}} = 1}^{n - {m_{\rm{r}}}} {\mathop\sum\limits_{k = 0}^{n - m} {\left( {\matrix{ {n - 1} \cr {{m_{\rm{r}}} - 1} \cr} } \right)} } } \left( {\matrix{ {n - {m_{\rm{r}}}} \cr {{m_{\rm{l}}}} \cr} } \right)\cr\times {\left( {{p \over 2}} \right)^{{m_{\rm{r}}} - 1}} {\left( {{p \over 2}} \right)^{{m_{\rm{l}}}}}{\left( {1 - p} \right)^{n - m}}\left( {\matrix{ {n - m} \cr k \cr} } \right){\left( {{1 \over 2}} \right)^{n - m}} \cr \times {{{\rho _{\rm{r}}}} \over {{m_{\rm{r}}}}}\left[ {b + E\left[ {v\left( {{x_i},\gamma } \right)\left| {\gamma \in \left\{ {{{\check{x}}_{\rm{r}}}, \ldots ,100} \right\}} \right.} \right]} \right] \,\ge\, c\hbox,\, \cr}$$
where k denotes the number of non-entrants with ideal points strictly within the equilibrium cutpoint pair who vote for the Right Party nominee, where each non-entrant is expected to support one of the nominees with probability one-half for each and vote accordingly. The ex-ante probability of a random citizen j ≠ i entering from either direction is denoted by p, and the number of entrants from the Left and Right Party is denoted by m l and m r, respectively, with m ≡ m l + m r. Note that the probability that a random citizen enters as Left Party candidate (or Right Party candidate) is p/2 since the distribution of ideal points is uniform. The win probability of the Right Party is denoted by  ${\rho _{\rm{r}}} = H\left[ {{{{m_{\rm{r}}} + k} \over n} - {1 \over 2}} \right]$ with
 $H\left[z \right] = \left\{ {\matrix{ 0 & {{\rm{if}}} & {z \lt 0} \cr {1/2} & {{\rm{if}}} & {z = 0} \cr 1 & {{\rm{if}}} & {z > 0} \cr } } \right.$, and the expected policy losses in the respective terms are given by
 $$E\left[ {v\left( {{x_i},d} \right)\left| {d \in } \right.\left\{ {{{\check{x}}_{\rm{l}}} + 1, \ldots ,{{\check{x}}_{\rm{r}}} - 1} \right\}} \right] = {1 \over {1 - p}}\mathop\sum\limits_{x = {{\check{x}}_{\rm{l}}} + 1}^{{{\check{x}}_{\rm{r}}} - 1} {{{\left| {{x_i} - x} \right|} \over {100}}} ;$$
 $$E\left[ {v\left( {{x_i},\gamma } \right)\left| {\gamma \in \left\{ {1, \ldots ,{{\check{x}}_{\rm{l}}}} \right\}} \right.} \right] = {1 \over {{p / 2}}}\mathop\sum\limits_{x = 1}^{{{\check{x}}_{\rm{l}}}} {{{\left| {{x_i} - x} \right|} \over {100}}} ;$$
 $$E\left[ {v\left( {{x_i},\gamma } \right)\left| {\gamma \in \left\{ {{{\check{x}}_{\rm{r}}}, \ldots ,100} \right\}} \right.} \right] = {1 \over {{p / 2}}}\mathop\sum\limits_{x = {{\check{x}}_{\rm{r}}}}^{100} {{{\left| {{x_i} - x} \right|} \over {100}}} .$$
The first term on the LHS of (6) is the same as in (3) and represents the case where no citizen j ≠ i enters. The second term gives the cases where at least one j also enters from the Right Party, but no one enters from the Left Party. In these events, citizen i anticipates gains b/m r and, from policy loss avoidance,  ${1 / {{m_{\rm{r}}}}} \times E\left[ {v\left( {{x_i},\gamma } \right)\left| {\gamma \in \left\{ {{{\check{x}}_{\rm{r}}}, \ldots ,100} \right\}} \right.} \right]$ because one of the m r Right Party entrants is randomly appointed the nominee of this party. The third term on LHS (6) gives the cases where at least one citizen j ≠ i enters from the Left Party, but only citizen i enters from the Right Party, so m r = 1 and she secures the Right Party nomination. Due to symmetry, each of the n − m l − 1 non-entrants with ideal points strictly within the equilibrium cutpoint pair prefers the Left or Right Party nominee with probability one-half for each, and votes accordingly (as accounted for by the index k of the summation). Since citizen i is in the Right Party, her expected net gains from entry are ρ rb and
 ${\rho _{\rm{r}}}E\left[ {v\left( {{x_i},\gamma } \right)\left| {\gamma \in \left\{ {1, \ldots ,{{\check{x}}_{\rm{l}}}} \right\}} \right.} \right]$ (i.e., the policy loss avoided if the opponent nominee runs unopposed). Note that ρ r declines with each Left Party entrant, who is expected to vote for this party’s nominee. The fourth term of the LHS of (6) represents the cases where at least one citizen j ≠ i enters from each direction, which yields a mix of the second and third terms. Finally, our experimental parameters yield interior equilibrium entry cutpoints characterized by solutions to (6), at equality.
EXPERIMENTAL DESIGN
The experiment was conducted at the Experimental Social Science Laboratory of Florida State University.Footnote 9 A total of 148 students participated in eight sessions of 16 or 20 participants each, with each session lasting about 1.5 hours. Earnings were expressed in points and exchanged for cash for $1 per 250 points at the end of a session. Participants earned on average $22.91, including $7 for showing up.
In a 2 × 2 × 2 treatment design, we varied the “entry cost” (c = 10 and 20 points) within subjects and “group size” (n = 4 and 10) and “party mode” (θ = No Party and Party) between subjects. Each session had two parts of 30 decision periods each, where the entry cost changed from one part to the next and the cost order changed across sessions. Participants knew that there are two parts, but were instructed about the second part only after completing the first one. In all treatments, at the start of each period the subject pool was randomly divided into separate four- or ten-person groups that did not interact with one another in this period, and each participant received a new ideal point and, entirely independently, a new letter ID label. They were informed that ideal points are iid random draws from a uniform distribution over the integers {1, 2,…, 100} and private information (i.e., not shown to others), and that letter IDs are iid draws from a uniform distribution over the whole alphabet and revealed to everyone in the group (albeit the participant behind a letter ID remained anonymous). In a given group and period, different individuals could have the same ideal point but never the same letter ID.
Each period consisted of two consecutive stages where the participants independently and simultaneously made their decisions without communication. In the Entry stage, each group member decided on whether to enter the political competition and pay c points, or not enter and bear no cost. In the Voting stage, in No Party the letter ID, but not ideal point, of each independent candidate was displayed on the computer screen with a button labeled with her or his letter ID (a candidate’s own label was highlighted in red). In Party, one of the entrants with an ideal point x i ∈ {1,…, 50} ({51,…, 100}) was randomly selected as the Left (Right) Party nominee, with equal probability for each, and a lone entrant was the nominee outright. If nobody entered from a party, then the party had no nominee. Each nominee was displayed on the computer screen with a button labeled with her or his letter ID (a nominee’s own label was highlighted in red). All voters were informed whether a nominee’s ideal point is from the left or right half of the policy space, with the exact candidate location remaining undisclosed.Footnote 10
Next, each participant voted by clicking one of the candidate or nominee buttons and could not abstain.Footnote 11 Candidates and nominees were not forced to vote for themselves. The candidate or nominee with the most votes was appointed the leader and received a bonus of b = 5 points, with ties broken randomly. If nobody entered, then one participant was randomly and equiprobably appointed the leader (and received b = 5 points but did not pay c).Footnote 12 Either way, the leader’s ideal point was implemented as the policy outcome. After the election, everyone was informed about the number of votes for each candidate or nominee, the leader’s letter ID, the policy outcome, the own period earnings, and reminded whether she or he entered and was a leader (and thus paid c and received b).Footnote 13 In addition, the bottom of the screen contained a history panel where at any time participants could view this information from all previous periods. Participants were paid for all 2 × 30 = 60 periods. One unpaid practice round was conducted to familiarize them with the user interface.Footnote 14
Table 1 summarizes our experimental design (first six columns) and quantitative BNE predictions in the entry game of the relevant observable variables (last five columns; denoted by an asterisk and subscript e for expected values). Each treatment (n, c, θ) has a unique symmetric cutpoint pair  $\left( {\check{x}_{\rm{l}}^ * ,\check{x}_{\rm{r}}^ * } \right)$ that determines the individual entry probability, p* (and thus the expected number of entrants,
 $m_e^ *$), for which we also compute the ex-ante expected individual payoff,
 $\pi _e^ * = K - v_e^ * - {p^ * }c + {b / n},$ where K = 100 and
 $v_e^ *$ denotes the expected policy loss.
Experimental Design and Symmetric BNE Predictions in the Entry Game

Note: All sessions had two parts, each with a different entry cost, c, for 30 periods. The electorate size, n, and party mode were varied between participants.  ${p^ * },\pi _e^ * ,v_e^ *$, and p*c denote an individual’s BNE entry probability and expectations of payoff, policy loss, and entry expenditures, respectively. Each treatment used a leader bonus of b = 5 points and a uniform distribution of ideal points over the integers {1, 2,…,100}. Both Party treatments with c = 10 points have an additional BNE with two cutpoint pairs (see footnote 18).
HYPOTHESES
The first hypothesis captures the most important property of the BNE in the Entry game:
H1: Political Polarization. In every treatment, the entry rates are a weakly increasing function of the absolute distance between ideal points and the median of the policy space.
The next four hypotheses specify the primary comparative statics derived based on BNE, from directly comparable pairs of treatments that differ only with respect to one variable (as compared to secondary qualitative predictions where treatments differ in two or three variables).
H2: Party Effect. Holding the entry cost and group size constant, expected equilibrium entry is lower with party-mediated elections than without parties. This implies four specific hypotheses in terms of pairwise comparisons for p(n, c, θ) [the effect is the same for m e(n, c, θ)]:
p*(n, c, No Party) > p*(n, c, Party) for all four combinations of n and c.
H3: Size Effect. Holding the entry cost and party mode constant, in equilibrium, the probability of entry p is decreasing in n. This gives four specific hypotheses in the form of pairwise comparisons for p:
p*(4, c, θ) > p*(10, c, θ) for all four combinations of c and θ.
H4: Cost Effect. Holding the group size and party mode constant, expected equilibrium entry is decreasing in c, which implies four hypotheses in terms of pairwise comparisons for p (the effect is the same for m e):
p*(n, 10, θ) > p*(n, 20, θ) for all four combinations of n and θ.
H5: Welfare Effect. The hypotheses for equilibrium expected welfare, measured by expected individual payoffs, πe, have the same signs as for p in H3 (size effect) and H4 (cost effect), but the opposite signs in H2 (party effect).
(a) Party:
 $\pi _e^ * \left( {n\hbox,\,c\hbox,\,{\rm{No}}\;{\rm{Party}}} \right) \lt \pi _e^*\left( {n\hbox,\,c\hbox,\,{\rm{Party}}} \right)$ for all four combinations of n and c;
(b) Group size:
$\pi _e^ * \left( {4\hbox,\,c\hbox,\,\theta } \right) > \pi _e^ * \left( {10\hbox,\,c\hbox,\,\theta } \right)$ for all four combinations of c and θ;(c) Entry cost:
$\pi _e^ * \left( {n\hbox,\,10\hbox,\,\theta } \right) > \pi _e^ * \left( {n\hbox,\,20\hbox,\,\theta } \right)$ for all four combinations of n and θ.


As an even more stringent test of the equilibrium model, the BNE of the entry game also generates predictions about the complete order of qualitative predictions across all treatments, varying all the treatment variables simultaneously.
H6: Entry Rate Ordering. In equilibrium, the ordering of p across all treatments is
 $$\eqalign{ & {p^ * }\left( {4,10,{\rm{No}}\;{\rm{Party}}} \right) > {p^ * }\left( {4,10,{\rm{Party}}} \right) \cr &> {p^ * }\left( {10,10,{\rm{No}}\;{\rm{Party}}} \right) \cr & > {p^ * }\left( {4,20,{\rm{No}}\;{\rm{Party}}} \right) > {p^ * }\left( {4,20,{\rm{Party}}} \right) \cr &> {p^ * }\left( {10,10,{\rm{Party}}} \right) > {p^ * }\left( {10,20,{\rm{No}}\;{\rm{Party}}} \right) \cr & > {p^ * }\left( {10,20,{\rm{Party}}} \right); \cr}$$
H7: Welfare Ordering. In equilibrium, the ordering of πe across all treatments is
 $$\eqalign{ & \pi _e^ * \left( {4,10,{\rm{Party}}} \right) > \pi _e^ * \left( {4,10,{\rm{No}}\;{\rm{Party}}} \right) > \pi _e^ * \left( {4,20,{\rm{Party}}} \right) \cr &> \pi _e^ * \left( {4,20,{\rm{No}}\;{\rm{Party}}} \right) > \pi _e^ * \left( {10,10,{\rm{Party}}} \right) \cr&> \pi _e^ * \left( {10,20,{\rm{Party}}} \right) > \pi _e^ * \left( {10,10,{\rm{No}}\;{\rm{Party}}} \right) \cr & > \pi _e^ * \left( {10,20,{\rm{No}}\;{\rm{Party}}} \right). \cr}$$
EXPERIMENTAL RESULTS: AN EXAMINATION OF H1–H7
This section presents and analyzes the aggregate data as it relates specifically to the seven hypotheses listed above. In the next section, we take a deeper look at the individual level data.
The Polarization Hypothesis (H1)
The polarization hypothesis specifies that more extreme citizens are (weakly) more likely to enter as candidates. This is implied by the BNE of the entry game for all treatments in the experiment. An exact comparison of the data to the theory clearly rejects BNE, which makes the sharp prediction that entry rates should be either zero or one depending on whether a citizen’s ideal point is sufficiently extreme. Of course the data are not discontinuous like this. Therefore, we fit a logit regression model of the probability of entry as a function of the absolute distance of an ideal point from the median. Since this is a strategic game rather than a simple individual choice so that if the players’ entry functions are logit functions rather than strict cutpoint pairs, this in turn changes all of the players’ responses in the game. Thus, we analyze the data using logit quantal response equilibrium of the game, or logit QRE (Goeree, Holt, and Palfrey Reference Goeree, Holt and Palfrey2016; McKelvey and Palfrey Reference McKelvey and Palfrey1995, Reference McKelvey and Palfrey1998).
QRE is a statistical generalization of NE that allows for decision-making errors that are systematic in the sense that more lucrative decisions are made more often than less lucrative decisions. In the logit specification of QRE, the parameter λ ≥ 0 represents the slope of the logit response function, with lower values indicating a flatter response (“higher error”) and higher values indicate a steeper response. If λ = 0, decisions are purely random so each citizen type x ∈ {1,…,100} enters with probability one-half. The rationality level strictly rises in λ until λ ≈ ∞, where everyone is virtually fully rational and follows the BNE cutpoint strategy. In particular, each citizen type x enters with probability q(x) ∈ (0, 1) strictly in between zero and one, which depends smoothly on the ideal point and is no longer a cutpoint strategy that dictates a “zero or one” binary choice for all x. This leads to a set of equilibrium conditions that are somewhat different from (2) to (9) (see OSM). The QRE entry probabilities are computed by simultaneously solving one-hundred different conditions, one for each possible x.Footnote 15 Given these QRE entry probabilities as a function of λ, we estimate λ by maximum likelihood. To avoid overfitting, the estimated parameter is constrained to be equal across all treatments.
Table 2 shows for each treatment the observed entry rate, p obs, and the respective BNE and QRE entry rates (columns 4–6), where QRE entry rates are evaluated at the estimated value of λ. The theoretical predictions reported in the table are exact, in the sense that they are based on the actual draws of ideal points realized in the experiment (i.e., empirical distribution), and hence are indicated by subscript emp, while still assuming that citizens respond to the theoretical uniform distribution.Footnote 16 Importantly, the complete order of qualitative predictions across all treatments is preserved when changing to empirical BNE and QRE. The observed rates of entry are averaged over all periods and QRE predictions use  $\hat{\lambda } = 0.083$, the maximum likelihood estimate for all periods and treatments combined. Furthermore, the scatter plot in Figure 1 depicts for each treatment the BNE entry rate
 $p_{{\rm{emp}}}^ *$ on the horizontal axis against the average observed rate p obs (markers) and QRE rate
 $p_{{\rm{emp}}}^{\hat{\lambda }}$ (markers linked by dotted line) on the vertical axis.
Entry–Predictions and Data

Note:  ${p^{{\rm{obs}}}},p_{{\rm{emp}}}^ *$, and
 $p_{{\rm{emp}}}^{\hat{\lambda }}$ denote the individual observed, BNE, and QRE entry rates (empirical means that the realized instead of theoretical distribution of voter ideal points were used). BNE is indicated by an asterisk and QRE by
 $\hat{\lambda }$, the maximum likelihood estimate of the degree of error. Standard errors of p obs are all in the range [0.013, 0.016].
Entry Rates–Predictions and Data
Note: The data markers and empirical QRE  $\bf\left( {\hat{\lambda } = 0.083} \right)$ entry rates use all periods.

An interesting pattern in the data that is clearly seen in Figure 1 is that relative to BNE we find over-entry for the treatments where p* < 1/2 and (weak) under-entry for the treatments where p* > 1/2. This is not just a coincidence, but is a general property of regular QRE in these games. The independent random noise in QRE flattens out the treatment response in entry rates compared with BNE, by pulling the rates away from BNE in the direction of p = 1/2 (see Goeree and Holt Reference Goeree and Holt2005; Goeree, Holt, and Palfrey Reference Goeree, Holt and Palfrey2016).
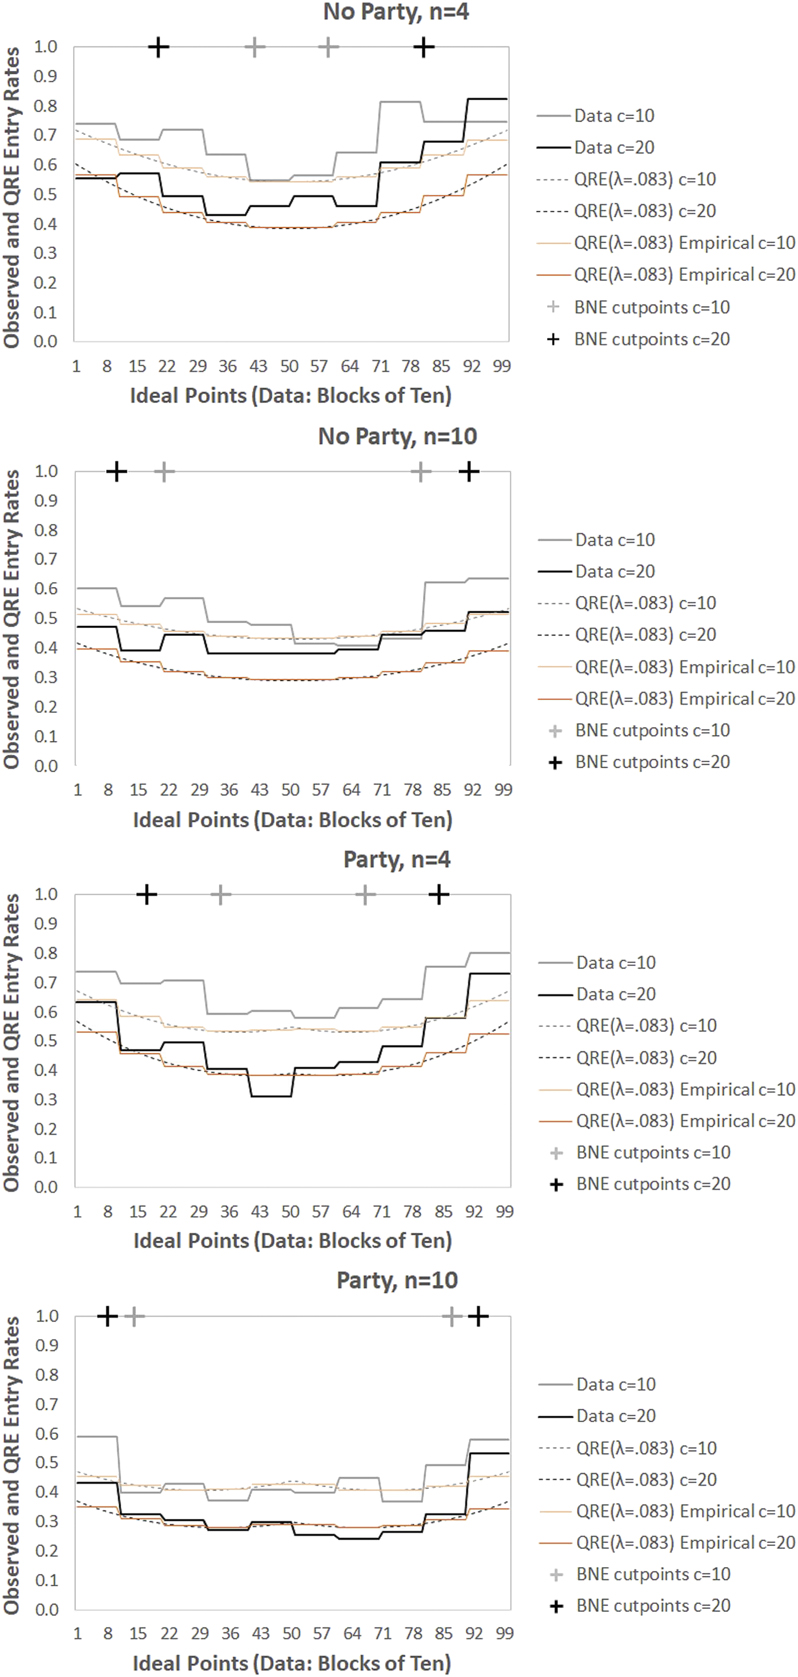
Figure 2 displays for each treatment the observed and empirical QRE entry rates per block of ten ideal points (solid lines), the BNE cutpoint pair (cross markers at the top), and the theoretical QRE entry rate function (dashed lines) at the estimated value of  $\hat{\lambda }$ (see also Figure III.1 in the OSM). With pure noise, λ = 0, the dashed line would be a horizontal through p = 0.5 and in BNE, λ ≈ ∞, it would be a step function with entry rates equal to one for all ideal points at or more extreme than the two cutpoints (cross markers) and equal to zero for all ideal points strictly within both cutpoints.Footnote 17 In all treatments, the entry curves are U-shaped, which is a general property of QRE in these games, rather than the sharp discontinuous BNE cutpoint pairs.Footnote 18
Predicted and Actual Entry Rates per Ideal Point (Data Averaged in Blocks of Ten)

The statistical significance of the U-shape of entry rates is supported by logit regressions (clustered by individuals; see Table 3) of entry decisions on extremeness of a citizen’s ideal point, measured by |x i,t − x median|/49, where x median ∈ {50, 51} depending on which is closer to x i,t, and i denotes the individual and t denotes the period (upper two regressions). Thus, we normalize the coefficient by dividing by the maximum distance of 49 = 50 − 1 or 100 − 51. The first and third regressions also control for the three treatment variables and all three regressions include a measure of experience (first fifteen periods versus last fifteen periods in each part). The coefficient of |x i,t − x median|/49 is positive and highly significant so the more extreme the own ideal point, the more likely a participant is to run for office. This provides strong support for H1. We next turn to the hypotheses about specific treatment effects.Footnote 19
Entry–Random-Effects Logit Regressions (All Data)

Note: * (**; ***) indidcates a one-tailed 5% (1%; 0.1%) significance level. The data are clustered at the individual level.
Treatment Effects on Entry Rates and Welfare (H2–H5)
Entry Rates (p)
As can be seen in Table 2 and Figure 1, all twelve predicted primary treatment effects on entry rates find support in the data. This is most clearly visible in the figure because the (empirical) BNE entry rates are depicted in ascending order on the horizontal axis and, with one exception in the observations, the respective (empirical) QRE and observed entry rates are monotonically increasing in this order as well. For the party effect (H2), holding constant the group size and entry cost, the observed entry rates are always greater in No Party than Party. For the size effect (H3), holding constant the entry cost and party mode, they are always greater with n = 4 than 10. And, for the cost effect (H4), holding constant the group size and party mode, they are always greater with c = 10 than 20 points. The results of the logit regression reported in Table 3 support these treatment effects: the coefficients of Party, Group size, and Entry cost are all negative and statistically significant. While the regression uses all the data, the same results occur when only the respective sessions of primary treatment comparisons are employed, except for the Party dummy with n = 4 and c = 10 where the coefficient is insignificant. Overall, our experiment provides strong evidence in favor of H2 to H4 with respect to entry decisions. Finally, whether entry decisions are made in the first or second 15 periods in a treatment makes no difference (i.e., the coefficient of Block of 15 periods is small in magnitude and statistically insignificant).Footnote 20
Welfare (πe)
We next turn to H5, which addresses the comparative statics predictions of aggregate welfare, as measured by average payoffs. Table 4 gives per treatment observed and predicted (using empirical ideal point distributions) average individual payoffs. Note that all primary qualitative predictions of payoffs are identical for BNE and QRE  $\left( {\hat{\lambda }} \right)$, independent of whether they are theoretical or empirical predictions (see Table III.2 in the OSM). For the welfare effect (H5), all twelve primary qualitative predictions find support in the data. In terms of quantitative comparisons with the equilibrium predictions, in all treatments the actual average payoff
 ${\bar{\pi }^{{\rm{obs}}}}$ is greater than in BNE and weakly smaller than in QRE
 $\left( {\hat{\lambda }} \right)$, but the data and QRE predictions tend to be much closer to one another.Footnote 21
Average Individual Payoffs–Predictions and Data

Note: n and c denote the electorate size and entry cost, respectively.  ${\bar{\pi }^{{\rm{obs}}}}$,
 $\bar{\pi }_{{\rm{emp}}}^ *$, and
 $\bar{\pi }_{{\rm{emp}}}^{\hat{\lambda }}$ denote the individual observed, BNE, and QRE average payoffs (empirical means that the realized instead of theoretical distribution of voter ideal points were used). Standard errors for
 ${\bar{\pi }^{{\rm{obs}}}}$ are in the range [0.71, 0.82].
Next, Table 5 gives the results of OLS regressions, clustered by individuals and pooling all data, with the individual payoff in period t as the dependent variable and the same five independent variables as in Table 3. As can be seen, all of the predicted effects are highly significant and large in magnitude. And, as in the logit regression for entry rates, there is no evidence of learning.Footnote 22
Payoffs–Random-Effects OLS Regressions (All Data)

Note: * (**; ***) indicates a one-tailed 5% (1%; 0.1%) significance level. The data are clustered at the individual level.
The reason for the welfare gains from party-organized elections is that, compared to No Party, majority candidates in Party win more often on average since if there are two nominees, each citizen votes for the one located in the same direction as herself (below we show that participants mostly vote in this way). That is, party labels provide valuable information to all the citizens so the outcome more closely reflects the true distribution of preferences. Figure 3 indicates that for both n = 4 and 10 (left and right panel, respectively) the majority wins indeed substantially more often in Party than No Party in situations where it might also lose.Footnote 23 The only exception are majorities of nine participants, which always provided the leader in both party modes.
Actual Win Proportion and Vote Coordination Advantage of Majority Parties

To summarize these welfare results, introducing party information produces three competing effects and an overall effect:
(i) A negative effect since those who run for office tend to be even more extreme (see, e.g., the two lower panels in Figures III.3 and III.4 in the OSM).
(ii) A positive effect since on average there are fewer entrants and thus lower entry expenditures (Tables 2 and 3).
(iii) A positive effect because of vote coordination on parties, which works in favor of the majority and thus decreases the average policy losses (e.g., Figure 3 and, with one exception, Table III.4 in the OSM).
(iv) The overall effect is an increase in welfare, which is consistent with the BNE and QRE models (Tables 4 and 5).
Complete Ordering of Entry Rates and Welfare across Treatments (H6 and H7)
As noted earlier, because BNE produces quantitative predictions about entry and welfare for any parameter configuration, it also generates hypotheses about comparisons across treatments that differ in two or three of the treatment variables. In fact, as stated in H6 and H7, BNE generates a complete strict order over the eight treatments with respect to both entry rates and welfare.
For entry rates, this is most clearly seen in Figure 1 by the left–right ordering of the labeled data points for each treatment: with only one exception, the data markers are increasing in the BNE entry rate. In fact, out of all 28 possible qualitative comparisons, only one has an unpredicted sign, namely p obs(4, 20, No Party) > p obs(10, 10, No Party), for which the predictions  $p_{{\rm{emp}}}^ * = 0.417$ and 0.426 are very close to one another. This provides strong evidence in favor of H6. It is also worth mentioning that while the BNE and QRE
 $\left( {\hat{\lambda }} \right)$ models generate the same treatment ordering of entry rates, except for (Party, n = 4, c = 10) the latter predictions are always nearer to the data. Interestingly, relative to BNE we find over-entry if p* < 0.5 and (weak) under-entry if p* > 0.5, a pattern that was already reported in various other binary choices, entry experiments and explained using QRE (Goeree and Holt Reference Goeree and Holt2005). As noted before, the logit QRE model also generates this entry pattern. However, it is also the case that the observed entry rates are shifted up relative to the QRE fitted estimates.Footnote 24 Finally, the complete order of expected welfare, as measured by average individual payoffs given in Table 4, is also mostly consistent with the BNE and QRE
 $\left( {\hat{\lambda }} \right)$ predictions (note that the two models predict somewhat different orders). Out of 28 possible qualitative comparisons, 24 and 25 are correct, respectively. This includes all twelve of the one-variable treatment comparisons discussed in the last section, and twelve and thirteen out of sixteen of the comparisons between treatments that differ in more than one dimension. Thus, the data provide some support for H7, but weaker than the solid support that we find for H6.
EXPERIMENTAL RESULTS: INDIVIDUAL BEHAVIOR
Voting Behavior
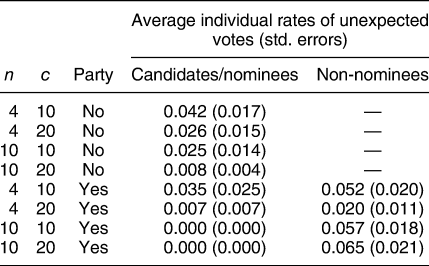
The predicted voting behavior in BNE is quite simple: (1) each candidate in No Party and each nominee in Party votes for herself; (2) with two nominees each non-nominee votes for the one whose ideal point is from her own subset of ideal points, left or right. We label voting decisions that are inconsistent with these predictions as unexpected.Footnote 25 Table 6 shows the observed average individual rate of unexpected voting for each treatment. The rate of each participant is equally weighted and computed by dividing her number of unexpected votes by the number of cases she or he is a candidate respectively nominee or non-nominee. As can be seen, candidates and nominees do indeed mostly vote for themselves. Specifically, in No Party (Party) unexpected votes by candidates (nominees) are observed only 0.8 to 4.2 (0 to 3.5) percent of the time. Similarly, non-nominees in Party rarely cast unexpected votes (only 2.0 to 6.5 percent of the time). Thus, overall voting behavior is very close to BNE.
Observed Unexpected Votes

Note: n and c denote the electorate size and entry cost, respectively. Elections with zero or one entrant are excluded. Non-nominee’s rates are for the Party treatments only. Standard errors are computed using the differences in each individual’s rate and the average individual rate.
We also find that only very few participants voted unexpectedly. Specifically, per individual, 77.8 and 82.5 percent of the independent candidates in four- and ten-person groups always voted as predicted, and these numbers are 87.5 and 100 percent for nominees and 71.9 and 57.5 percent for non-nominees, respectively. And of the participants who cast at least one anomalous vote, many did so just once or little more than this. Hence, the few deviations from equilibrium voting are due to the behavior of only a handful of the participants. For example, the three largest individual counts of unexpected votes are seventeen by a candidate in (No Party, n = 4) and thirteen and eighteen by two non-nominees in (Party, n = 10), where the latter of them never entered. More details and analysis of how unexpected voting depends on the ideal point are in the OSM.
Individual Entry Behavior
Here we present individual level data of entry behavior. Figure 4 depicts cumulative frequency distributions of actual average individual entry rates for (No Party, c = 10, n = 4) and (Party, c = 20, n = 10), which have with  $p_{{\rm{emp}}}^ * = 0.844$ and 0.152 the most extreme BNE entry probabilities. The distributions of the six other treatments tend to fall within these two distributions.Footnote 26 Clearly, there is marked heterogeneity in entry rates among participants. Furthermore, the 50 percent horizontal line intersects the two distributions in the expected order, but more to the left and right relative to
 $p_{{\rm{emp}}}^ * = 0.844$ and 0.152, respectively. This is consistent with QRE, which pulls the entry rates away from BNE toward 1/2.
Cumulative Distribution of Individual Entry Rates (Treatments With the Lowest and Highest BNE Rates)
Note: The lowest and highest BNE entry rates are  $p_{{\rm{emp}}}^* = 0.152$ and 0.844, respectively.

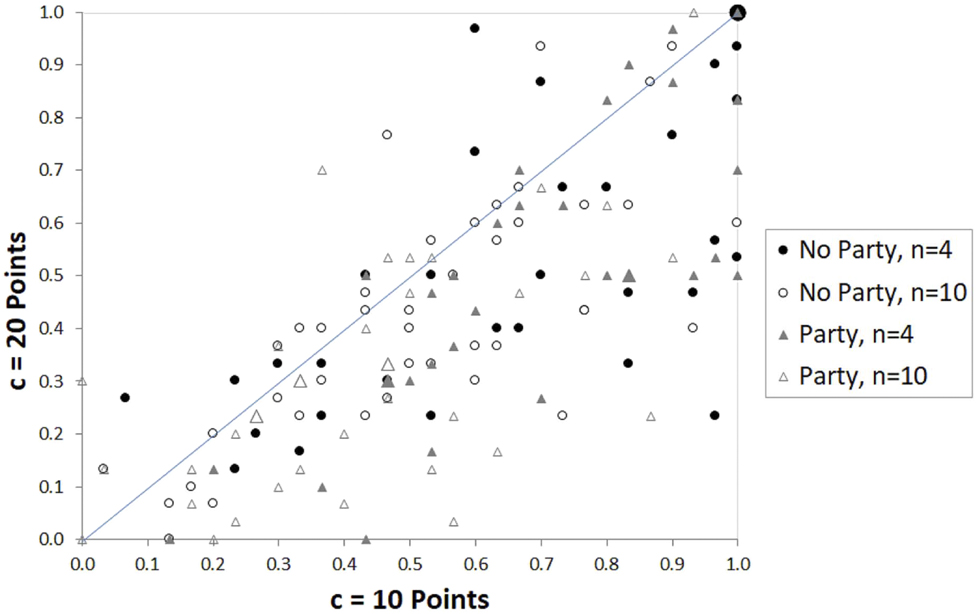
The scatter plot in Figure 5 shows, for each participant, the average entry rate with c = 10 and 20 points on the horizontal and vertical axis, respectively. Each marker represents one individual, where different symbols indicate different combinations of the party mode and group size (a few markers are somewhat magnified in proportion to the number of individuals at that same coordinate). As expected, independent of party mode and group size, most individuals enter more often when it costs less (i.e., have markers below the diagonal; one-tailed Wilcoxon signed ranks tests, p < 0.001 for each party mode and group size combination). Specifically, only 28 out of all 148 participants entered more often with a larger cost, and most of them are found close to the diagonal. Also, fourteen participants have the same entry rates with both costs (i.e., with markers on the diagonal), of whom one never entered and six always entered.
Entry Cost Effect
Note: Each participant's average entry rate with c = 10 and 20 points is shown on the horizontal and vertical axis, respectively. Each marker represents one participant, where a few markers are somewhat magnified in proportion to the number of individuals at that coordinate.

Next, we explore the extent to which observed entry decisions are consistent with cutpoint strategies, which are generally optimal best responses in this game. Specifically, for each participant i and treatment h, we estimate a cutpoint pair as follows, assuming that individuals use such a decision rule. For each participant and treatment, we have t = 30 periods or observational pairs of an ideal point and entry decision, (x i,t, e i,t)h. Fixing a cutpoint pair  ${\left( {{{\check{x}}_{\rm{l}}},{{\check{x}}_{\rm{r}}}} \right)_{i,h}}$, with
 $1 \le {\check{x}_{\rm{l}}} \le 50$ and
 ${\check{x}_{\rm{r}}} = 101 - {\check{x}_{\rm{l}}}$ due to symmetry, observation t in treatment h is marked consistent with this cutpoint pair if
 $$\left( {\rm{i}} \right)\;{\check{x}_{{\rm{l}},i}} \lt {x_{i,t}} \lt {\check{x}_{{\rm{r}},i}}\;{\rm{and}}\;{e_{i,t}} = 0\hbox,$$
or
 $$\left( {{\rm{ii}}} \right)\;{x_{i,t}} \le {\check{x}_{l,i}} \vee {\check{x}_{{\rm{r}},i}} \le {x_{i,t}}\;{\rm{and}}\;{e_{i,t}} = 1\hbox,$$
and marked as error otherwise.Footnote 27 And, as an estimator of participant i’s cutpoint pair we choose the one that minimizes the total number of errors, and if there are more such pairs we take the average of them. Using this procedure, we compute the distribution of individual classification error rates and cumulative frequency distributions of estimated individual cutpoint pairs.
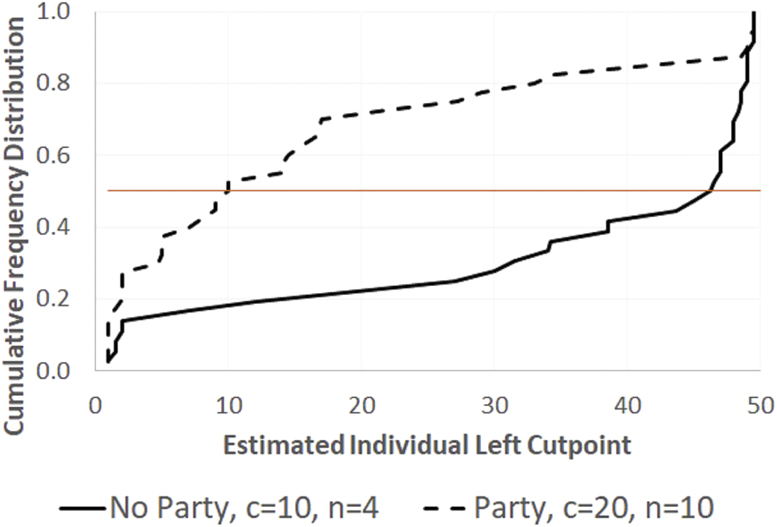
Figure 6 depicts the overall distribution of individual error rates, which are pooled for both entry costs. For about 25 (50; 75) percent of the participants, the error rate is ≤ 0.1 (0.2; 0.3), and only three percent have error rates of 0.4 or higher but none reaches the 0.5. Figure 7 shows the cumulative distributions of estimated individual cutpoint pairs for (No Party, c = 10, n = 4) and (Party, c = 20, n = 10), which have the most moderate and most extreme BNE cutpoint pairs of [42, 59] and [8, 93], respectively. Due to symmetry, we only show the left cutpoints, superimposing the data from both directions.Footnote 28 There is marked heterogeneity among the estimated individual cutpoint pairs. Finally, the 50 percent horizontal line and two distributions intersect in the expected order, and close to the eight and somewhat closer to the median than the 42 predicted, respectively.
Distribution of Classification Error Rates
Note: Individual error rates are pooled for both entry costs.

Cumulative Distributions of Individual Cutpoint Pairs (Treatments With the Most Moderate and Most Extreme BNE Cutpoints)
Note: Due to symmetry, we only present the left cutpoints, superimposing the data from both directions. The most moderate and most extreme BNE left cutpoints are 42 and 8, respectively.

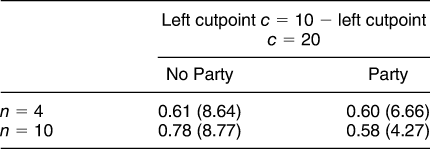
Table 7 gives the fraction of average individual positive differences in the estimated “left cutpoint with c = 10 points minus left cutpoint with c = 20 points.” The fraction ranges from 0.58 to 0.78, compared to one in BNE, and average differences range from 4.27 to 8.64 (in brackets).
Fraction (Average) of Positive Individual Cutpoint Differences

Note: Party with n = 10 has two individuals with zero difference, and each of the other three combinations of the party mode and group size has one individual with zero difference.
Overall, participants do not follow sharp cutpoint strategies. While this is inconsistent with optimizing behavior and with BNE, it is very much in line with the behavioral theory behind regular QRE. Participants in this experiment do not always optimize, but generally choose better entry actions more often than worse ones. This is also very much in line with results from cutpoint analysis in binary choice turnout games (Levine and Palfrey Reference Levine and Palfrey2007), where the vote/abstain choice is similar in nature to enter/not enter.
CONCLUSIONS
This article reports a laboratory study of a citizen–candidate entry game with incomplete information about the ideal points of citizens and candidates. Ideal points are privately observed iid random draws from a uniform distribution over the set of feasible common policies. Without ideological political parties, citizens have no extra information about the ideal points of independent candidates at the time of voting. By contrast, with parties they learn whether a party nominee’s ideal point belongs to the left or right half of the common policy set, but not her exact ideal point. The study compares both party modes in four- or ten-person groups and with two different entry costs. In the entry game, symmetric BNE makes sharp and mostly unique predictions of cutpoint pairs. That is, in equilibrium each citizen with an ideal point at or more extreme than a left or right cutpoint runs for office, while everyone with an ideal point strictly in between the two cutpoints does not run. Thus, the model predicts political polarization in the sense that the ideal points of politicians are more extreme than those in the general polity. Finally, the clear distributional BNE entry predictions, from which we also derive implications about welfare, have the advantage of being straightforward to test in the laboratory.
The main experimental results can be summarized as follows. First, all primary comparative statics predictions of entry rates and economic welfare are supported by the data. Most importantly, inefficient political polarization arises in all treatments. Second, participants appear to follow cutpoint strategies with some error, and the distribution of estimated cutpoints indicates significant heterogeneity. Consequently, instead of step functions, actual average entry rates are U-shaped functions of the ideal points in all treatments, with over-entry when the BNE entry probability is smaller than fifty percent and (weak) under-entry when it is greater than fifty percent. Because participants with moderate ideal points sometimes enter and win, we observe less political polarization and thus on average a smaller total policy loss and greater economic welfare than predicted (with over-entry, the greater total expense is exceeded by the smaller policy loss). The primary comparative static predictions of logit QRE are all supported in the data, as they are the same as those of BNE, but in addition QRE tracks the levels and patterns of entry and welfare much better. Third, ideological parties lead to more polarization, but at the same time alleviate some of the inefficiencies caused by extreme policies because knowledge of a nominee’s party affiliation enables implicit vote coordination in favor of the majority, which is more likely to win than in the absence of parties.
Overall, this study shows empirically that incomplete information in elections can indeed lead to inefficient political polarization through the informational effects on entry. In order to check the robustness of our findings, future research could, for example, examine various different distributions of ideal points (e.g., asymmetric distributions) and default policies. Another interesting direction is to compare different voting systems (e.g., Bol, Dellis, and Oak Reference Bol, Dellis, Oak, Gallego and Schofield2016) and to study more explicitly the formation of parties and how they select their nominees, such as via primaries (e.g., Hansen Reference Hansen2014). An interesting extension would be to model the party nomination process in more detail. For example, one might suppose that if there are several entrants in the same party, the one most preferred by the median party member would be chosen, rather than a randomly selected one. This could have several effects that work in different directions. On the one hand, the closer a party member believes her ideal point is to the expected party median, the greater is her incentive to run for office due to higher chances of winning the nomination. On the other hand, if some other party member becomes the nominee, that nominee would also be close to the party median, which decreases the incentive to enter. It is not clear how these competing effects would balance out in an equilibrium model, and there are other possible ways to model the nomination process. We hope that our findings may inspire further research on extensions such as this in order to increase our understanding of the complex and substantively important political phenomena of candidate selection and polarization.
SUPPLEMENTARY MATERIAL
To view supplementary material for this article, please visit https://doi.org/10.1017/S0003055418000631.
Replication materials can be found on Dataverse at: https://doi.org/10.7910/DVN/EDRAIQ.










Comments
No Comments have been published for this article.