I. INTRODUCTION
Ceria nanoparticles (NPs) have been used in various applications such as automobile catalytic converter, oxygen sensor, solid oxide fuel cell, and glass polishing. Reference Jasinski, Suzuki and Anderson1–Reference Cook5 In many of these applications, the high performance of ceria NPs is attributed to the formation of oxygen vacancy defects. Reference Esch, Fabris, Zhou, Montini, Africh, Fornasiero, Comelli and Rosei6,Reference Campbell and Peden7 Ceria NPs are easily reduced due to their low oxygen vacancy formation energy, making them prone to the formation of oxygen vacancy defects. Reference Bevan and Kordis8,Reference Lawrence, Brewer, Wang, Wu, Wells-Kingsbury, Ihrig, Wang, Soo, Mei and Cheung9 The oxygen vacancy defects leave behind two electrons that localize on two adjacent cerium ions, reducing their valence state from Ce4+ to Ce3+. Reference Dutta, Pal, Seehra, Shi, Eyring and Ernst10,Reference Skorodumova, Simak, Lundqvist, Abrikosov and Johansson11
Ce3+ ions are believed to be the reactive sites on the surfaces of ceria NPs with respect to interactions with other molecules. Recently, many researchers have investigated the effect of Ce3+ sites on ceria NPs upon the interactions of NPs with anions, carbon materials, and small molecules. Reference Seo, Moon, Kim, Lee, Hwang, Yoon, Yi and Paik12–Reference Marrocchelli and Yildiz15 Seo et al. experimentally demonstrated the role of Ce3+ ions as adsorption sites for silicate anions. Reference Seo, Moon, Kim, Lee, Hwang, Yoon, Yi and Paik12 Song et al. quantitatively analyzed the adsorption of CO2 on Ce3+ sites. Reference Song, Liu and Nishiguchi14 Thus, the efficient reaction of ceria NPs with other molecules requires increasing the concentration of reactive Ce3+ sites.
Many approaches to increase the Ce3+ concentration in ceria NPs have been studied, such as dopant introduction, particle size reduction, and shape-selective synthesis. Reference Vanpoucke, Cottenier, Van Speybroeck, Van Driessche and Bultinck16–Reference Masui, Fujiwara, Machida, Adachi, Sakata and Mori19 Among these, decreasing the particle size is the most widely used technique due to its higher efficiency in forming Ce3+ ions compared to other approaches. Reference Masui, Fujiwara, Machida, Adachi, Sakata and Mori19–Reference Tsunekawa, Ishikawa, Li, Kawazoe and Kasuya21 As the ceria NP size decreases, the loss of oxygen atoms on the surface leads to a high lattice strain, resulting in increased concentrations of Ce3+ ions. Reference Deshpande, Patil, Kuchibhatla and Seal20–Reference Hailstone, DiFrancesco, Leong, Allston and Reed22 However, to increase the Ce3+ ion concentration to any remarkable degree, the particle size must be decreased below 10 nm Reference Hailstone, DiFrancesco, Leong, Allston and Reed22 ; this restricted range of particle size limits the applicability. Therefore, it is desirable to develop a new, more widely applicable approach for fabricating Ce3+-enriched ceria NPs.
Herein, we report a facile strategy whereby ultrasmall ceria NPs are formed as a shell layer on larger ceria NPs, thereby yielding Ce3+-enriched core–shell ceria NPs, and we investigate the silicate adsorption properties of these enriched NPs. To ensure high concentrations of Ce3+ ions, we controlled the average diameter of the ultrasmall ceria NPs in the shell layer to be around ∼5 nm. Reference Deshpande, Patil, Kuchibhatla and Seal20,Reference Hailstone, DiFrancesco, Leong, Allston and Reed22 The Ce3+ sites on the surface of ceria NPs react with silicate anions, resulting in strong Ce–O–Si bonding. Reference Seo, Moon, Kim, Lee, Hwang, Yoon, Yi and Paik12,Reference Dandu, Peethala and Babu23 Silicate anion adsorption isotherms were acquired for the core–shell and pristine ceria NPs and were fitted by using both the Langmuir and Freundlich models. We applied the core–shell ceria NPs to chemical mechanical planarization (CMP) of silicate glass; the improvement in CMP observed corresponded to the increased silicate adsorption observed in the adsorption isotherm analysis.
II. EXPERIMENTAL
A. Materials
The bare ceria NPs used for this study were commercially available materials (CeO2, Rhodia Inc., La Défense, France). Cerium nitrate hexahydrate (Ce(NO3)3·6H2O, Sigma Aldrich, St. Louis, Missouri) was used as a precursor to synthesize the ultrasmall ceria NPs. The specific surface areas of the bare ceria NPs and core–shell ceria NPs, measured by means of the Brunauer–Emmett–Teller method (BET; Quantachrome, Boynton Beach, Florida), were 13.0 and 20.5 m2/g, respectively. Sodium metasilicate (Na2SiO3·9H2O, Sigma Aldrich, St. Louis, Missouri) was used to acquire silicate adsorption isotherms. Ammonium hydroxide (NH4OH, 28–30 wt%, Junsei, Tokyo, Japan) and nitric acid (HNO3, 1.0 N, Sigma Aldrich, St. Louis, Missouri) were used to adjust pH. Blanket SiO2 films were deposited on a 200-mm-diameter Si wafer by means of plasma-enhanced oxide deposition from tetraethyl orthosilicate. The thickness of the as-deposited SiO2 films was found to be 1200 nm. The 200-mm-diameter wafer was cut into several 6 × 6 cm pieces for polishing evaluation.
B. Preparation of core–shell ceria NPs
Bare ceria NPs of 5 wt% were added to a 0.005 M solution of Ce(NO3)3 in deionized water. 1.0 N NH4OH solution was added to adjust the solution to pH 11 and to maintain this pH, and then the mixture was stirred for 2 h. In this time, the nitrate groups on the surface of pristine ceria NPs are removed and ammonia groups remain on their surface. The solution was then transferred to a Teflon bottle and placed in a stainless steel autoclave at 443 K for 12 h. In this hydrothermal reaction, the ammonia groups lead to the precipitation of ceria NPs on the surface of pristine ceria NPs. The sample was then centrifugally washed with water 5 times and then dried at 80 °C for 24 h.
C. Characterization
The detailed structural features of pristine ceria NPs and core–shell ceria NPs were investigated by means of field emission scanning electron microscopy (FE-SEM; JSM07600F, JEOL, Tokyo, Japan) and high-resolution transmission electron microscopy (HR-TEM; Titan 80-300, FEI, Eindhoven, the Netherlands). To identify the oxidation states of the pristine and core–shell ceria, high-angle annular dark field scanning transmission electron microscopy (HAADF STEM) and electron energy loss spectroscopy (EELS) studies were performed using the same equipment used for HR-TEM. To confirm the EELS data, the concentration of Ce3+ ions was calculated by means of X-ray photoelectron spectrometry (XPS; Thermo Fisher Scientific, Waltham, Massachusetts). In addition, the OH groups were analyzed by means of XPS and Fourier transform infrared spectroscopy (FT-IR; Nicolet 5700, ThermoElectron, Waltham, Massachusetts). The number of OH groups was calculated by means of thermal gravimetric analysis (TGA; Q-5000 IR, TA Instruments, New Castle, Delaware). The nanotopography of the SiO2 film was measured with a commercial multimode atomic force microscope (AFM; XE-150, Park Systems, Suwon, Korea). The Si AFM tip (SI-CONGG, AppNano, Mountain View, California) was used to investigate the surface roughness using the contact mode.
D. Adsorption isotherm analysis
Adsorption isotherms were plotted by using the data from inductively coupled plasma atomic emission spectroscopy (ICP-AES; Optima 7300 DV, Perkin Elmer, Waltham, Massachusetts). Pristine and core–shell ceria suspension samples were prepared having various concentrations of silicate anions; the pH of each suspension was adjusted to pH 7. The mixtures were equilibrated for 12 h, during which time they were continuously agitated by means of rolling. The suspensions were then centrifuged to remove the ceria and the adsorbed silicate anions. The supernatants were further clarified by using 0.02 μm synringe filters (Anotop 25, Whatman plc, Maidstone, United Kingdom) and then analyzed in triplicate by means of ICP. The results were corrected for the ICP background by using a blank solution derived from a native ceria suspension in the absence of silicate anions. ICP responses were converted to masses by using an experimentally determined calibration curve. Adsorption isotherms were calculated by determining the difference between the added silicate amounts and the amounts remaining in the supernatants.
E. CMP evaluations
Pristine and core–shell ceria NPs were used in chemical mechanical planarization (CMP) evaluations as 1 wt% dispersions in deionized water. The pH of all slurries was adjusted to pH 7. CMP was performed by using coupon CMP tools (CP-4, CETR, Billerica, Massachusetts) with an industrial standard CMP pad (IC 1010/Suba IV, Rohm and Haas Electronic Materials, Philadelphia, Pennsylvania). Table SI lists the CMP conditions used. The thickness of the SiO2 film was measured by using an UVISEL spectroscopic ellipsometer (MM-16, Jobin Yvon Horiba, Kyoto, Japan).
III. RESULTS AND DISCUSSION
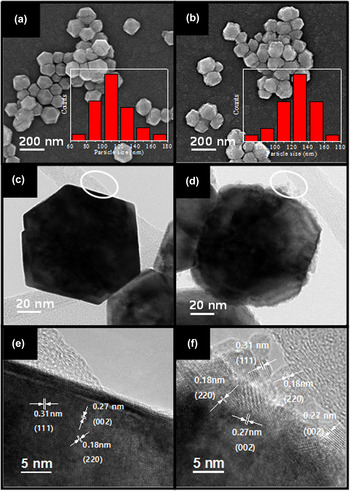
The SEM analysis of pristine and core–shell ceria NPs showed that their particle sizes ranged from 100 to 200 nm [Figs. 1(a) and 1(b)]. Bright field TEM images of NPs were also acquired, showing that the pristine ceria NPs were polyhedral whereas the core–shell ceria NPs were nearly spherical owing to the surface coverage by the ultrasmall (∼5 mm) ceria NPs [Figs. 1(c) and 1(d)]. The deposition of these ultrasmall ceria NPs on the pristine ceria NPs, resulting in the increase of the particle size distribution. The thickness of the shell layers composed of ultrasmall ceria NPs was about 10 nm. The HR-TEM analysis of pristine ceria NPs revealed lattice fringes of 0.31, 0.27, and 0.18 nm that, respectively, corresponded to the (111), (002), and (220) planes of ceria NPs [Fig. 1(e)]. Reference Huang, Chen, Jiang, Jin, Zhu and Sun24,Reference Ou, Mori, Togasaki, Takahashi, Ye and Drennan25 The clear (111), (002), and (220) lattice fringes of the ultrasmall ceria NPs evidenced their successful crystalline growth [Fig. 1(f)].
(a and b) FE-SEM and (c–f) TEM images of (a, c, and e) pristine and (b, d, and f) core–shell ceria NPs. Insets: particle size distributions.

The EELS data on ceria NPs can provide information about their oxidation states by means of the analysis of core-loss edges such as the M4,5 edge.
Reference Wang, Crozier, Sharma and Adams26–Reference Wu, Wiesmann, Moodenbaugh, Klie, Zhu, Welch and Suenaga28
Recently, Turner et al. studied the valence change of ceria NPs by using HAADF STEM in combination with resolved EELS.
Reference Turner, Lazar, Freitag, Egoavil, Verbeeck, Put, Strauven and Van Tendeloo27
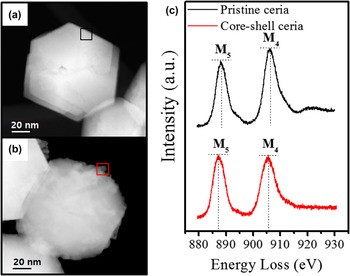
Figure 2 shows the HAADF STEM images and the energy-loss near-edge structure of the Ce M4,5 edge of pristine and core–shell ceria NPs. The spectra were extracted at the positions indicated by the black and red squares in the micrographs of Figs. 2(a) and 2(b), respectively. In the spectra, two sharp peaks are clearly seen, which show the intensity of M4 and M5. The relative intensity of the two peaks,
 ${{{I_{{{\rm{M}}_4}}}} \mathord{\left/ {\vphantom {{{I_{{{\rm{M}}_4}}}} {{I_{{{\rm{M}}_5}}}}}} \right. \kern-\nulldelimiterspace} {{I_{{{\rm{M}}_5}}}}}$
, can reflect the oxidation states of the Ce ions.
Reference Wu, Wiesmann, Moodenbaugh, Klie, Zhu, Welch and Suenaga28
In our experiment, the value of this ratio was 1.16 for pristine ceria NPs and 1.01 for core–shell ceria NPs. These results highlight the fact that the ultrasmall ceria NPs comprising the shell of the core–shell ceria NPs contained Ce predominantly as Ce3+ ions.
(a and b) HAADF STEM images of (a) pristine ceria and (b) core–shell ceria NPs. (c) Ce M4,5 edge ELNES signatures of pristine and core–shell ceria NPs, acquired by means of EELS.

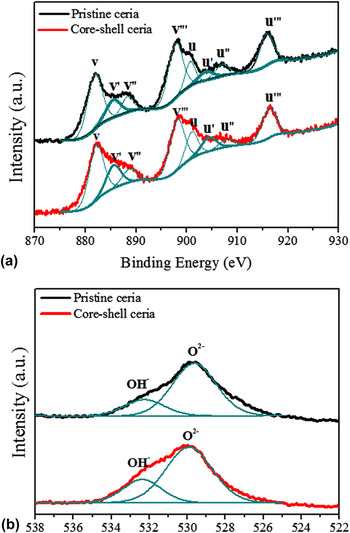
The XPS analysis was carried out to validate the differences in the oxidation states of pristine and core–shell ceria NPs arising from the increase in the concentration of Ce3+ ions on the surface of the latter. Figure 3(a) shows the Ce 3d XPS spectra for the pristine and core–shell ceria NPs. The peaks for Ce 3d are split into the Ce 3d 5/2 and Ce 3d 3/2 ionizations. In the figure, the peaks labeled v, v′, v″, and v‴ belong to the Ce 3d 5/2 ionization, whereas the peaks u, u′, u″, and u‴ belong to the Ce 3d 3/2 ionization. Reference Deshpande, Patil, Kuchibhatla and Seal20,Reference Shyu, Weber and Gandhi29 Among these peaks, v′ and u′ are characteristic of Ce3+ ions, whereas v, v″, v‴, u, u″, and u‴ peaks are attributed to the Ce4+ ions. Reference Shyu, Weber and Gandhi29 The concentrations of Ce3+ ions were calculated from the v and u peak areas Reference Deshpande, Patil, Kuchibhatla and Seal20 as follows:
 $$\left[ {{\rm{C}}{{\rm{e}}^{3 + }}} \right] = {{v' + u'} \over {v + v' + v'' + v''' + u + u' + u'' + u'''}}\quad .$$
(a) Ce 3d and (b) O 1s XPS spectra of pristine and core–shell ceria NPs.

Table I lists detailed information on the XPS analysis. The concentration of Ce3+ ions in the core–shell ceria NPs was found to be higher than that in the pristine ceria NPs, consistent with the EELS results. This confirmed that the ultrasmall ceria NPs on the surface of the core–shell ceria NPs increased the total concentration of Ce3+ ions in the particles.
Ce 3d and O 1s XPS peak assignments for pristine and core–shell ceria NPs.

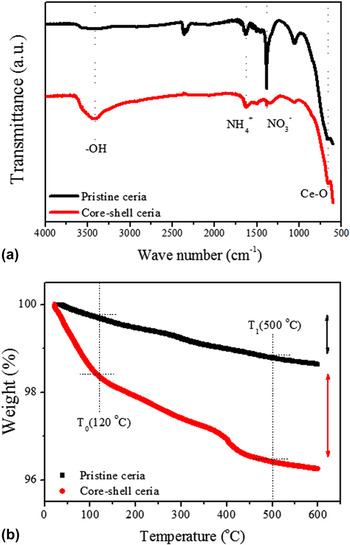
In aqueous systems, the presence of Ce3+ ions leads to the dissociation of H2O, resulting in the formation of hydroxyl (OH) groups on the surface. Reference Senanayake, Stacchiola, Evans, Estrella, Barrio, Pérez, Hrbek and Rodriguez30,Reference Zhang, Yu, Grass, Dejoie, Ding, Gaskell, Jabeen, Hong, Shavorskiy and Bluhm31 In particular, these OH groups on the surface function as reactive sites for the adsorption of other materials. Reference Armistead, Tyler, Hambleton, Mitchell and Hockey32 The concentrations of surface OH groups on the pristine and core–shell ceria NPs were determined by means of O 1s XPS analysis [Fig. 3(b)]; the two peaks observed in the XPS spectra were assigned to lattice oxygen O2− and surface OH−. Reference Erdem, Hunsicker, Simmons, Sudol, Dimonie and El-Aasser33,Reference Van den Brand, Sloof, Terryn and De Wit34 The amount of OH groups can be analyzed by deconvolution of the O 1s response into OH− and O2− peaks. Reference Erdem, Hunsicker, Simmons, Sudol, Dimonie and El-Aasser33 Based on the ratios between OH− and O2−, OH−/O2− (see Table I), more OH groups existed on the surfaces of the core–shell ceria NPs than those of the pristine ceria NPs. This result is attributed to the presence of the ultrasmall ceria NPs on the surface of the core–shell ceria NPs, which included high concentrations of Ce3+ ions. To confirm the XPS data, we acquired the FT-IR spectra of the pristine and core–shell ceria NPs [Fig. 4(a)]. Bands observed at 600–750 cm−1 were attributed to stretching of CeO2. Reference Lee and Choi35 In addition, a sharp peak at 1380 cm−1 corresponded to the surface nitrate groups on the pristine ceria NPs. This peak was quite weak for the core–shell ceria NPs because nitrate groups are replaced by hydroxyl groups under conditions of pH 10.5 and above. Reference Nabavi, Spalla and Cabane36 The OH stretching bands of ceria NPs were observed in the range of 3200–3600 cm−1. Reference Daturi, Finocchio, Binet, Lavalley, Fally and Perrichon37 The intensity of this peak substantially increased for the core–shell ceria NPs. The quantification of the OH group content in pristine and core–shell ceria NPs was performed by means of TGA Reference Ek, Root, Peussa and Niinistö38,Reference Kim, Chang, Kong, Kim, Kim and Kim39 and calculated as follows:
 $$\# {\rm{OH}}\left( {{\rm{n}}{{\rm{m}}^{ - 2}}} \right) = {{2\left( {WL\left( {{T_0}} \right) - WL\left( {{T_1}} \right)} \right) \cdot {N_{\rm{A}}}} \over {100{M_{{{\rm{H}}_2}{\rm{O}}}} \cdot {S_{{\rm{BET}}}}}}\quad ,$$
where WL(T
0) and WL(T
1) are the weights of the ceria particles (wt%) at temperatures T
0 and T
1, respectively
Reference Ek, Root, Peussa and Niinistö38
; N
A is Avogadro’s number,
 ${M_{{{\rm{H}}_2}{\rm{O}}}}$
is the molecular weight of water, and S
BET is the specific surface area of the ceria NPs.
Reference Kim, Chang, Kong, Kim, Kim and Kim39
This equation yields the number of hydroxyl groups per unit area of the ceria NPs. Figure 4(b) shows the TGA graphs of pristine and core–shell ceria NPs within the range of 40–600 °C under N2 environment. The first weight loss was attributed to the elimination of the physisorbed water between 40 and 120 °C.
Reference Mueller, Kammler, Wegner and Pratsinis40
The OH groups on the surface of the ceria particles were then removed between 120 and 500 °C.
Reference Mueller, Kammler, Wegner and Pratsinis40,Reference Asgari, Haghighi and Shafiei41
The OH/nm2 values of pristine and core–shell ceria NPs were thus calculated based on the weight loss observed during heating from T
0 = 120 °C to T
1 = 500 °C. The OH/nm2 values calculated for pristine and core–shell ceria NPs were 0.44 and 0.71, respectively. This result is in agreement with the O 1s XPS and FT-IR data. The ultrasmall ceria NPs on the surface of core–shell ceria NPs resulted in increased OH surface density.
(a) FT-IR spectra and (b) TGA curves of pristine and core–shell ceria NPs.

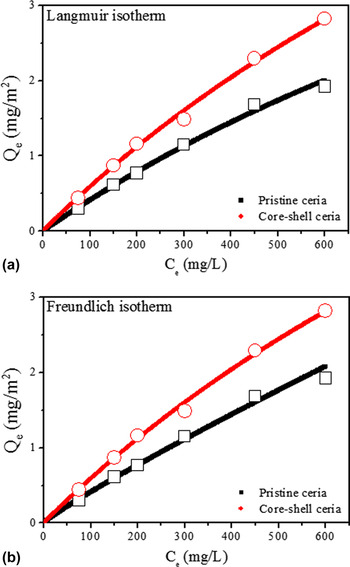
As we have mentioned, surface OH groups function as reactive sites. Especially in CMP applications, Ce–OH groups react with silicate anions on the surface of a SiO2 film, resulting in the formation of Ce–O–Si bonds. Reference Seo, Moon, Kim, Lee, Hwang, Yoon, Yi and Paik12,Reference Dandu, Peethala and Babu23 Adsorption isotherms of silicate anions on pristine and core–shell ceria NPs were plotted to elucidate the interactions between silicate anions and OH groups on the surfaces of ceria NPs. Figures 5(a) and 5(b) show the adsorption isotherms plotted for the adsorption of silicate anions onto pristine and core–shell ceria NPs at pH 7. The experimental data were analyzed by means of the Langmuir and Freundlich models. Reference Langmuir42,Reference Freundlich43
Adsorption isotherms of pristine and core–shell ceria NPs as a function of silicate concentration at pH 7: (a) Langmuir and (b) Freundlich plots.

The Langmuir model can be expressed by the following equation:
 $${{{C_{\rm{e}}}} \over {{Q_{\rm{m}}}}} + {1 \over {b{Q_{\rm{m}}}}} = {{{C_{\rm{e}}}} \over {{Q_{\rm{e}}}}}\quad ,$$
and the Freundlich model can be expressed by the following equation:
 $${Q_{\rm{e}}} = {K_{\rm{F}}}C_{\rm{e}}^{{\textstyle\,\,{1 \over n}}}\quad ,$$
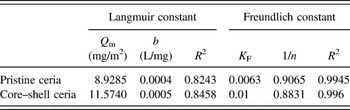
where C e (mg/L) is the equilibrium concentration of silicate ions in solution, Q e (mg/m2) is the amount of silicate anions adsorbed on the ceria NPs at equilibrium, Q m is the maximum adsorbed amount (mg/m2), and b is the Langmuir constant (L/mg). Reference Langmuir42 The Freundlich constant K F is related to the adsorption capacity, and 1/n is correlated to the adsorption intensity. Reference Freundlich43
Table II lists the constants calculated from the two models. The higher correlation coefficient (R 2) of the Freundlich model indicates that this model fits the data better than the Langmuir model. The Langmuir and Freundlich models, respectively, assume homogeneous and heterogeneous adsorption of silicate anions on the ceria NPs. Reference Langmuir42,Reference Freundlich43 It is therefore reasonable to conclude that silicate anions were heterogeneously adsorbed on the surfaces of the ceria NPs as multilayers. In the case of core–shell ceria NPs, at the silicate concentration of 600 mg/L, the amount of adsorbed silicate anions was 2.82 mg/m2; contrastingly, this value was 1.92 mg/m2 for pristine ceria NPs. In addition, the value of K F determined for the core–shell ceria NPs was higher than that of the pristine ceria NPs, indicating the higher adsorption capacity of the core–shell ceria NPs. These results support the conclusion that the concentrations of Ce3+ ions and OH groups on the surface of core–shell ceria NPs were greater owing to the presence of the ultrasmall ceria NPs.
Langmuir and Freundlich constants for the adsorption of silicate ions on pristine and core–shell ceria NPs.

In CMP applications, ceria NPs are used as abrasives for the removal of silicate glass because they form Ce–O–Si bonds that aid in removing SiO2. Reference Cook5,Reference Seo, Moon, Kim, Lee, Hwang, Yoon, Yi and Paik12,Reference Dandu, Peethala and Babu23 To identify the effect upon silicate glass removal of the increase in surface OH groups of core–shell ceria NPs, arising from their higher concentration of Ce3+ ions, we applied both pristine and core–shell ceria NPs to the CMP process. The SiO2 removal rate of the core–shell ceria NPs was higher than that of the pristine ceria NPs (Fig. S1) due to the high affinity of the core–shell ceria NPs to silicate anions, in agreement with the adsorption isotherm results. In addition, the surface properties such as nanotopography of SiO2 film after CMP are shown in Fig. S2. Although the standard deviation (root mean square, Rms) of the nanotopography was slightly decreased, the difference was quite small.
IV. CONCLUSIONS
We synthesized Ce3+-enriched core–shell ceria NPs for enhanced silicate adsorption. Ultrasmall ceria NPs (∼5 nm) were synthesized on the surface of pristine ceria NPs (∼100 nm) to enrich the overall Ce3+ concentration of NPs. The EELS results showed that Ce in these ultrasmall ceria NPs predominantly existed as Ce3+ ions, whereas the surface Ce of the larger pristine ceria NPs is almost exclusively Ce4+ ions. The Ce 3d XPS spectra confirmed the increased Ce3+ concentration of the core–shell ceria NPs relative to that of the pristine ceria NPs. As the Ce3+ concentration was increased, OH groups on the surfaces of the ceria NPs were also increased, as identified by FT-IR and TGA analyses. The silicate anion adsorption properties of the core–shell ceria NPs were analyzed and fitted using both the Langmuir and Freundlich models. The adsorption isotherm was better fitted by the Freundlich model, with a correlation coefficient value (R 2) of 0.99; this suggested a heterogeneous adsorption mechanism. The Freundlich constants of adsorption capacity (K F) and adsorption intensity (1/n) indicated that the core–shell ceria NPs had higher silicate anion adsorption affinity than the pristine ceria NPs. Accordingly, the core–shell ceria NPs showed a greater silicate adsorption than the pristine ceria NPs in a CMP experiment. The results of the present study demonstrate the ability of ultrasmall ceria NP coatings to increase the Ce3+ concentration and show that this strategy can be applied to many applications that would benefit from the enhanced reactivity of ceria NPs.
Supplementary Material
To view supplementary material for this article, please visit https://doi.org/10.1557/jmr.2017.189.
ACKNOWLEDGMENTS
This work was supported by the Korea Institute of Energy Technology Evaluation and Planning (KETEP) and the Ministry of Trade, Industry & Energy (MOTIE) of the Republic of Korea (No. 20168510050080).