Implications
This study investigated the relationships of thyroid hormones, serum energy metabolites, reproductive parameters, milk yield and body condition score with the different patterns of postpartum luteal activity in the postpartum period. The serum thyroid hormones’ profile differs in high-producing dairy cows showing prolonged luteal phase, anovulation and delayed first ovulation in comparison with the cows with normal postpartum luteal activity.
Introduction
High-yielding dairy cows have been selected to produce more milk, in large part through their ability to mobilize fat and muscle to support milk production in early lactation. This results in a loss of body condition score (BCS) and is associated with alterations in blood metabolites and hormone profiles, which in turn influence fertility (Pryce et al., Reference Pryce, Coffey and Simm2001; Wathes et al., Reference Wathes, Fenwick, Cheng, Bourne, Llewellyn, Morris, Kenny, Murphy and Fitzpatrick2007). The nutritional status of cattle is communicated within the hypothalamic–pituitary–ovarian axis via metabolic hormones or blood metabolites or both (Butler, Reference Butler2000). Previous studies have focused on the association between negative energy balance (NEB) postpartum and delayed onset of ovarian cyclicity, and hence poor fertility (Lucy, Reference Lucy2003; Patton et al., Reference Patton, Kenny, McNamara, Mee, O'Mara, Diskin and Murphy2007; Wathes et al., Reference Wathes, Fenwick, Cheng, Bourne, Llewellyn, Morris, Kenny, Murphy and Fitzpatrick2007).
It has been shown that thyroid hormones (thyroxine: T4 and 3,30,5-tri-iodothyronine: T3) are involved in the adaptation of energy metabolism in dairy cows (Reist et al., Reference Reist, Erdin, von Euw, Tschümperlin, Leuenberger, Hammon, Morel, Philipona, Zbinden, Künzi and Blum2003; Mohebbi-Fani et al., Reference Mohebbi-Fani, Nazifi, Rowghani, Bahrami and Jamshidi2009) and sheep (Eryavuz et al., Reference Eryavuz, Avci, Kucukkurt and Fidan2007; Novoselec et al., Reference Novoselec, Antunović, Šperanda, Steiner and Šperanda2009). T4 is converted to metabolically active T3 in the thyroid gland and other tissues by 5′-deiodinase (Moreno et al., Reference Moreno, de Lange, Lombardi, Silvestri, Lanni and Goglia2008). Studies have shown both indirect (De Moraes et al., Reference De Moraes, Vera-Avila, Lewis, Koch, Neuendorff, Hallford, Reeves and Randel1998; Flores et al., Reference Flores, Looper, Rorie, Hallford and Rosenkrans2008) and direct (Spicer et al., Reference Spicer, Alonso and Chamberlain2001) effects of thyroid hormones on ovarian activity in cattle. De Moraes et al. (Reference De Moraes, Vera-Avila, Lewis, Koch, Neuendorff, Hallford, Reeves and Randel1998) showed that induced hyperthyroidism in Brahman cows resulted in an increase in serum T3 and was associated with a reduced BCS. The incidence of anestrus in induced hyperthyroidic cows was further observed by De Moraes et al. (Reference De Moraes, Vera-Avila, Lewis, Koch, Neuendorff, Hallford, Reeves and Randel1998). Furthermore, Richards et al. (Reference Richards, Spicer and Wettemann1995) and Flores et al. (Reference Flores, Looper, Rorie, Hallford and Rosenkrans2008) showed that anestrous beef cows with the lowest BCS had lower serum T4 concentrations in the postpartum period. In addition, these anestrous cows were observed to have a smaller dominant follicle (Flores et al., Reference Flores, Looper, Rorie, Hallford and Rosenkrans2008). In dairy cows, Huszenicza et al. (Reference Huszenicza, Kulcsár and Rudas2002) showed that low levels of blood thyroid hormones may delay the onset of postpartum reproductive functions. Further, Reist et al. (Reference Reist, Erdin, von Euw, Tschümperlin, Leuenberger, Hammon, Morel, Philipona, Zbinden, Künzi and Blum2003) showed that high plasma levels of T3 and T4 postpartum were associated with an early start of the ovarian cyclicity. Later, Huszenicza et al. (Reference Huszenicza, Kulcsár, Kóródi, Bartyik, Rudas, Ribiczei-Szabó, Nikolić-Judith, Šamanc, Ivanov and Gvozdić2006) showed that there is a serious delay in the time of the first ovulation and the first visible estrus in cows with low levels of thyroid hormones.
Previous studies using milk or serum progesterone (P4) profiles have shown that NEB is associated with a greater incidence of irregular patterns of luteal activity (Mirzaei et al., Reference Mirzaei, Kafi, Ghavami, Mohri and Gheisari2007; Gautam et al., Reference Gautam, Nakao, Yamada and Yoshida2010; Kafi and Mirzaei, Reference Kafi and Mirzaei2010). These irregularities consisted of delayed first ovulation (DOV), anovulation (AOV), prolonged luteal phase (PLP) and short luteal phase (SLP). Predisposing factors such as greater NEB, uterine infections, heat stress, nutrition and genetic background have been suggested to result in the occurrence of abnormal patterns of luteal activity in postpartum cows (McCoya et al., Reference McCoya, Lennoxa, Maynea, McCaugheya, Edgara, Catneya, Vernera, Mackeya and Gordona2006; Weigel, Reference Weigel2006; Mirzaei et al., Reference Mirzaei, Kafi, Ghavami, Mohri and Gheisari2007). There is a well-known correlation between blood thyroid hormone concentrations and the energy balance of dairy cows (Capuco et al., Reference Capuco, Wood, Elsasser, Kahl, Erdman, Van Tassell, Lefcourt and Piperova2001; Huszenicza et al., Reference Huszenicza, Kulcsár and Rudas2002; Mohebbi-Fani et al., Reference Mohebbi-Fani, Nazifi, Rowghani, Bahrami and Jamshidi2009); however, the actual levels of T3, T4 and the biologically active protein-unbound T3 (free T3, fT3) and T4 (free T4, fT4) levels remain unknown in postpartum high-producing dairy cows with different patterns of luteal activity.
The goals of this study were to characterize the relationships of thyroid hormones, serum energy metabolites, reproductive parameters, milk yield and BCS with the different patterns of postpartum luteal activity in the postpartum period of clinically healthy high-producing dairy cows.
Material and methods
Animals
The Committee for Animal Experiments of Shiraz University approved the experimental protocol. This study was conducted from February 2008 to May 2009 on 113 registered high-producing Holstein cows at the Nemoneh farm of Astan e Ghods in Mashad (36°20′N latitude and 59°35′E longitude, 980 m above sea level), northeastern Iran. Throughout the year, the cows were kept under roofed structures (free-stall barns) with open sides (zero-grazing system) and washed sand for bedding, and were fed according to the NRC 2001. The ration (total mixed ration) included mainly alfalfa, corn silage, beet pulp, cottonseed, soybean, corn and barley. The cows were non-seasonal with year-round calvings. The cows were machine-milked three times daily. The parity of the cows ranged from 3 to 7 years (mean, 3.9 years). The mean (±standard deviation, s.d.) peak milk yield of the cows during 9 weeks postpartum was 56.5 ± 7.0 kg/day. Only healthy cows free of detectable reproductive disorders and free of any clinical disease during the interval from the 1st to the 9th week after calving were used in this study. Exclusion criteria were disorders including dystocia, retained placenta (fetal membranes retained longer than 24 h after calving), palpably detectable endometritis, metritis, mastitis, abnormal genital discharges and metabolic diseases such as clinical hypocalcaemia and ketosis.
Milk yield, BCS and reproductive examination
Milk yield was recorded weekly until the 9th week postpartum. BCS (scale 1 to 5 with 0.25 increments) of the cows was taken weekly from the 1st to the 8th week postpartum (Ferguson et al., Reference Ferguson, Galligan and Thomsen1994). Transrectal ultrasound scanning was performed twice weekly (3 days apart) from the 1st to the 8th week postpartum to determine the condition of the ovaries using a real-time B-mode ultrasound scanner equipped with a 5 MHz linear array transducer (500 V, Ultra Scan 900, Ami, Medical Alliance Inc., Quebec, Montreal, Canada). Visible structures on the ovaries were recorded. The ovarian stroma was echogenic, being represented by a mottled echotexture. The mature corpus luteum was easily distinguished from the ovarian stroma by its well-defined border and distinctive echotexture (Hanzen et al., Reference Hanzen, Pieterse, Scenczi and Drost2000). Transrectal palpation of the uterus and visual examination of the vagina were carried out to detect the presence of any abnormal discharge.
Serum metabolites and hormone determination
Blood samples were collected from all cows through the coccygeal vein from the 1st to the 8th week postpartum to measure P4 twice weekly and beta-hydroxybutyrate (BHBA), non-esterified fatty acids (NEFA), T3, T4, fT3 and fT4 every 2 weeks. Samples were allowed to clot at room temperature for up to 1 h, centrifuged for serum harvest (for 10 min at 3000 × g) and serum samples were stored at −22°C until assayed.
Serum P4 concentrations were determined using a validated commercial radioimmunoassay kit (Immunotech kit, Immunotech S.A.S., Marseille, France). The intra- and inter-assay coefficients of variation (CVs) of the assays were 5.8% and 9.0%, respectively. The sensitivity of the test was 0.05 ng/ml, and the recovery rate of the assay ranged from 85% to 110%. Serum BHBA and NEFA concentrations were determined using a D-3-hydroxybutyrate kit and an NEFA kit (Randox Laboratories Ltd, Crumlin, Antrim, UK), respectively. The intra-assay coefficients of variation (CV) for BHB and NEFA were ⩽5.5% and ⩽4.5% and the inter-assay CV values were ⩽7.3% and ⩽9.7%, respectively. The measuring range for BHB and NEFA were 0.100 to 5.75 mmol/l and 0.072 to 2.24 mmol/l, respectively. Serum T3 concentrations were determined using a competitive enzyme immunoassay kit (Padtan Elm Co., Tehran, Iran). The intra- and inter-assay CVs of the assays were 12.6% and 13.2%, respectively. The sensitivity of the test was 0.2 ng/ml. Serum T4 concentrations were measured using a competitive enzyme immunoassay kit (Monobind Inc., CA, USA). The intra- and inter-assay CVs of the assays were 3.0% and 3.7%, respectively. The sensitivity of the test was 0.4 μg/dl. Serum fT3 and fT4 concentrations were determined by the fT3 and the fT4 ELISA kits (DiaPlus Inc., San Francisco, CA, USA). The intra- and inter-assay CVs of the fT3 assays were 4.1% and 5.2%, respectively. The sensitivity of the test was 0.05 pg/ml. The intra- and inter-assay CVs of the fT4 assays were 4.5% and 3.7%, respectively. The sensitivity of the test was 0.05 ng/dl.
Definitions
Cows with serum P4 concentrations greater than or equal to 1 ng/ml on at least two consecutive blood samplings were considered to have luteal activity (Stevenson, Reference Stevenson1997). Cows were classified into the following groups on the basis of the characteristics of their P4 profile (Opsomer et al., Reference Opsomer, Coyyn, Deluyker and de Kruif1998; Shrestha et al., Reference Shrestha, Nakao, Higaki, Suzuki and Akita2004; Mirzaei et al., Reference Mirzaei, Kafi, Ghavami, Mohri and Gheisari2007).
The resumption of luteal activity was defined as normal luteal activity (NLA) if the first P4 rise occurred equal to or less than 45 days after calving and was followed by regular ovarian cycles (n = 25). If ovulation did not occur in less than 45 days after calving or irregular ovarian cycles were observed after the occurrence of ovulation in less than 45 days of calving, the cows were classified in abnormal luteal activity groups and further classified into the following types.
The cows showing one ovarian cycle with luteal activity having a length equal to or more than 19 days were defined as PLP (n = 30). The cows were classified into DOV if the first ovulation did not occur until 45 days after calving (n = 10) and AOV if they did not show luteal activity during the period of the study (n = 6). The cows showing one or more ovarian cycles with luteal activity having a length less than 10 days (excluding the first cycle) were defined as SLP. Finally, ovarian cysts (follicular or luteal cysts) were defined as a non-echogenic area at least 25 mm in diameter persistent for more than 10 days in the absence of a mature corpus luteum (Braw-Tal et al., Reference Braw-Tal, Pen and Roth2009).
Reproductive parameters
Reproductive performance of cows in this study was evaluated using the following parameters: calving-to-first service interval (days from calving to first service), calving-to-conception interval (days from calving to conception as defined by pregnancy detection based on transrectal ultrasonography at day 40 post service) and number of services per conception (the number of services required to achieve a pregnancy).
Statistical analyses
A total of 38 cows were excluded from the analysis because of the occurrence of mastitis, metritis, lameness and abomasal displacement during the study. As the data were of repeated observations on individual cows, a mixed procedure of SAS® (Version 9.1; SAS Institute, Cary, NC, USA) was used for the analysis of data of 75 cows. Cows were considered as subject effect and time (weeks) as repeated effect in the model. Time trends in milk yield, BCS, serum metabolites (BHBA and NEFA) and hormones including T3, T4, fT3 and fT4 concentrations and T4 : T3 and fT4 : fT3 ratios during the period of the study were compared between different groups of luteal activity patterns. The interaction term for time by luteal activity groups was also investigated in the model. When the effect of group was significant, the difference between groups at each time interval from calving (weeks) was investigated using the ‘estimate’ statement. The data were presented as least square means (LS mean). Statistical comparisons (mean ± s.d.) for calving-to-conception interval, calving-to-first service interval and services per conception were also performed between the normal and the four abnormal postpartum luteal activity groups using the Mann–Whitney test. Values of P < 0.05 were considered significant.
Results
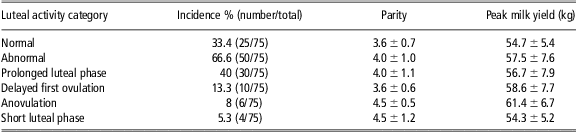
Different patterns of the postpartum luteal activity were expressed as the percentage of the total (Table 1). As the incidence of SLP was low, further analysis was carried out for NLA, PLP, DOV and AOV. In this study, no follicular or luteal cysts as conventionally defined by Braw-Tal et al. (Reference Braw-Tal, Pen and Roth2009) were observed.
Incidence of different patterns of luteal activity based on the serum progesterone profiles, mean ± s.d. of parity and peak of milk yield in high-producing dairy cows

Milk yield, BCS and patterns of luteal activity
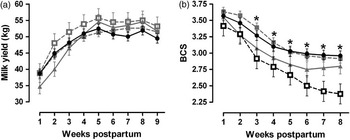
Milk yield increased during the 1st week to the 5th week postpartum (P < 0.001) in all groups of pattern of luteal activity. However, no significant difference was found in the LS mean of milk yield between the cows with NLA and the other abnormal patterns of luteal activity (P = 0.67; Figure 1a).
Comparison of milk yield (kg; a) and body condition score (BCS; b) of high-producing dairy cows with normal luteal activity (n = 25; ●), prolonged luteal phase (n = 30; ▪), delayed first ovulation (n = 10; ▴) and anovulation (n = 6; □) at different time intervals (weeks) from calving. Values are expressed as least square means ± standard error of means. The mixed procedure indicated a significant statistical difference between the highlighted black lines and the line of normal luteal activity (●; P < 0.05). Asterisks indicate a significant statistical difference in the specific week between the highlighted black symbols (P < 0.05).

BCS decreased over time in the four groups of pattern of luteal activity during the study period (P < 0.001). The LS mean of BCS in cows with AOV was significantly lower than that in cows with NLA at the 3rd, 5th, 6th, 7th and 8th week postpartum (P < 0.05; Figure 1b). The decrease in BCS during the 1st to the 8th week postpartum between the NLA and other abnormal luteal activity was not significantly different (P > 0.05).
Serum metabolites, thyroid hormones and patterns of luteal activity
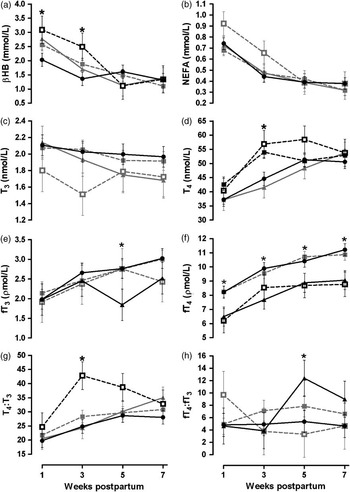
A significant difference was observed in the LS mean of serum BHBA concentrations between cows with AOV and NLA at the 1st (P = 0.04) and the 3rd (P = 0.03) week postpartum (Figure 2a). However, there was no significant difference in the LS mean of serum BHBA concentrations between the cows with NLA and the other abnormal patterns of luteal activity (P = 0.3). A significant decreasing trend was observed in the LS means of serum NEFA concentrations during the study period in all groups of luteal activity patterns (P < 0.001; Figure 2b). However, no significant difference was found in the decrease of serum NEFA concentrations between the cows with the normal and abnormal patterns of luteal activity (P = 0.4).
Comparison of serum concentrations of (a) beta-hydroxybutyrate (BHBA, mmol/l), (b) non-esterified fatty acids (NEFA, mmol/l), (c) 3,30,5-tri-iodothyronine (T3, nmol/l), (d) thyroxine (T4, nmol/l), (e) free T3 (fT3, pmol/l), (f) free T4 (fT4, pmol/l), (g) ratio of T4 to T3 (T4 : T3) and (h) fT4 to fT3 ratio (fT4 : fT3) of high-producing dairy cows with normal luteal activity (n = 25; ●), prolonged luteal phase (n = 30; ▪), delayed first ovulation (n = 10; ▴) and anovulation (n = 6; □) at different time intervals (weeks) from calving. Values are expressed as least square means ± standard error of means. The mixed procedure indicated a significant statistical difference between the highlighted black lines and the line of normal luteal activity (●; P < 0.05). Asterisks indicate a significant statistical difference in the specific week between the highlighted black symbols (P < 0.05).

There was no significant difference in the LS mean and changes in serum T3 concentrations between cows with the normal and abnormal patterns of luteal activity (P = 0.3; Figure 2c). The LS mean of serum T4 concentrations in cows with PLP (P = 0.003) and AOV (P = 0.02) was significantly higher than in NLA cows at the 3rd week postpartum (Figure 2d). The LS mean of serum T4 concentrations did not significantly change (P > 0.05) from the 1st to the 7th week postpartum in cows with PLP, whereas the LS mean of serum T4 concentrations increased during this period in cows with NLA in this study (P < 0.01). There were no significant differences in the LS mean of serum T4 concentrations between cows with the normal and the other abnormal patterns of luteal activity (P = 0.12).
The LS mean of serum fT3 concentrations in cows with DOV was significantly lower than that in cows with NLA at the 5th week postpartum (P = 0.05; Figure 2e). There were no significant differences in the LS mean of serum fT3 concentrations between cows with the normal and the other abnormal patterns of luteal activity (P > 0.05). The LS mean of serum fT4 concentrations in cows with DOV (P = 0.0006) and AOV (P = 0.004) were significantly lower than in cows with NLA during weeks postpartum (Figure 2f). Further, the LS mean of serum fT4 concentrations in cows with DOV was significantly lower than that in cows with NLA at the 1st, 3rd, 5th and 7th week postpartum and in the cows with AOV at the 1st, 5th and 7th week postpartum (P < 0.05; Figure 2f). There were no significant differences in the LS mean and changes of serum fT4 concentrations between the cows with the normal and the other abnormal patterns of luteal activity (P > 0.05).
The LS mean of serum T4 : T3 ratio in cows with AOV was significantly higher (P = 0.009) than in the cows with NLA during the period of study (Figure 2g). Further, the LS mean of serum T4 : T3 ratio in cows with AOV was significantly higher (P = 0.001) than that in cows with NLA at the 3rd week postpartum. There were no significant differences in the LS mean and changes of serum T4 : T3 ratio between cows with the normal and the other abnormal patterns of luteal activity. The LS mean of serum fT4 : fT3 ratio in cows with DOV was significantly higher (P = 0.04) than in cows with NLA at the 5th week postpartum. There were no significant differences in the LS mean and changes of serum fT4 : fT3 ratio between cows with the normal and the other abnormal patterns of luteal activity (P > 0.05; Figure 2h).
Reproductive performance and patterns of luteal activity
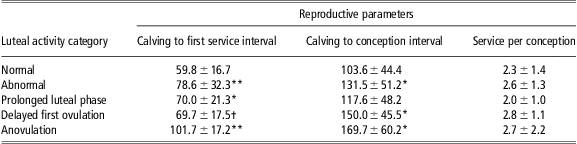
Cows with abnormal luteal activity (P = 0.002), including PLP (P = 0.04) and AOV (P = 0.004), had significantly greater calving-to-first service interval compared with that of the cows that showed postpartum NLA (Table 2). Cows with abnormal luteal activity (P = 0.03), including DOV (P = 0.02) and AOV (P = 0.02), had a greater calving-to-conception interval compared with that of the cows that showed postpartum NLA (Table 2). The mean (±s.d.) parity (P = 0.09) and peak milk yield (P = 0.21) of the cows in the four patterns of luteal activity was not significantly different (Table 1).
Comparison of reproductive parameters (mean ± s.d.) of different patterns of the luteal activity in postpartum high-producing dairy cows

Asterisks indicate significant difference between normal pattern and other abnormal groups within the same column; *P < 0.05, **P < 0.01.
†Indicates difference between normal pattern and other abnormal groups within the same column, P = 0.08.
Discussion
The percentage of PLP was the highest among the types of abnormal pattern of luteal activity observed in this study. The occurrence of PLP has been previously shown to be associated with puerperal disorders of the uterus such as metritis and clinical endometritis (Opsomer et al., Reference Opsomer, Gröhn, Hertl, Coryn, Deluyker and de Kruif2000; Shrestha et al., Reference Shrestha, Nakao, Suzuki, Akita and Higaki2005). Therefore, we purposefully used clinically healthy postpartum cows under a well-managed farm to exclude the adverse effects of clinical uterine diseases on the resumption of ovarian activity. This provided us the possibility of studying other factors influencing the occurrence of PLP in high-producing dairy cows. The LS mean serum T4 concentrations did not change significantly in cows with PLP, whereas the LS mean serum T4 concentrations increased significantly during the period of this study in cows with NLA. The LS mean serum T4 concentrations in cows with PLP was significantly higher than that in cows with NLA only at the 3rd week postpartum. No information is available regarding changes in the blood thyroid hormones concentrations associated with the occurrence of PLP in postpartum dairy cows. However, the corpus luteum function was prolonged when adult rats underwent an induced hypothyroxinemia (Hapon et al., Reference Hapon, Motta, Ezquer, Bonafede and Jahn2007). The prolongation of the corpus luteal function in rats was attributed to a combination of factors including the decrease in luteal prostaglandin F2α and increased synthesis of circulating prostaglandin E2. Therefore, the occurrence of PLP could be a consequence of the disturbance in the thyroid gland function. More research is required to determine mechanisms involving the relationship between circulating thyroid hormones and luteal function in dairy cows.
Results of this study further showed that thyroid function was more prominently different in cows with AOV and DOV compared with cows with postpartum NLA. The concept of depth of anestrus and factors contributing to the duration of the interval of calving to first ovulation (i.e. BCS, age and interval from calving) have been reviewed by Rhodes et al. (Reference Rhodes, McDougall, Burke, Verkerk and Macmillan2003). Cows with AOV are in more depth of anestrus than those with DOV. The results of this study showed significantly higher LS mean serum T4 concentrations in cows with AOV than in cows with NLA, whereas LS mean serum T4 concentrations in cows with DOV were not significantly different from that of cows with NLA. Physiologically, depth of anestrus is related to the frequency of pulsatile LH release (Rhodes et al., Reference Rhodes, McDougall, Burke, Verkerk and Macmillan2003). The role of thyroid hormones in the inhibition of gonadotropin-releasing hormone (GnRH) and LH secretion at the transition from the breeding season to anestrus has been documented by Anderson et al. (Reference Anderson, Connors, Hardy, Valent and Goodman2002) and Viguié et al. (Reference Viguié, Battaglia, Krasa, Thrun and Karsch1999) in the ewe. Therefore, it can be hypothesized that the higher serum concentrations of T4 in the postpartum period could result in the disturbance of GnRH and LH secretion, and hence the occurrence of AOV in high-producing dairy cows. The direct effect of T4 in ovarian follicle steroidogenesis should not also be neglected (Spicer et al., Reference Spicer, Alonso and Chamberlain2001). In addition, the higher serum T4 concentrations are an indication of lipolysis (Flores et al., Reference Flores, Looper, Rorie, Lamb, Reiter, Hallford, Kreider and Rosenkrans2007). In this study, cows with AOV had higher LS mean serum BHBA concentrations and lost BCS faster, a reflection of higher lipolysis, than cows with NLA during the period of study. Consistent with our finding, Mohebbi-Fani et al. (Reference Mohebbi-Fani, Nazifi, Rowghani, Bahrami and Jamshidi2009) showed that in the fresh dairy cows, there were positive correlations between serum T4 and BHBA concentrations. Interestingly, cows with DOV showed no significant differences in the LS mean serum T4 and BHBA concentrations and BCS compared with cows with the NLA in this study. These findings suggest that thyroid hormones may be associated with the onset of ovulation in postpartum dairy cows.
Unlike T4, which is produced solely in the thyroid gland, ∼80% of circulating T3 is produced by extrathyroidal conversion of T4 to T3 by 5′-deiodinase present in organs such as the mammary tissue (Capuco et al., Reference Capuco, Wood, Elsasser, Kahl, Erdman, Van Tassell, Lefcourt and Piperova2001), liver and kidney (Laurberg et al., Reference Laurberg, Vestergaard, Nielsen, Christensen, Seefeldt, Helleberg and Pedersen2007; Shih and Agus, Reference Shih and Agus2009). Thus, there are two mechanisms by which T3 production in cows with AOV may be reduced: decreased activity of the 5′-deiodinase that convert T4 to T3 and decreased delivery of T4 substrate for conversion to T3. Conversion of T4 to T3 by 5′-deiodinase was probably disturbed in the liver because the results of this study showed that the delivery of T4 in cows with AOV was higher than that in the cows with NLA. Consistent with our finding, Pezzi et al. (Reference Pezzi, Accorsi, Vigo, Govoni and Gaiani2003) demonstrated a clear decrease in liver 5′-deiodinase at the peak of lactation in dairy cows. Meanwhile, in cows with AOV, the T4 : T3 ratio increased significantly from the 1st to the 3rd week postpartum. This indicates the increase of serum T4 production and simultaneously the increased tissue requirements of serum T3 consumption. The decrease in T4 : T3 ratio after the 5th week postpartum may be because of the higher conversion of T4 to T3 in the liver of cows with AOV. However, significant changes in peripheral tissue conversion of T4 to T3 may occur without a detectable change in serum T3 or T4 (Capuco et al., Reference Capuco, Keys and Smith1989).
Only 0.03% of the total serum T4 is free (unbound), with the remainder bound to carrier proteins such as T4-binding globulin, albumin and T4-binding prealbumin. Approximately 0.3% of the total serum T3 is free, with the remainder bound to T4-binding globulin and albumin (Yen, Reference Yen2001). It is the free thyroid hormone that enters target cells of the tissues such as the ovaries and generates a biological response. As the unbound serum concentrations of T4 and T3 are versatile indexes to assess thyroid functions (Kimura et al., Reference Kimura, Nakanishi, Nakagawa, Shibukawa and Matsuzaki2005), lower serum concentrations of fT4 in cows with AOV and DOV, which were observed in this study, suggest an increase in tissue requirements of fT4 in contrast with cows with NLA during the postpartum period. Results of this study showed that fT4 : fT3 ratio in the 5th week postpartum in cows with DOV increased, and simultaneously the LS mean milk production was in peak. Pezzi et al. (Reference Pezzi, Accorsi, Vigo, Govoni and Gaiani2003) reported a positive correlation between mammary 5′-deiodinase activity and milk production in dairy cows. The increased exploitation of serum fT3 by the lactating mammary gland or the altered 5′-deiodinase activity in liver (the main serum T3-producing tissue) could explain the increased fT4 : fT3 ratio in cows with DOV in the 5th week postpartum.
Gerloff et al. (Reference Gerloff, Herdt, Wells, Nachreiner and Emery1986) demonstrated that serum thyroid concentrations increased with time postpartum and were negatively associated with liver triglycerides (TG) and serum NEFA concentrations, and probably represent a metabolic adaptation to the NEB of the immediate postpartum period. Moreover, they showed that changes in the fT4 and fT3 paralleled changes in the total T4 and T3 concentrations (Gerloff et al., Reference Gerloff, Herdt, Wells, Nachreiner and Emery1986). In cows with AOV or PLP, calving-to-first service interval and calving-to-conception interval were greater than in cows with NLA. This study also showed that cows with DOV had a greater calving-to-conception interval than cows with NLA. Losing more BCS and then more NEB have both been demonstrated to result in increasing the interval from calving to first ovulation (Beam and Butler, Reference Beam and Butler1999; Wathes et al., Reference Wathes, Fenwick, Cheng, Bourne, Llewellyn, Morris, Kenny, Murphy and Fitzpatrick2007). Cows that started ovarian cycling early had a reduced calving-to-conception interval through having a higher chance of early insemination postpartum, higher conception rate and fewer services per conception than those with a prolonged anovulatory period (Horan et al., Reference Horan, Mee, O'Connor, Rath and Dillon2005).
This study shows that the percentage of PLP was the highest type of abnormal pattern of luteal activity in high-producing dairy cows under the conditions of this study. Results of this study further showed that the serum thyroid hormone profile differed in high-producing dairy cows showing NLA and those with abnormal luteal activity in the postpartum period. In particular, cows with AOV and DOV, as two different degrees of depth of anestrus, showed a prominent different serum thyroid hormones’ profile compared with cows with normal postpartum luteal activity.
Acknowledgments
The authors thank the farm staff at the Nemoneh farm of Astan e Ghods for their kind cooperation. This study was financially supported by Grant no. 8611834 of the Iran National Science Foundation and the Center of Excellence for Research on High-producing Dairy Cows.