Introduction
Industrial vegetation management is a term that commonly refers to weed control or vegetation suppression on industrial sites including electric substations, transmission lines, tank farms, oil and gas wells, roadsides, railways, solar and wind farms, containment areas, and airports (Gover Reference Gover1997). This management approach is unique, because unlike the situation with crop land, the goal is to provide total vegetation control (TVC) for an entire growing season. Achieving season-long TVC is necessary on many industrial sites where vegetation can pose a major safety hazard, such as reducing visibility, impeding access to assets, or increasing fire risk (Milton et al. Reference Milton, Dean, Sielecki, van der Ree, Van der Ree, Smith and Grilo2015; Ramsay et al. Reference Ramsay, Colquhoun, Gordon, Maynard and Parker2004). Another critical aspect of implementing TVC is infrastructure maintenance along railways, paved roads, and utility pipelines, which cover over 6.5 million kilometers in the United States (CIA 2018).
Herbicides are the most commonly used tool for TVC, because they are cost-effective and time-efficient (Gianessi and Reigner Reference Gianessi and Reigner2007). Maintaining bare-ground (BG) for an entire growing season relies heavily on the use of soil-active herbicides that persist for at least 4 to 6 mo (Gover Reference Gover1997). Soil persistence depends on several factors, such as herbicide properties, soil characteristics, climatic conditions, and application timing (Furmidge and Osgerby Reference Furmidge and Osgerby1967). In climates with winter dormancy, TVC programs generally consist of spring herbicide applications, when new vegetation growth begins; however, fall-dormant applications have not been thoroughly investigated.
Herbicide options for TVC have been limited for several decades, because many herbicides that were developed for agricultural uses often lacked the persistence needed to provide BG for an entire growing season. With the stringent requirements of the Federal Insecticide, Fungicide, and Rodenticide Act (Finegan Reference Finegan1989) and the substantial cost to develop new pesticides, companies focused on product development for the more lucrative agriculture sector instead of the industrial-use market (Appleby Reference Appleby2005; Duke Reference Duke2012). Herbicides developed for agricultural crops have short soil persistence due to plant-back restrictions, commodity restrictions, and environmental concerns, which is a major reason these herbicides lack chemical properties to fit TVC programs.
Other challenges in developing herbicides for industrial applications have been the availability of generic herbicides that tend to drive down prices, and the introduction of genetically modified transgenic crops (e.g., RoundUp Ready™) (Ryan Reference Ryan2002). Many companies reduced herbicide discovery and development efforts as a result of glyphosate-resistant crops technology, because herbicides no longer generated sufficient profit from new-product development (Appleby Reference Appleby2005; Duke Reference Duke2012). Although no herbicide with a new mode of action has been introduced into the market in almost three decades, several new active ingredients have been brought to market in just the last decade (aminocyclopyrachlor, a plant growth regulator; indaziflam, a cellulose biosynthesis inhibitor; pyroxasulfone, a very-long-chain fatty acid synthesis inhibitor) (Duke Reference Duke2012). These newer active ingredients have not been extensively evaluated for either effectiveness or resistance management in TVC programs.
A Web of Science search for “industrial vegetation management,” “bare-ground herbicide,” and “total vegetation control” yielded only one peer-reviewed paper with herbicides for industrial applications, although the study focused solely on kochia [Bassia scoparia (L.) A. J. Scott] control and not TVC (Lloyd et al. Reference Lloyd, Johnson, Gover and Sellmer2011). For decades, TVC on industrial sites has consisted primarily of repeated applications of the same herbicides, because of the limited number of available herbicides having long-term residual activity. This management practice has significantly increased the number of herbicide resistance cases seen on industrial sites (Heap Reference Heap2014, Reference Heap2018; Norsworthy et al. Reference Norsworthy, Ward, Shaw, Llewellyn, Nichols, Webster, Bradley, Frisvold, Powles, Burgos, Witt and Barrett2012). The International Survey of Herbicide Resistant Weeds shows 34 resistance cases reported along railways and 66 cases of herbicide-resistant weeds found on roadsides (Heap Reference Heap2018).
Herbicides for TVC often include acetolactate synthase (ALS) inhibitors and/or photosystem II (PSII) inhibitors such as imazapyr, bromacil, and diuron (Lloyd et al. Reference Lloyd, Johnson, Gover and Sellmer2011). These two mechanisms of action constitute 47% of reported resistance cases worldwide (Heap Reference Heap2018). Herbicide resistance can be costly, with additional time and resources needed to control resistant populations; therefore, prevention is the best management strategy, and stewardship of current herbicide tools must be a priority for vegetation managers (Norsworthy et al. Reference Norsworthy, Ward, Shaw, Llewellyn, Nichols, Webster, Bradley, Frisvold, Powles, Burgos, Witt and Barrett2012).
Research has shown that using two effective mechanisms of action simultaneously on key weed species is a superior resistance management strategy compared to annual herbicide rotations (Beckie Reference Beckie2006; Beckie and Reboud Reference Beckie and Reboud2009; Evans et al. Reference Evans, Tranel, Hager, Schutte, Wu, Chatham and Davis2016). In a study by Evans et al. (Reference Evans, Tranel, Hager, Schutte, Wu, Chatham and Davis2016), modeling showed that tank-mixing would sustain the viability of two mechanisms of action 83 times longer than using a rotation in-season or between seasons. Herbicide mixing as a resistance management strategy is effective, because mixing decreases survival probabilities of resistance alleles; however, mixing only works if components of the mix are individually effective on the target weed species (Beckie Reference Beckie2006; Beckie and Rebound Reference Beckie and Reboud2009; Evans et al. Reference Evans, Tranel, Hager, Schutte, Wu, Chatham and Davis2016). Research on effective herbicide tank-mix combinations beyond ALS and PSII inhibitors for TVC are therefore crucial for resistance management.
Another common issue with many frequently used herbicides for TVC is off-target impacts. The combinations bromacil plus diuron (Krovar® I DF, AMVAC) and diuron plus imazapyr (Sahara® DG, BASF) have been used to achieve TVC for decades and are considered industry standard BG products. These products are applied at high use rates (average 11 kg ha–1 of product), which increases the potential for movement through drift, leaching, surface runoff, and soil movement (Baker and Mickelson Reference Baker and Mickelson1994; Russell et al. Reference Russell, Saladini and Lichtner2002). Runoff and leaching is heavily influenced by herbicide physical and chemical characteristics as well as soil characteristics (Baker and Mickelson Reference Baker and Mickelson1994). Several studies have detected commonly used industrial herbicides in surface and ground water near railways and roadsides, especially in rights-of-way where the soil is compacted and engineered to encourage water runoff (Moncada Reference Moncada2013; Ramwell et al. Reference Ramwell, Heather and Shepherd2002; Torstensson et al. Reference Torstensson, Cederlund, Börjesson and Stenström2002). Herbicides used at high rates require substantial space for product storage, as pesticides must be stored per label directions, which include a secure location and controlled temperatures (NPIC 2019). Transportation and product handling also become a safety hazard for applicators who must haul these large quantities to field sites, as the risk of physical injury, exposure, and spills increases (Damalas and Eleftherohorinos Reference Damalas and Eleftherohorinos2011). Additionally, mixing and handling diuron, an herbicide commonly used in TVC programs, requires a National Institute for Occupational Safety and Health–approved particulate filtering respirator (Anonymous 2010, 2018). Additional options that include lower use rate products with fewer nontarget impacts and reduce applicator exposure risk are highly desirable from an operational and safety perspective.
In the past two decades several new herbicides have been released and approved for use on industrial sites (Gerwick Reference Gerwick2010; Heap 2019); however, no published research has compared their efficacy to industry standards. The objectives of this research were (1) to identify the most effective herbicide tank-mix combinations for TVC with multiple mechanisms of action for resistance management, (2) to evaluate lower use rate alternatives to industry standards to minimize nontarget impacts, and (3) to determine efficacy of fall versus spring application timings.
Materials and Methods
Site Description
Field experiments were established at two locations in 2013 and three locations in 2014 along the Colorado Front Range. These five sites were separated by 1 to 60 km. Sites were selected based on high weed infestation with common target species for TVC in this region of the United States. Site location, elevation, weed species, and application dates are listed in Table 1. Sites 1 and 3 have calcareous gravelly alluvium, well-drained soils in the Altvan series (sandy skeletal, mixed, superactive, mesic Aridic Argiustolls) with 1.5% organic matter (OM). Site 2 has mixed alluvium, well-drained soils in the Connerton series (fine-loamy, mixed, mesic Torriorthentic Haplustolls) with 1.8% OM. Site 4 has alluvium, poorly drained soils in the Aquolls series with 1.8% OM; site 5 has alluvium, well-drained soils in the Loveland series (fine-loamy over sandy, mixed, mesic Fluvaquentic Haplaquolls) with 2% OM (USDA-NRCS 2014).
Weed species composition, treatment number, and application dates for five total vegetation control research sites along the Front Range of Colorado.

Mean annual precipitation based on the 30-yr average (1981 to 2010) was 361 mm at sites 1 and 3, 380 mm at site 2, 362 mm at site 4, and 400 mm at site 5 (Western Regional Climate Center 2018). In 2013, the year sites 1 and 2 were established, precipitation was close to the 30-yr average at site 1, whereas site 2 received an additional 96 mm above its 30-yr average. Sites 3, 4, and 5 were established in fall 2014. During that year sites 1, 2, 3, and 5 received an additional 49, 31, 49, and 39 mm of precipitation above their 30-yr averages, whereas site 4 was close to the 30-yr average (CoCoRaHS 2018). In 2015, all five sites received precipitation amounts above the 30-yr average: 107, 81, 107, 142, and 173 mm, respectively. A statewide drought occurred in 2016, with total precipitation for sites 1 to 5 decreasing 78, 145, 78, 47, and 88 mm below the 30-yr average, respectively (CoCoRaHS 2018). The 30-yr mean annual temperatures ranged from 8.7 to 9.4 C, and during 2013 and 2014 temperatures were close to average, whereas in 2015 and 2016 temperatures averaged 0.4 to 1.2 C warmer across the sites (Western Regional Climate Center 2018).
Experimental Design
The experimental design at all five sites was a randomized complete block arranged as a split plot with three or four replications. Main plots consisted of two application timings, fall and spring, whereas the split plots comprised the 25 or 34 herbicide treatments and a nontreated check. Herbicide treatments were applied to the split plots (3 by 6 m) within the fall and spring timings (Table 2). Application dates for each site are listed in Table 1. Sites 1, 2, and 3 had 25 treatments and a nontreated check, and sites 4 and 5 had these same 25 treatments and a nontreated check plus an additional 9 treatments. Herbicide tank-mix treatments were chosen based on experience and ideas presented by university experts (Colorado State University), county weed managers (Larimer County, CO), and industry vegetation management experts (Alligare, BASF, Bayer, Dow AgroSciences, DuPont). All treatments were applied with a CO2-pressurized backpack sprayer using 11002LP flat-fan nozzles calibrated to deliver 280 L ha–1. All herbicide treatments included glyphosate applied at 2.24 kg ae ha–1 as a POST tank-mix partner, except for treatments 7, 17, 29, and 35, which utilized saflufenacil as the POST tank-mix partner.
Application rates and herbicide mechanism of action of herbicide tank-mix treatments evaluated at five locations for total vegetation control.

a All treatments included 1% v/v methylated seed oil.
b All herbicide treatments included glyphosate applied at 2.24 kg ae ha–1 as a POST tank-mix partner, except for treatments 7, 17, 29, and 35, which utilized saflufenacil as the POST tank-mix partner.
Treatment Evaluation and Analysis
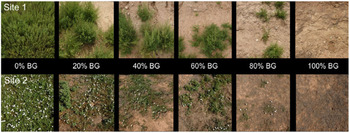
Percentage BG cover was visually evaluated in July 2014 for sites 1 and 2, and in July 2015 for sites 3, 4, and 5, approximately 9 and 4 mo after fall and spring application timings, respectively. Visual estimates were made across the entirety of the 3- by 6-m plot area. Visual ratings were used to standardize the data across five sites with differing vegetation, and the same researcher conducted the evaluations at all sites. Figure 1 shows examples of 0, 20%, 40%, 60%, 80%, and 100% BG at sites 1 and 2. Plots received a number from 0 to 100% BG. Treatments were then compared in terms of percent BG for analysis. Based on the visual percent BG evaluations, the proportion of plots (n = 36) with no vegetation (100% BG) and the proportion of plots (n = 36) with <3% vegetation cover (97% BG) were calculated for each of the 25 treatments that occurred at all five sites. Analyses based on classification of plots into these categories were done to create a probability model. The analyses of 100% and 97% BG are also consistent with the experimental objective of comparing treatments with respect to their ability to provide total control of all vegetation on a site.
Example of visual percent bare-ground (BG) ratings at 0, 20%, 40%, 60%, 80%, and 100% at site 1 (top) and site 2 (bottom). Photos show a portion of the plot, although evaluations were based on the entire 3- by 6-m plot.

The analysis of BG was performed using a mixed model to account for the nested structure of the experiment. Site, timing, and treatment were considered fixed effects. The variation of blocks within site and variation of timing within site and block were incorporated as random effects. The arcsin-sqrt (Schabenberger and Pierce Reference Schabenberger and Pierce2002) transformation of proportion BG was used to satisfy normality assumptions.
A combined analysis of BG across all sites was performed for the 26 treatments included on all five sites using PROC GLIMMIX feature of SAS® v. 9.4 software (SAS Institute, Cary, NC). Models were fit that grouped covariances by site, timing, and both site and timing to test if a variance was homogeneous across studies. These were compared to each other and to the common variance model using Akaike’s information criteria (AIC). The model that grouped covariance by site and timing performed best with respect to AIC. In addition, there was a significant site-by-treatment interaction (P < 0.001) and a significant site-by-timing interaction (P = 0.011) that indicated that both timing and treatments require comparison at the site level. A separate analysis was then performed for sites 1, 2, and 3 (26 treatments) and sites 4 and 5 (35 treatments). The grouping of covariances by site and timing also performed best for these two combined analyses based on AIC. The use of these two analyses to accommodate differences in the number of treatments using the site–timing grouped error structure was adopted for the final analysis of BG.
A generalized linear model approach estimated the probability of a plot having either no vegetation (100% BG) or <3% (97% BG) vegetation cover based on site, timing, and treatment (Supplementary Table S1). The linear predictor part of the model consists of the fixed design factors of site, site-by-timing interaction, timing, and treatment. The variation of blocks within site was treated as a random effect to account for grouping of observations on sites. Analysis was performed using the PROC GLIMMIX procedure (Littell et al. Reference Littell, Milliken, Stroup, Wolfinger and Schabenberger2006) assuming a binomial distribution for the proportion of favorable responses. Models were fit using only the 25 treatments common to all five studies (nontreated was excluded, because no nontreated plots ever had <3% cover). Treatment 30 was excluded from the (97% BG) analysis, because cover was <3% on all 36 plots receiving this treatment. The additional nine treatments at sites 4 and 5 were not included in this analysis, because the limited sample did not allow meaningful estimates using this methodology.
Results and Discussion
In the combined analyses of sites 1 to 3 and sites 4 and 5, treatments performed significantly differently by site in terms of percent BG achieved (site by treatment, P < 0.001, Table 3). For sites 1 to 3, percent BG was also influenced by application timing (fall or spring) (P = 0.002), whereas at sites 4 and 5 percent BG was influenced by the interaction of timing and site (P = 0.003) (Table 3). Variability in treatment performance by site and application timing was most likely due to a combination of factors, such as weed spectrum, year of application, and precipitation fluctuations/timing. Because site influenced treatment performance (site by treatment, P < 0.001) but there were no significant interactions between timing and treatment (Table 3), treatment and timing effects were then tested by site (Table 4). At all five sites, difference occurred among treatments in the amount of BG achieved, whereas application timing had a significant effect on percent BG at four out of five sites (Table 4).
ANOVA of percent bare-ground as performed by site groupings based on number of treatments included (35 for sites 1, 2, and 3; 26 for sites 4 and 5).a

a Values in boldface indicate significant differences. See text discussion.
Tests of treatment and timing (fall vs. spring) effects by site for analysis of percent bare-ground.

a Abbreviation: Prob, probability.
The mean percent BG for each treatment at each site is compared in Table 5. Seven treatments were in the top ranking at all five sites (treatments 30, 31, 33, 32, 2, 22, and 27), and had an average of 94.4 ± 1.2% (mean ± SE) BG (Table 5). Four of these seven treatments were combinations that included aminocyclopyrachlor, chlorsulfuron, and indaziflam (treatments 30, 31, 33, and 32), averaging 97 ± 0.6% BG across all five sites. One industry standard, diuron plus imazapyr, was among the top-ranking treatments (treatment 2), with an average 95.2 ± 4.3% BG. The other industry standard, bromacil plus diuron, performed inconsistently, with an average of 98.5 ± 3.3% BG at sites 1, 3, and 5, and only 25.1 ± 8.2% BG at sites 2 and 4. Most other treatments outside of the top-ranking treatments also had variable results by site. This is most likely due to differences in species composition, with some sites dominated more by annuals and others by perennials [primarily field bindweed (Convolvulus arvensis L.)], along with rainfall timing relative to application timing.
Comparison of visual percent bare-ground ratings by treatment for five sites along the Front Range of Colorado.a–c

a Treatment evaluations were conducted 9 (fall application) and 4 (spring application) mo after treatment; timings were combined for analysis.
b All herbicide treatments included glyphosate at 2.24 kg ae ha–1, except for treatments 7, 17, 29, and 35.
c Means followed by the same letter are not significantly different at the 5% level using Tukey-Kramer adjustment for multiplicity.
d Asterisk denotes that treatment was in the top ranking (followed by an “a”) at all five sites.
Application timing (fall or spring) affected herbicide performance. At sites 1, 2, and 4, herbicide treatments performed better overall when applied in the fall as compared to spring applications (Table 6, Figure 2). At site 3 there were no differences between the two timings, and at site 5 the spring timing performed better than the fall timing (Table 6). Site 3 was applied in a different year from sites 1 and 2, whereas site 5 contained a single annual weed (kochia). These differences could contribute to the variation in timing effects when compared to the other three sites.
Comparison of percent bare-ground averaged across treatments by application timing for each site.a

a Means followed by the same letter are not significantly different at the 5% level.
Comparing bare-ground efficacy of fall versus spring application timings at sites 1 and 2.

Because treatment performance had been analyzed at several sites and over different years, predicted probabilities of treatments providing 100% BG (no vegetation cover) or 97% BG (<3% vegetation cover) were calculated. The predicted probabilities table orders the treatments from the highest probability of providing 100% BG and 97% BG down to the lowest probability (Table 7). The model predicts that the five treatments with the highest probability of providing 100% BG and 97% BG were 30, 32, 31, 2, and 33, respectively (Table 7). These same five treatments were also identified as top-ranking treatments in the means comparison (Table 5). Based on the probability model, it is predicted that these five treatments have an 80% or greater probability of providing 97% BG and a 63% or greater probability of achieving 100% BG (Table 8). Treatment 30 (combination of aminocyclopyrachlor, chlorsulfuron, indaziflam, and imazapyr) had the greatest predicted probability (88%) of achieving 100% BG. Differences in spring versus fall applications in the predicted probability of providing 100% BG and 97% BG were then compared, averaged over all treatment means. The model predicted that fall applications had a higher probability of providing 100% BG at sites 1 and 2 and 97% BG at sites 1, 2, and 4 (Table 8, Figure 1). No differences were predicted in the probability of BG due to application timing at sites 3 and 5 (Table 8). This coincides with the results from treatment means averaged by timing, in which the fall timing application resulted in more BG than the spring timing application at sites 1, 2, and 4 (Table 4). These predicted probabilities provide another way to assess treatment efficacy, although it should be noted that the model does not consider resistance occurrence.
Comparison of predicted probabilities (Prob) of treated plots having no cover [100% bare-ground (BG)] or <3% cover (97% BG), for treatments included at all five sites.a, b

a Conditional probabilities followed by the same letter are not significantly different at the 5% level using Tukey-Kramer adjustment for multiplicity.
b The actual experiment-wide proportion (Actual) of plots for each category and the lower and upper 95% confidence limit of the predicted probabilities are also provided.
c Number of plots sampled per treatment.
d Treatment 30 was not included in the 97% BG analysis, because all plots had <3% cover for this treatment.
e Nontreated check (treatment 1) was not included in the analysis, because there were no plots with <3% cover for this treatment.
Comparison of predicted probabilities (Prob) of treated plots having no cover [100% bare-ground (BG)] or <3% cover (97% BG) by study site and application timing.a, b

a Fall and Spring average predicted probabilities for each site are not significantly different at the 5% level if followed by the same letter.
b The lower and upper 95% confidence limit of the predicted probabilities are also provided.
c Number of plots included per timing for 100% BG/97% BG.
This is the most comprehensive research study comparing herbicides for TVC across multiple sites. Our results have major implications for TVC in semi-arid western regions. There is a lack of published research in this area, and as herbicide resistance and nontarget impacts become more of a concern, continued research on TVC herbicides is important. Our analysis identified seven top-ranking treatments (30, 31, 33, 32, 2, 22, and 27) out of 35 treatments that performed consistently across five sites and multiple application years. The best treatments in the study were reliable in providing BG across varying weed species, application timings, and weather conditions. For example, treatment 30 (aminocyclopyrachlor, chlorsulfuron, indaziflam, and imazapyr) had no more than 3% vegetation cover across five sites at both application timings. This consistency gives applicators working in similar semi-arid climates a treatment option that would perform well under a variety of conditions and weed species compositions.
The suite of weed species present at each site also affected treatment performance. Many treatments that were evaluated, such as the industry standard diuron plus bromacil, provided near 100% BG in some sites but failed to provide an acceptable level of BG at other sites. We attributed these differences to sites dominated by annuals [kochia, Russian thistle (Salsola tragus L.), downy brome (Bromus tectorum L.), prickly lettuce (Lactuca serriola L.)] compared to those sites that also included perennial species [Canada thistle (Cirsium arvense (L.) Scop.), field bindweed], as some treatments performed better overall at sites dominated by annuals. The top treatments in our study provided consistent TVC regardless of weed species composition.
The top treatments were combinations of products that provided prolonged residual control and targeted both broadleaf and grass species, as well as annuals and perennials. Six out of the top seven ranked treatments contained aminocyclopyrachlor and chlorsulfuron, herbicides with both foliar and soil activity that primarily target broadleaf weeds (Sebastian et al. Reference Sebastian, Fleming, Patterson, Sebastian and Nissen2017a). Four of the top seven treatments also included indaziflam, a PRE herbicide with broad-spectrum activity on both grass and broadleaf seeds (Brosnan et al. Reference Brosnan, McCullough and Breeden2011; Sebastian et al. Reference Sebastian, Fleming, Patterson, Sebastian and Nissen2017a). The treatment that had the highest percentage of BG (treatment 30) included these herbicides along with imazapyr, a nonselective herbicide with PRE and POST activity (Vizantinopoulos and Lolos Reference Vizantinopoulos and Lolos1994).
An important finding in this study was that fall applications generally resulted in a significantly higher percentage of BG compared to spring applications when averaged across all treatments. One potential reason for treatments performing better with fall applications is that many herbicides used for TVC are soil residual compounds that need sufficient moisture for activation (Walker Reference Walker1971). In climates characterized by winter dormancy, when soil residual herbicides are applied in the fall there is a higher likelihood of moisture throughout the winter months to incorporate and activate herbicides before weeds germinate in spring. However, when these herbicides are applied in the spring or early summer, adequate moisture is unpredictable and may not occur in a timely manner for herbicide activation to prevent weed germination and establishment, resulting in escapes (Sebastian et al. Reference Sebastian, Nissen, Westra, Shaner and Butters2017b). Additionally, decreases in herbicide efficacy often occur through light and/or microbial degradation in the spring and summer months when soil temperatures increase. Although fall treatments are applied several months before spring treatments, cooler soil temperatures in the fall/winter reduce the rate of microbial degradation. For applicators, switching to fall applications could result in more successful TVC programs, especially in areas where rainfall patterns are highly variable. From an operational perspective, this may also provide an opportunity to shift spring treatments into the fall, resulting in time savings for land managers in the spring and summer months.
A search of the International Survey of Herbicide Resistant Weeds website illustrates the impact of relying on just two mechanisms of action for TVC along railroads and roadsides (Heap Reference Heap2018). The first confirmed cases of PSII-inhibitor resistance along railroads and roadsides began to appear in the late 1970s and early 1980s, whereas ALS-inhibitor resistance was first reported in the mid to late 1980s (Heap Reference Heap2018). The selection pressure exerted by the repeated use of PSII- and ALS-inhibiting herbicides resulted in widespread resistance along these transportation corridors. For railroad rights-of-way, 73% of all resistance cases were reported before 1995 (first release of RoundUp Ready™ crops), and 80% of those unique cases were limited to PSII- and ALS-inhibiting herbicides (Heap Reference Heap2018). Herbicide-resistant weeds along roadsides showed a similar pattern. Starting in the late 2000s, ever more cases of glyphosate-resistant weeds were reported along railroads and roadsides (Heap Reference Heap2014, Reference Heap2018) possibly resulting from movement from cropping systems to noncrop areas. Herbicide use patterns for both crop and noncrop areas have contributed to the selection of herbicide resistance weed biotypes; however, transportation corridors (railroads, roads) exacerbate the spread of these herbicide-resistant weeds (Lemke et al. Reference Lemke, Kowarik and von der Lippe2019).
As resistance cases increase in both noncrop and crop applications, new mechanisms of action must be utilized. This is especially critical for herbicide-resistant kochia management, as most kochia has evolved resistance to at least one mechanism of action (Kumar et al. Reference Kumar, Jha, Jugulam, Yadav and Stahlman2019). Several top-ranking treatments in this study consisted of tank-mix combinations of three to four different mechanisms of action plus glyphosate, with at least two mechanisms of action targeting kochia. As discussed previously, tank-mixing multiple mechanisms of action that are still effective will help to minimize the selection pressure for herbicide resistance and prolong the commercial life of these products. This tank-mix approach can help to prolong the life of tools such as indaziflam, a cellulose biosynthesis inhibitor with no reported resistance cases (Tateno et al. Reference Tateno, Brabham and DeBolt2016). The tank-mixes evaluated in this study provided a research-based approach to comparing industry standards to a wide range of other management options. Some of these options provided more consistent control over the variable environments found in semi-arid regions when compared to industry standards.
These results will be beneficial for land managers in semi-arid regions of the United States, who are required to establish and maintain BG for an entire growing season. Because TVC is not a one-treatment-fits-all approach, applicators need to consider tank-mix combinations based on the weeds present at a specific site. When applying over large areas, where many different weed species will be encountered, the top performers in this study are viable tank-mix options for applicators and provide the most robust TVC across a wide range of weed species composition in semi-arid western climates. We identified strategies to improve the effectiveness of TVC through effective herbicide tank-mixes with improved resistance management. Incorporating newer mechanisms of action with a fall application timing could improve TVC across a range of environments in western states.
Acknowledgments
This research was funded by Alligare LLC., Bayer CropScience LP, BASF, and Corteva Agriscience. The authors would also like to express appreciation to Jim Sebastian, Bobby Goeman, and Tim D’Amato for their assistance locating research sites and installing treatments. No conflicts of interest have been declared.
Supplementary Material
To view supplementary material for this article, please visit https://doi.org/10.1017/wet.2019.94