




No CrossRef data available.
Article contents
Cerebral volume loss, cognitive deficit and neuropsychological performance: Comparative measures of brain atrophy: I. Dementia
Published online by Cambridge University Press: 01 May 2004
Abstract
There are several magnetic resonance (MR) imaging methods to measure brain volume and cerebral atrophy; however, the best measure for examining potential relationships between such measures and neuropsychological performance has not been established. Relationships between seven measures of MR derived brain volume or indices of atrophy and neuropsychological performance in the elderly subjects of the population-based Cache County, Utah Study of Aging and Memory (n = 195) were evaluated. The seven MR measures included uncorrected total brain volume (TBV), TBV corrected by total intracranial volume (TICV), TBV corrected by the ratio of the individuals TICV by group TICV (TBVC), a ventricle-to-brain ratio (VBR), total ventricular volume (TVV), TVV corrected by TICV, and a measure of parenchymal volume loss. The cases from the Cache County Study were comprised of elderly individuals classified into one of four subject groups based on a consensus diagnostic process, independent of quantitative MR imaging findings. The groups included subjects with Alzheimer's disease (AD, n = 85), no dementia but mild/ambiguous (M/A) deficits (n = 30), a group of subjects with non-AD dementia or neuropsychiatric disorder including vascular dementia (n = 60), and control subjects (n = 20). Neuropsychological performance was based on the Mini-Mental Status Exam (MMSE) and an expanded neuropsychological test battery (consortium to establish a registry for Alzheimer's disease (CERAD). The results demonstrated that the various quantitative MR measures were highly interrelated and no single measure was statistically superior. However, TBVC, TBV/TICV and VBR consistently exhibited the more robust relationships with neuropsychological performance. These results suggest that a single corrected brain volume measure or index is sufficient in studies examining global MR indicators of cerebral atrophy in relation to cognitive function and recommends use of either TBVC, TBV/TICV, or VBR. (JINS, 2004, 10, 442–452.)
Information
- Type
- Research Article
- Information
- Journal of the International Neuropsychological Society , Volume 10 , Issue 3 , May 2004 , pp. 442 - 452
- Copyright
- © 2004 The International Neuropsychological Society
INTRODUCTION
Numerous factors influence brain volume including age, sex, disease, and injury, as well as the physical and genetic characteristics of head and body size (Bigler & Tate, 2001). How these variables are addressed influences the relationships found between quantitative magnetic resonance (MR) imaging and neuropsychological performance. With current quantification techniques, measurement of brain volume has become relatively straightforward and is usually based on the sum of total brain parenchymal volume determined by pixel counts within a region of interest (ROI) multiplied by slice thickness and gap between slices (Atkins & Mackiewich, 2000; Robb, 1995b; Schultz & Chakraborty, 1996). As a measure of cerebral atrophy, reduced brain volume generally is negatively associated with cognitive performance (Bigler et al., 2000; Gur et al., 2000), but it remains unclear whether there is a preferred method to measure atrophy or correct for head-size/brain size differences when investigating neuropsychological correlates. Correction procedures are often necessary due to inter-subject variability in body and head size as well as significant sex differences in brain volume (Dekaban & Sadowsky, 1978). In the past, discussions about measurement technique occupied considerable attention in quantitative neuroimaging research for understandable reasons (Arndt et al., 1991; Mathalon et al., 1993, 1994; Pfefferbaum et al., 1990; Raz et al., 1988b), as measurement error and variability remain the bane of quantitative neuroimaging studies (Jack et al., 1995; Lancaster et al., 2000). Accordingly, establishing a relationship between quantitative imaging findings and neuropsychological performance is partially dependent on the method chosen to quantify the volume of the brain, measure atrophy, or correct for head size differences. Because of the importance of minimizing measurement error as well as the central role that brain volume measurements have in understanding a number of disorders and cognitive conditions (Jack et al., 1999; Killiany et al., 2000; Smith et al., 2000; Xu et al., 2000) we revisit these issues in the Cache County population-based study of Aging and Memory (see Breitner et al., 1999).
Methods of Brain Volume Measurement and Head-Size Correction (see Table 1)
In degenerative disease the typical measure of brain volume is usually represented as total parenchymal brain volume adjusted in some fashion for head size by total intracranial volume (TICV; Cahn et al., 1998; Fama et al., 2000; Forstl et al., 1996; Jack et al., 1998; Killiany et al., 2000; Shear et al., 1995; Tanabe et al., 1997; Wilson et al., 1996), which can also serve as the basis for an estimate of premorbid brain volume (Bigler, 2001; Jenkins et al., 2000). Total brain volume (TBV) corrected in this manner has been shown to reliably relate to cognitive performance in a number of domains, particularly memory and executive function (Cahn et al., 1998; Wilson et al., 1996). Blatter et al. (1995) argued that head size corrected in this manner should also be normalized to the control population which can be easily accomplished by dividing the individual's intracranial volume (TICVi) by the group's average intracranial volume (TICVg). This results in a corrected TBV or TBVC.
Formulas for calculating the various methods for quantification of brain atrophy

The earliest measure of whole brain atrophy was the ventricle-to-brain ratio (VBR), which originated in the era of pneumoencephalography (Haug, 1962). However, VBR corrects for brain mass but does not directly adjust for actual cranial size difference and on these grounds has been criticized as potentially inaccurately portraying cerebral atrophy (Arndt et al., 1991; Raz et al., 1988a, 1988b). Much of this criticism stems from the original planimetric method, which used the ratio determined from a single slice formed by anterior horn width divided by brain width in the same plane. However, it should be pointed out that current VBR methods use whole brain ventricular volume divided by brain volume rather than using a single slice VBR technique. Using the current whole brain/ventricular volume VBR measure relates to a broad spectrum of cognitive performance, where increased VBR is associated with worse neuropsychological performance (Bigler et al., 2000). Ventricular volume can also be divided by TICV, creating a ventricle-to-cranial ratio (VCR). However, one of the reasons why the VBR measure may be such a sensitive index of atrophy is that the VBR captures both the expansion of the ventricular system in response to injury or disease and decreased brain volume (Bigler et al., 2000); whereas VCR only reflects changes in ventricular size. Whether the VBR or VCR is used, any parenchymal volume loss results in passive expansion of the ventricle, or hydrocephalus ex vacuo (Bradley & Orrison, 2000). Since the ventricular volume constitutes the numerator and the decreasing brain volume the denominator, increasing VBR reflects atrophy, because in the ex vacuo state enlarged ventricular space occurs only in proportion to dissolute brain parenchyma. Thus, in atrophic states, VBR dynamically reflects both brain atrophy and ventricular expansion. In contrast, different processes may selectively influence ventricular expansion and therefore VCR may potentially capture different aspects of degenerative processes than VBR. For example, ventricular expansion may be more susceptible to subcortical and white matter pathology (Gale et al., 1995).
We also introduce a method for estimating parenchymal volume loss (PVL). This is based on the assumption that in the normal individual TICV represents an index of maximal brain volume reached in adolescence–young adulthood (Bigler, 2001). The rationale for this assumption comes from developmental studies that demonstrate brain volume drives intracranial volume and that TICV is fixed by late childhood–adolescence (Blinkov & Glezer, 1968; Courchesne et al., 2000; Nellhaus, 1968; Peterson et al., 2000; Reiss et al., 1996). This stability provides a unique opportunity to estimate premorbid brain size because the only other intracranial contents are the non-neural structures of meninges, blood vessels and their contents, and cerebral spinal fluid (CSF; Matsumae et al., 1996). In terms of the volume occupied by the non-neural intracranial contents, Blatter et al. (1995) demonstrated that whole brain CSF was approximately 85 cm3 for male subjects and 90 cm3 for female subjects at maturity (age 16–25), which is similar to what others have reported (Cherniak, 1990). Although it may be an oversimplification, an estimate of original (or maximal) brain volume between the ages of 16 and 25 is TICV minus the CSF constant reported above for males and females. Although imaging techniques exist for computing vascular and meningeal volumes, they are not practical in standard imaging protocols. Furthermore, some of the vascular contents often segment as CSF and thus the total CSF volume at maturity (ages 16–25) may provide the best estimate to account for non-neural intracranial contents. Once the original brain volume is estimated, simply subtracting current brain volume from the original brain volume estimate gives the amount of parenchymal tissue lost. Similarly, subtracting the CSF constant at maturity from current CSF yields the CSF increase due to parenchymal loss.
The above correction procedures incorporate methods to adjust for head size prior to statistical analysis. Others have suggested that ratios and direct correction factors should be avoided and that variability due to head size should be addressed statistically (e.g., a covariate or the regression methods discussed below; Kidron et al., 1997; Mathalon et al., 1993; Schlaepfer et al., 1995). However, these statistical correction procedures may raise their own set of concerns (Pfefferbaum et al., 1990) and are complicated by the fact that there is a significant positive correlation between measures of a brain structure of interest and all other brain structures or regions (Finlay & Darlington, 1995; Thompson et al., 2001a, 2001b). Furthermore, in cases where the issue of cerebral reserve is under investigation (Bigler, 2001) the absolute and not relative size of a given neural structure may be crucial.
The Cache County Memory and Aging Study
In 1994 a comprehensive, population-based study of aging and dementia was initiated in Cache County, Utah the most northeastern county of the state that involved screening approximately 6,000 individuals (see Breitner et al., 1999). As part of the clinical assessment neuroimaging was sought for most patients with suspected dementia or those who displayed other cognitive or neuropsychiatric disorders. Following a consensus diagnostic process, patients were diagnosed and classified by four general categories as either having (1) Alzheimer's disease (AD); (2) non-AD dementia such as vascular dementia (VaD) or diagnosable neuropsychiatric disorders hereafter referred to as the mixed neuropsychiatric group; (3) subjects who met none of the above classifications but nonetheless displayed some cognitive deficit classified as mild/ambiguous (M/A, see Breitner et al., 1999); and (4) a group of normal controls. Subjects within the M/A classification have been considered to be at risk for developing dementia, and some of these subjects undoubtedly had what is now considered to be mild cognitive impairment (MCI; Peterson et al., 2001). For the purposes of this study, these subjects will be labeled MA/MCI. As part of the clinical assessment all subjects received a battery of cognitive tests including the Mini-Mental Status Exam (MMSE; Folstein et al., 1975) and an expanded version of the Consortium to Establish a Registry for Alzheimer's Disease (CERAD; Welsh et al., 1994), to more completely assess potential areas of cognitive impairment not covered by the original CERAD battery (Tschanz et al., 2000). In this sample, collapsing the four diagnostic groups into a single group including control subjects we compared the correlations between each brain measure, as indicated in Table 1, to neuropsychological performance. By performing such comparisons, the objective of this study was to determine the relative effectiveness of individual MR morphometric measures to relate to cognitive performance on a battery of neuropsychological tests and whether one quantitative measure was superior. By having a continuum of clinical cases (severe dementia to mild impairment) combined with a control group insured that there would be full representation of cognitive performance and levels of cerebral atrophy (see Bigler et al., 2003).
METHODS
Subject demographics are shown in Table 2. The clinical characteristics of the dementia subjects have been published in detail elsewhere (Bigler et al., 2000, 2002a; Breitner et al., 1999; Tschanz et al., 2000). Briefly, through a screening followed by a consensus diagnostic approach, nearly 6,000 individuals 65 and older residing in Cache County, Utah were evaluated (see Breitner et al., 1999; Tschanz et al., 2000) and the majority of cases of dementia identified. The process began by identifying through various types of public documents and advertisements all individuals 65 and older in the county. Next, through either a telephone interview process or face-to-face contact with county residents (see Breitner et al., 1999; Norton et al., 1999), 1,029 with potential cognitive symptoms were identified, as well as a stratified sample of others (N = 960), and all were further examined with a comprehensive clinical assessment (CA) for detection and a differential diagnosis of dementia . Three hundred and thirty-five individuals with dementia and 42 not meeting criteria for dementia but classified as M/A subjects constituted the sample for which imaging studies were sought. Of these 377 Cache County subjects, 195 received MR imaging with sufficient quality to perform quantitative analysis and the clinical groups consisted of AD, a combined group of vascular dementia (VaD) and/or mixed neuropsychiatric disorder subjects (i.e., subjects with Parkinson's disease, frontotemporal dementia, Lewy Body dementia, alcoholism, etc.) and MA/MCI subjects. Diagnostic classification was established independent of quantitative neuroimaging data and was based on a consensus diagnostic method outlined by Breitner et al. (1999). A control sample of 20 individuals was also recruited and underwent identical neuroimaging studies. The mean educational level for all imaging subjects in the Cache County group was 12.91 (SD = 2.78).
Cache County subject demographics

Neuroimaging
MR imaging was performed on a 0.5 Tesla Philips scanner following a standard protocol as detailed elsewhere (Bigler et al., 2000). Quantitative analyses were performed using image analysis protocols previously published with scan parameters as follows: Sagittal scans were T1-weighted (500/15/2; TR/TE/excitations), with an acquisition matrix of 256 × 256, a field of view of 24 cm, and a section thickness of 5 mm with a 1 mm gap. Axial intermediate (proton density-weighted) and T2-weighted spin-echo images were acquired with parameters of 3148/31; 90/1, respectively, a field of view of 22 cm, an acquisition matrix of 256 × 256, and a section thickness of 5 mm with a 1.5 mm gap. Coronal images obtained with a dual spin-echo technique (3046/30; 90/1) were 3 mm thick with a 0.3 mm gap, a 22 cm field of view, and a matrix of 256 × 240. We calculated total gray and white matter volumes, whole brain volume, ventricular volumes (lateral, III & IV) a ventricle-to-brain ratio (VBR, total ventricular volume divided by total brain volume × 100) and a ventricle-to-cranial ratio (VCR, total ventricular volume divided by TICV).
Quantitative MR Measurements
As previously introduced, seven quantitative measures of brain volume or cerebral atrophy were used, as described in Table 1. Each measure used either one or a combination of TICV, TBV, whole brain CSF, and ventricular volume data that had already been established as part of the Cache County Study (Bigler et al., 2000, 2002b, 2003). TICV was determined by total brain plus CSF volume, where the inner table of the skull was the outer boundary of the segmented image and whole brain volume was the sum of white and gray matter pixels based on the ANALYZE® k-nearest neighbor routine (Robb, 1995a, 2001). Also using the k-nearest neighbor routine, ventricular CSF was identified and volumes of the lateral, third and fourth ventricles determined to calculate total ventricular volume. Each rater was blind to diagnosis and achieved inter-rater reliability rates of .9 or higher.
Neuropsychological Measurements
The CERAD neuropsychological battery has been fully described elsewhere (Welsh et al., 1994) and its explicit use in the Cache County population as an expanded battery has been reported by Tschanz et al. (2000). All subjects were administered the CERAD neuropsychological battery (Welsh et al., 1994) which includes measures of mental status/orientation (MMSE), language (naming, animal fluency), memory (Word List Memory Test), and constructional praxis. This battery was supplemented with additional common neuropsychological tests to augment the assessment of immediate memory (Logical Memory I of the Wechsler Memory Scale–Revised, Benton Visual Retention Test), delayed memory (Logical Memory II, recall of the constructional praxis figures), language (Controlled Oral Word Association Test from the Multilingual Aphasia Examination), processing speed/executive functions (Trails A & B; Symbol Digit Modalities Test, SDMT), and intelligence (Shipley Vocabulary Test). Not all patients were able to complete all aspects of the expanded CERAD battery. In addition, the Mini Mental Status Exam was administered to all subjects (Folstein et al., 1975).
Statistical Methods
The Pearson correlation coefficient was used to assess the relationship between each of the seven brain volume/atrophy measures and performance in each of the neuropsychological domains. The z-scores of the neuropsychological tests were standardized based on age and gender characteristics where possible. A chi-square test for comparing more than two correlation coefficients was used to assess the differences (Zar, 1996, p. 384).
Each of the seven measures of atrophy was ranked within each of the neuropsychological tests according to the strength of the correlation coefficient. The atrophy measure with the strongest correlation for a given test was given a ranking of 7, while the weakest correlation received a ranking of 1. A Friedman Test (Conover, 1999, pp. 369–371) was used to assess differences in the ranking for each measure. The Friedman test is a nonparametric procedure designed to analyze ranks. It tests the equality of median ranks for each atrophy measure. Also, each measure was paired with each other in order to statistically test whether the correlations for each neuroimaging measure significantly differed when directly compared.
Finally we used the recommendations of Mathalon et al. (1993, 1994) to explore whether their method of using regression modeling to statistically correct for head size variability resulted in different or more salient correlations. Because of the number of potential measures and neuropsychological variables under investigation, we simplified the reporting of the findings using the Mathalon et al. (1993, 1994) method to just the parenchymal volume loss (PVL) measure. The reason for only selecting this measure was because, as it will be shown, PVL was consistently sensitive to neuropsychological performance in this aging, clinical population. More importantly, for the Mathalon et al. (1993, 1994) method PVL can be treated as a specific ROI and using values from the normal controls, a regression line can be calculated that can predict PVL, given a subjects' particular head size or total intracranial volume (TICV) where the regression line equation is PVL = β0 + β1[TICV]; where β0 is the y-intercept and β1 is the slope coefficient. From the Cache County neuroimaging data set, using the y-intercept (β0 = 404.623) and slope (β1 = 0.394) coefficients generated, residuals can then be calculated for the entire sample by simply subtracting the observed PVL value from the estimated or fitted value. Pearson correlations can then be investigated to determine the relationships between the various neuropsychological variables and this “head-size-residual” score of Mathalon et al. (1993, 1994). In the current study the aim of performing the residual comparisons was to determine if it provided a better method for examining neuroimaging measures of brain volume, than the other methods of correcting for head size.
RESULTS
Interrelationships of Brain Morphometry Measures
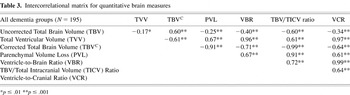
In general, regardless of the brain volume/atrophy correction procedure (or no correction) used, all quantitative measures were highly interrelated (see Table 3).
Intercorrelational matrix for quantitative brain measures

Comparison of Brain Morphometry Measures with Neuropsychological Tests
For clarity of presentation, Figure 1 simultaneously depicts all correlations, regardless of sign, between brain morphometry measures and the expanded CERAD battery of neuropsychological tests including domains of neuropsychological function. As apparent in Figure 1, correlations were similar across the various morphometric measures for each neuropsychological test administered. Chi-square analysis demonstrated that there were no significant differences between correlations of a given neuropsychological test and the different quantitative measures. In other words, in terms of the magnitude of the correlation, one quantitative measure was not statistically superior to another in relating to neuropsychological function.

This figure depicts correlations of the various quantitative magnetic resonance (MR) measures in comparison with individual neuropsychological test performance for all subjects in the Cache County Study. Each individual neuropsychological measure is listed on the x-axis with each quantitative neuroimaging procedure represented in a color-coded symbol as indicated in the legend on the right (y-axis). Note that in the majority of the cases total brain volume-corrected (TBVC; golden line), the ratio formed by total brain volume/total intracranial volume (TBV/TICV) and the ventricle-to-brain ratio (VBR) measure yielded the highest correlations. The golden line was added to enhance the identification of the VBR showing that in most cases it represented correlations with neuropsychological tests that were highest. Note that correlations are given in absolute terms. Lastly, even though the TBVC or TBV as a ratio to TICV yielded the highest correlations, the magnitude of difference across the different measures was often minimal and always insignificant. Domains of neuropsychological function are given in color and capitalized as underlined headings. Each domain was based on the average z-score of the summed individual tests that made up each domain, except the constructional praxis task of the Consortium to Establish a Registry for Alzheimer's Disease (CERAD) battery, which was the only task for the VISUOSPATIAL Domain and the Shipley IQ for the INTELLIGENCE Domain.
However, it is also evident from the correlation coefficients in Figure 1 that some of the atrophy measures (e.g., TBVC and TBV/TICV and VBR) consistently yielded higher coefficients than the other atrophy measures (see orange line in Figure 1). The Friedman test of rank comparisons was highly significant (p < .001), indicating that atrophy measures have significantly different median ranks from each other (see Table 4). This further indicates that several of the atrophy measures consistently had stronger correlations than the others. For example, TBVC was the strongest correlation in 11 out of the 15 tests and it was shown to have the strongest correlation with more neuropsychological tests than all the atrophy measures except for TBV/TICV.
Comparison of residualized measures with parenchymal volume loss (PVL) corrected and uncorrected

TBV/TICV was either the strongest or the second strongest also in 11 out of the 15 tests (the strongest in one and second strongest in 10). It was shown to have stronger correlations in more tests than all atrophy measures except for TBVC. VBR was ranked consistently higher than the remaining four atrophy measures. Total ventricular volume (uncorrected) had consistently weaker correlations than all other atrophy measures.
Residualized Measures and Correction for Head Size
Using the model outlined by Mathalon et al. (1993, 1994), TICV was regressed onto parenchymal volume loss to remove the influence of head size from this particular ROI (see Table 4). As can be seen, the regression method performed slightly better with respect to the magnitude of the correlation with neuropsychological performance than the parenchymal volume loss measure or correction performed statistically for parenchymal volume loss.
“Best” Measure of a Single Atrophy Measure
Concerning whether there is a “best” measure for defining cortical atrophy there are several limitations to this type of analysis. When using a chi-square test for each of the nineteen neuropsychological tests across seven brain variables, after adjusting the level of significance for multiple tests, it is nearly impossible to detect potential significant differences. Secondly, as stated previously, the atrophy measures are highly correlated (see Table 3), thus the chi-square test, which assumes independence, overestimates the variability and, again, potential significant differences will not be detected.
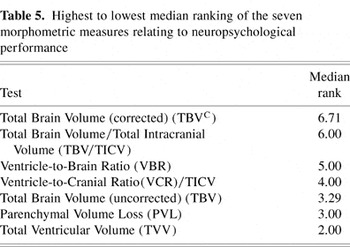
We utilized two procedures that take into consideration multiple measures and the interrelationships of atrophy measures. The first was the Friedman test of rank comparisons, a non-parametric procedure which was described earlier. This test was highly significant (p < .001) indicating that the atrophy measures have significantly different median ranks from each other (refer to Table 5). This further indicates that several of the atrophy measures had consistently higher correlations than the others. For example, TBVC had the highest correlation median rank (6.71), indicating that TBVC tended to have stronger correlations with the neuropsychological tests. TBV/TICV had a median rank of 6.00 suggesting that it also had stronger correlations than the other atrophy measures. Pair-wise analyses of the ranks showed that the ranks for TBVC and TBV/TICV were not significantly different from each other, but they were significantly higher than the other measures. While the rank results of the Friedman test do not specifically indicate statistical superiority of one atrophy measure over another, they are indicative of a trend that TBVC and TBV/TICV have stronger correlations than the others.
Highest to lowest median ranking of the seven morphometric measures relating to neuropsychological performance

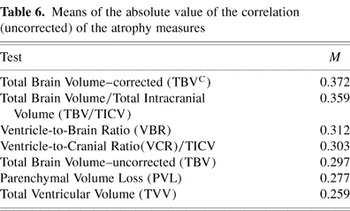
The second method used, that adjusted for multiple testing and interrelation between atrophy measures was to use a repeated measures analysis where the repeated measures are not made over time, but over neuropsychological tests. This can be thought of as comparing the mean correlations of the brain atrophy measure across all tests. However, this test assumes a normal distribution, so the correlations were first transformed by taking the arc sin of the absolute value so they would satisfy the normality assumption. This test indicates that the means of the atrophy correlations are significantly different (p < .001) thus, averaged across all neuropsychological tests, one or more of the atrophy measures have stronger correlations than the other measures (see Table 6). Bonferroni adjusted pair-wise analysis reveals that TBVC and TBV/TICV have significantly higher means than all the other measures but are not significantly different from each other (TBV/TICV only approaches significance when compared to VBR; padjusted = .12, punadjusted = .006).
Means of the absolute value of the correlation (uncorrected) of the atrophy measures

DISCUSSION
The various correction procedures for head size and measures of cerebral atrophy were highly interrelated. This is not surprising because from a developmental perspective cranial capacity is largely driven by the expanding brain where TBV and TICV enlarge in concert. TICV approximates maximal volume very early in life (∼5 years of age) and by late childhood-adolescence becomes invariant (Courchesne et al., 2000). In such a rapid growth matrix, volumes of most brain structures as well as TBV become highly interrelated (Baare et al., 2001a, 2001b; Thompson et al., 1998, 2001b). Since the correlations were not uniform, each measure does still capture some unique element of brain structure in relationship to neuropsychological performance. However, from a statistical standpoint, no correction procedure or measure of atrophy showed a significantly higher correlation with each neuropsychological measure than another. Nonetheless, across all the neuropsychological tests, TBVC and TBV/TICV consistently demonstrated higher correlations than other measures and possibly represent the better single measures for detecting whole brain–cognitive relationships. VBR came in as a very close third best candidate for detecting atrophy-neuropsychological relationships. Uncorrected values of brain and ventricular volume resulted in the least reliable and robust relationships with neuropsychological variables. Accordingly, the use of uncorrected brain and/or ventricular values may not be warranted in aging and demented populations unless there are special circumstances. From the above analysis TBVC, TICV or VBR are the preferred methods. However, these three corrected measures are similar enough that they may be interchangeable. Certainly this similarity indicates redundancy if more than one is used in studies of general brain morphology and neurobehavioral performance in aging, neuropsychiatric disordered, and demented populations.
Mathalon et al. (1993, 1994) provide a detailed statistical review of correction for head size in neuroimaging. They used normal controls and individuals with schizophrenia and found somewhat higher correlations when head size was removed from the ROI by using regression techniques. We utilized this method and found similar results (see Table 4), in which the correlations were generally higher when the parenchymal volume measure was assessed by their method. However, when TICV, age and sex were controlled using partial correlations for PVL, the findings were nearly identical to the residualized method. In addition, the regression method never uncovered a unique correlation when compared to the other methods. Also, even in the largest difference the residualized method only improved less than .5% of the accounted for variance. It should also be noted as has been suggested by Mathalon et al. (1993, 1994) that removing head size from the analysis may obscure certain findings that are more appropriate for raw or ratio score analyses. For example, in the study of premorbid brain size, correcting for brain volume may alter the dependent variable under scrutiny. Also, there are practical reasons for using ratio corrections or statistically correcting for head size, since these methods require less statistical manipulation than the Mathalon et al. (1993, 1994) method. Since the various methods yield nearly equivalent results, the extra time for their computation may not be warranted.
There are several limitations of these findings. Since brain morphology changes with aging, the current findings may not extrapolate to longitudinal differences that occur in either the aging brain and/or the progressive neuropathological disorder (Fox et al., 2000). Rate of change in these morphometric measures may yield different indices sensitive to neuropsychological performance. In addition, there were only 20 control subjects available in the present study. A cross validation of the current study with a larger cohort of controls, particularly involving those over 85 years of age, in which greater atrophy is part of the ‘normal’ aging process will be important. Also, the current study focused on whole brain measures and indices of atrophy, rather than focal lesions or regional areas of atrophy. We plan to study these relationships in a separate study and it may be that different associations emerge when trying to quantify relationships between lesions or focal cerebral changes and neuropsychological performance.
In summary, correction of head size is important in accurately assessing the relationship between whole brain atrophy and neuropsychological performance in aging, neuropsychiatric disordered, or demented subjects. The recommended correction methods are TBVC, TBV/TICV or VBR. Only one method is necessary as the different measures are highly interrelated and do not differ statistically in their magnitude and consistency of relationship to neuropsychological test performance.
ACKNOWLEDGMENTS
Supported in part by National Institutes of Health Grant AG-11380 (JoAnn Tschanz and Kathleen Welsh-Bohmer) and the Ira Fulton Foundation. We are also grateful for the technical expertise of Tracy Abildskov and the manuscript assistance of Jo Ann Petrie and Craig Vickers.
References
REFERENCES
Arndt, S.,
Cohen, G.,
Alliger, R.J.,
Swayze, V.W., &
Andreasen, N.C.
(1991).
Problems with ratio and proportion measures of imaged cerebral
structures.
Psychiatry Research,
40,
79–90.CrossRefGoogle Scholar
Atkins, M.S. &
Mackiewich, B.T.
(2000).
Fully automated hybrid segmentation of the brain. In
I.N. Bankman (Ed.),
Handbook of medical imaging (pp.
171–183).
San Diego, CA:
Academic Press.
Baare, W.F.C.,
Hulshoff Pol, H.E.,
Boomsma, D.I.,
Postuma, D.,
de Geus, E.J.C.,
Schnack, H.G.,
van Haren, N.E.M.,
van Oel, C.J., &
Kahn, R.S.
(2001a).
Quantitative genetic modeling of variation in human brain
morphology.
Cerebral Cortex,
11,
816–824.Google Scholar
Baare, W.F.C.,
van Oel, C.J.,
Hulshoff Pol, H.E.,
Schnack, H.G.,
Durston, S.,
Sitskoorn, M.M., &
Kahn, R.S.
(2001b).
Volumes of brain structures in twins discordant for Schizophrenia.
Archives of General Psychiatry,
58,
33–40.Google Scholar
Bigler, E.D.
(2001).
Premorbid brain volume and dementia.
Archives of Neurology,
58,
831–833.CrossRefGoogle Scholar
Bigler, E.D.,
Kerr, B.,
Victoroff, J.,
Tate, D., &
Breitner, J.C.S.
(2002a).
White matter lesions, quantitative MRI and dementia.
Alzheimer Disease and Associated Disorders,
16,
161–170.Google Scholar
Bigler, E.D.,
Lowry, C.M.,
Anderson, C.V.,
Johnson, S.C.,
Terry, J., &
Steed, M.
(2000).
Dementia, quantitative neuroimaging, and Apolipoprotein E genotype.
American Journal of Neuroradiology,
21,
1857–1868.Google Scholar
Bigler, E.D.,
Lowry, C.M.,
Kerr, B.,
Tate, D.F.,
Hessel, C.D.,
Earl, H.D.,
Miller, M.J.,
Smith, K.H.,
Tschanz, J.T.,
Welsh-Bohmer, K.A.,
Plassman, B.L., &
Victoroff, J.
(2003).
Role of white matter lesions, cerebral atrophy, and APOE on
cognition in older persons with and without dementia: The Cache County,
Utah, study of memory and aging.
Neuropsychology,
17,
339–352.CrossRefGoogle Scholar
Bigler, E.D. &
Tate, D.F.
(2001).
Brain volume, intracranial volume and dementia.
Investigative Radiology,
36,
539–546.CrossRefGoogle Scholar
Bigler, E.D.,
Tate, D.F.,
Miller, M.J.,
Rice, S.A.,
Hessel, C.D.,
Heath, D.E.,
Tschanz, J.T.,
Plassman, B.L., &
Welsh-Bohmer, K.A.
(2002b).
Dementia, asymmetry of temporal lobe structures, and Apolipoprotein
E genotype: Relationships to cerebral atrophy and neuropsychological
impairment.
Journal of the International Neuropsychological Society,
8,
925–933.Google Scholar
Blatter, D.D.,
Bigler, E.D.,
Gale, S.C.,
Johnson, S.C.,
Anderson, C.V.,
Burnett, B.M.,
Parker, N.,
Kurth, S., &
Horn, S.
(1995).
Quantitative volumetric analysis of brain MR: Normative database
spanning five decades of life.
American Journal of Neuroradiology,
16,
241–251.Google Scholar
Blinkov, S.M. &
Glezer, I.I.
(1968).
The human brain in figures and tables: A quantitative
handbook.
New York:
Plenum Press.
Bradley, W.G. &
Orrison, W.W.
(2000).
Hydrocephalus and cerebrospinal fluid flow. In
W.W. Orrison (Ed.),
Neuroimaging (pp.
704–1716).
Philadelphia:
W.B. Saunders.
Breitner, J.C.S.,
Wyse, B.W.,
Anthony, J.C.,
Welsh-Bohmer, K.A.,
Steffens, D.C.,
Norton, M.C.,
Tschanz, J.T.,
Plassman, B.L.,
Meyer, M.R.,
Skoog, I., &
Khachaturian, A.
(1999).
APOE-4 count predicts age when prevalence of AD increases, then
declines: The Cache County Study.
Neurology,
53,
321–331.CrossRefGoogle Scholar
Cahn, D.A.,
Sullivan, E.V.,
Shear, p.K.,
Marsh, L.,
Fama, R.,
Lim, K.O.,
Yesavage, J.A.,
Tinklenberg, J.R., &
Pfefferbaum, A.
(1998).
Structural MRI correlates of recognition memory in Alzheimer's
disease.
Journal of the International Neuropsychological Society,
4,
106–114.CrossRefGoogle Scholar
Cherniak, C.
(1990).
The bounded brain: Toward quantitative neuroanatomy.
Journal of Cognitive Neuroscience,
2,
58–68.CrossRefGoogle Scholar
Conover, W.J.
(1999).
Practical Nonparametric Statistics.
New York:
John Wiley & Sons, Inc.
Courchesne, E.,
Chisum, H.J.,
Townsend, J.,
Cowles, A.,
Covington, J.,
Egaas, B.,
Harwood, M.,
Hinds, S., &
Press, G.A.
(2000).
Normal brain development and aging: Quantitative analysis at in
vivo MR imaging in healthy volunteers.
Radiology,
216,
672–682.CrossRefGoogle Scholar
Dekaban, A.S. &
Sadowsky, D.
(1978).
Changes in brain weight during the span of human life: Relation of
brain weights to body heights and body weights.
Annals of Neurology,
4,
345–356.CrossRefGoogle Scholar
Fama, R.,
Sullivan, E.V.,
Shear, P.K.,
Cahn-Weiner, D.A.,
Marsh, L.,
Lim, K.O.,
Yesavage, J.A., &
Rinklenberg, J.R.
(2000).
Structural brain correlates of verbal and nonverbal fluency
measures in Alzheimer's disease.
Neuropsychology,
14,
29–40.CrossRefGoogle Scholar
Finlay, B.L. &
Darlington, R.B.
(1995).
Linked regularities in the development and evolution of mammalian
brains.
Science,
268,
1578–1584.CrossRefGoogle Scholar
Folstein, M.F.,
Folstein, S.E., &
McHugh, P.R.
(1975).
“Mini-Mental State.” A practical method for grading the
cognitive state of patients for clinician.
Journal of Psychiatric Research,
12,
189–198.CrossRefGoogle Scholar
Forstl, H.,
Sattel, H.,
Besthorn, C.,
Daniel, S.,
Geiger-Kabisch, C.,
Hentschel, F.,
Sarochan, M., &
Zerfab, R.
(1996).
Longitudinal cognitive, electroencephalographic and morphological
brain changes in ageing and Alzheimer's disease.
British Journal of Psychiatry,
168,
280–286.CrossRefGoogle Scholar
Fox, N.C.,
Cousens, S.,
Scahill, R.,
Harvey, R.J., &
Rossor, M.N.
(2000).
Using serial registered brain magnetic resonance imaging to measure
disease progression in Alzheimer disease.
Archives of Neurology,
57,
339–344.CrossRefGoogle Scholar
Gale, S.D.,
Bigler, E.D.,
Johnson, S., &
Blatter, D.D.
(1995).
Global degeneration following traumatic brain injury: Anatomic and
neuropsychologic correlates.
Journal of the International Neuropsychological Society,
1,
162.CrossRefGoogle Scholar
Gur, R.E.,
Turetsky, B.I.,
Cowell, P.E.,
Finkelman, C.,
Maany, V.,
Grossman, R.I.,
Arnold, S.E.,
Bilker, W.B., &
Gur, R.C.
(2000).
Temporolimbic volume reductions in schizophrenia.
Archives of General Psychiatry,
57,
769–775.CrossRefGoogle Scholar
Haug, J.O.
(1962).
Pneumoencephalographic studies in mental disease.
Acta Psychiatrica Scandinavica (suppl.),
165,
1–114.Google Scholar
Jack, C.R.,
Petersen, R.C.,
Xu, Y.,
O'Brien, P.C.,
Smith, G.e.,
Ivnik, R.J.,
Tangalos, E.G., &
Kokmen, E.F.
(1998).
Rate of medial temporal lobe atrophy in typical aging and
Alzheimer's disease.
Neurology,
51,
993–999.CrossRefGoogle Scholar
Jack, C.R.,
Petersen, R.C.,
Xu, Y.C.,
O'Brien, P.C.,
Smith, G.E.,
Ivnik, R.J.,
Boeve, B.F.,
Waring, S.C.,
Tangalos, E.G., &
Kokmen, E.
(1999).
Prediction of AD with MRI-based hippocampal volume in mild
cognitive impairment.
Neurology,
52,
1397–1403.CrossRefGoogle Scholar
Jack, C.R.,
Theodore, W.H.,
Cook, M., &
McCarthy, G.
(1995).
MRI-based hippocampal volumetrics: Data acquisition, normal ranges,
and optimal protocol.
Magnetic Resonance Imaging,
13,
1057–1064.CrossRefGoogle Scholar
Jenkins, R.,
Fox, N.C.,
Rossor, A.M.,
Harvey, R.J., &
Rosser, M.N.
(2000).
Intracranial volume and Alzheimer disease: Evidence against the
cerebral reserve hypothesis.
Archives of Neurology,
57,
220–224.CrossRefGoogle Scholar
Kidron, D.,
Black, S.E.,
Stanchev, P.,
Buck, B.,
Szalai, J.P.,
Parker, J.,
Szekely, C., &
Bronskill, M.J.
(1997).
Quantitative MR volumetry in Alzheimer's disease: Topographic
markers and the effects of sex and education.
Neurology,
49,
1504–1512.CrossRefGoogle Scholar
Killiany, R.J.,
Gomez-Isla, T.,
Moss, M.,
Kikinis, R.,
Sandor, T.,
Jolesz, F.,
Tanzi, R.,
Jones, K.,
Hyman, B.T., &
Albert, M.S.
(2000).
Use of structural magnetic resonance imaging to predict who will
get Alzheimer's disease.
Annals of Neurology,
47,
430–439.3.0.CO;2-I>CrossRefGoogle Scholar
Lancaster, J.L.,
Woldorff, M.G.,
Parsons, L.M.,
Liotti, M.,
Freitas, C.S.,
Rainey, L.,
Kochunov, P.V.,
Nickerson, D.,
Mikiten, S.A., &
Fox, P.T.
(2000).
Automated Talairach atlas labels for functional brain mapping.
Human Brain Mapping,
10,
120–131.3.0.CO;2-8>CrossRefGoogle Scholar
Mathalon, D.H.,
Sullivan, E.V.,
Rawles, J.M., &
Pfefferbaum, A.
(1993).
Correction for head size in brain-imaging measurements.
Psychiatry Research,
50,
121–139.CrossRefGoogle Scholar
Mathalon, D.H.,
Sullivan, E.V.,
Rawles, J.M., &
Pfefferbaum, A.
(1994).
Correction for head size in brain-imaging measurements: Correction.
Psychiatry Research,
55,
179–180.Google Scholar
Matsumae, M.,
Kikinis, R.,
Morocz, I.A.,
Lorenzo, A.V.,
Sandor, T.,
Albert, M.A.,
Black, P.M., &
Jolesz, F.A.
(1996).
Age-related changes in intracranial compartment volumes in normal
adults assessed by magnetic resonance imaging.
Journal of Neurosurgery,
84,
982–991.CrossRefGoogle Scholar
Nellhaus, G.
(1968).
Head circumference from birth to eighteen years.
Pediatrics,
41,
106–114.Google Scholar
Norton, M.C.,
Tschanz, J.T.,
Fan, X.,
Plassman, B.L.,
Welsh-Bohmer, K.A.,
N., W.,
Wyse, B.W., &
Breitner, J.C.S.
(1999).
Telephone adaptation of the Modified Mini-Mental State Exam.
Neuropsychiatry, Neuropsychology and Behavioral Neurology,
12,
270–276.Google Scholar
Peterson, B.S.,
Staib, L.H.,
Scahill, L.,
Zhang, H.,
Anderson, C.V.,
Leckman, J.F.,
Cohen, D.J.,
Gore, J.C.,
Albert, J., &
Webster, R.
(2001).
Regional brain and ventricular volumes in Tourette syndrome.
Archives of General Psychiatry,
58,
427–440.CrossRefGoogle Scholar
Peterson, B.S.,
Vohr, B.,
Staib, L.H.,
Cannistraci, C.J.,
A.Dolberg, A.,
Schneider, K.C.,
Katz, K.H.,
Westerveld, M.,
Sparrow, S.,
Anderson, A.W.,
Duncan, C.C.,
Makuch, R.W.,
Gore, J.C., &
Ment, L.R.
(2000).
Regional brain volume abnormalities and long-term cognitive outcome
in preterm infants.
Journal of the American Medical Association,
284,
1939–1947.CrossRefGoogle Scholar
Pfefferbaum, A.,
Lim, K.O.,
Rosenbloom, M.J., &
Zipursky, R.B.
(1990).
Brain magnetic resonance imaging: Approaches for investigating
schizophrenia.
Schizophrenia Bulletin,
16,
453–476.CrossRefGoogle Scholar
Raz, N.,
Raz, S., &
Bigler, E.D.
(1988a).
Ventriculomegaly in schizophrenia, the role of control groups and
the perils of dichotomous thinking: A reply to Smith and Iacono.
Psychiatry Research,
26,
245–248.Google Scholar
Raz, S.,
Raz, N., &
Bigler, E.D.
(1988b).
Ventriculomegaly in schizophrenia: Is the choice of controls
important?
Psychiatry Research,
24,
71–77.Google Scholar
Reiss, A.L.,
Abrams, M.T.,
Singer, H.S.,
Ross, J.L., &
Denkla, M.B.
(1996).
Brain development, gender and IQ in children: A volumetric imaging
study.
Brain,
119,
1763–1774.CrossRefGoogle Scholar
Robb, R.
(1995a).
ANALYZE: Three-dimensional biomedical imaging.
New York:
VCH Publishers.
Robb, R.
(1995b).
Three-dimensional biomedical imaging.
New York:
VCH Publishers.
Robb, R.A.
(2001).
ANALYZE: The biomedical imaging resource at Mayo Clinic.
IEEE Transactions on Medical Imaging,
20,
854–867.CrossRefGoogle Scholar
Schlaepfer, T.E.,
Harris, G.J.,
Tien, A.Y.,
L., P., &
Lee, S.
(1995).
Structural differences in the cerebral cortex of healthy female and
male subjects: A magnetic resonance imaging study.
Psychiatry Research,
61,
129–135.CrossRefGoogle Scholar
Schultz, R.T. &
Chakraborty, A.
(1996).
Magnetic resonance image analysis. In
E.D. Bigler (Ed.),
Neuroimaging I: Basic science
(Vol. I, pp.
9–51).
New York:
Plenum Press.
Shear, P.K.,
Sullivan, E.V.,
Mathalon, D.H.,
Lim, K.O.,
Davis, L.F.,
Yesavage, J.A.,
Tinklenberg, J.R., &
Pfefferbaum, A.
(1995).
Longitudinal volumetric computed tomographic analysis of regional
brain changes in normal aging and Alzheimer's disease.
Archives of Neurology,
52,
392–402.CrossRefGoogle Scholar
Smith, C.D.,
Snowden, D.A.,
Wang, H., &
Markesbery, W.R.
(2000).
White matter volumes and periventricular white matter
hyperintensities in aging and dementia.
Neurology,
54,
838–842.CrossRefGoogle Scholar
Tanabe, J.L.,
Amend, D.,
Schuff, N.,
DiSclafani, V.,
Ezekiel, F.,
Norman, D.,
Fein, G., &
Weiner, M.W.
(1997).
Tissue segmentation of the brain in Alzheimer's disease.
American Journal of Neuroradiology,
18,
115–123.Google Scholar
Thompson, P.M.,
Cannon, T.D.,
Narr, K.L.,
van Erp, T.,
Poutanen, V.-P.,
Huttenen, M.,
Lonnqvist, J.,
Standertskjold-Nordenstam, C.-G.,
Kaprio, J.,
Khaledy, M.,
Dail, R.,
Zoumalan, C.I., &
Toga, A.W.
(2001a).
Genetic influences on brain structure.
Neuroscience,
4,
1253–1258.Google Scholar
Thompson, P.M.,
Moussai, J.,
Zohoori, S.,
Goldkorn, A.,
Khan, A.A.,
Mega, M.S.,
Small, G.W.,
Cummings, J.L., &
Toga, A.W.
(1998).
Cortical variability and asymmetry in normal aging and
Alzheimer's disease.
Cerebral Cortex,
8,
492–509.CrossRefGoogle Scholar
Thompson, P.M.,
Vidal, C.,
Giedd, J.N.,
Gochman, P.,
Blumenthal, J.,
Nicolson, R.,
Toga, A.W., &
Rapoport, J.L.
(2001b).
Mapping adolescent brain change reveals dynamic wave of accelerated
gray matter loss in very early-onset schizophrenia.
Proceedings of the National Academy of Sciences of the United
States of America,
98,
11650–11655.Google Scholar
Tschanz, J.T.,
Welsh-Bohmer, K.A.,
Skoog, I.,
West, N.,
Norton, M.C.,
Wyse, B.W.,
Nickles, R., &
Breitner, J.C.S.
(2000).
Dementia diagnoses from clinical and neuropsychological data
compared: The Cache County study.
Neurology,
54,
1290–1296.CrossRefGoogle Scholar
Welsh, K.A.,
Butters, N.,
Mohs, R.C.,
Beekly, D.,
Edland, S.,
Fillenbaum, G., &
Heyman, A.
(1994).
The Consortium to Establish a Registry of Alzheimer's Disease
(CERAD). Part V: A normative study of the neuropsychological
battery.
Neurology,
44,
609–614.Google Scholar
Wilson, R.S.,
Sullivan, M.,
de Toledo-Morrell, L.,
Stebbins, G.T.,
Bennett, D.A., &
Morrell, F.
(1996).
Association of memory and cognition in Alzheimer's disease
with volumetric estimates of temporal lobe structures.
Neuropsychology,
10,
459–463.CrossRefGoogle Scholar
Xu, Y.,
Jack, C.R.,
O'brien, P.C.,
Kokmen, E.,
Smith, G.E.,
Ivnik, R.J.,
Boeve, B.F.,
Tangalos, R.G., &
Petersen, R.C.
(2000).
Usefulness of MRI measures of entorhinal cortex versus hippocampus
in AD.
Neurology,
54,
1760–1767.CrossRefGoogle Scholar
Zar, J.H.
(1996).
Biostatistical analysis.
Englewood Cliffs, NJ:
Prentice Hall.

Formulas for calculating the various methods for quantification of brain atrophy

Cache County subject demographics
Intercorrelational matrix for quantitative brain measures

This figure depicts correlations of the various quantitative magnetic resonance (MR) measures in comparison with individual neuropsychological test performance for all subjects in the Cache County Study. Each individual neuropsychological measure is listed on the x-axis with each quantitative neuroimaging procedure represented in a color-coded symbol as indicated in the legend on the right (y-axis). Note that in the majority of the cases total brain volume-corrected (TBVC; golden line), the ratio formed by total brain volume/total intracranial volume (TBV/TICV) and the ventricle-to-brain ratio (VBR) measure yielded the highest correlations. The golden line was added to enhance the identification of the VBR showing that in most cases it represented correlations with neuropsychological tests that were highest. Note that correlations are given in absolute terms. Lastly, even though the TBVC or TBV as a ratio to TICV yielded the highest correlations, the magnitude of difference across the different measures was often minimal and always insignificant. Domains of neuropsychological function are given in color and capitalized as underlined headings. Each domain was based on the average z-score of the summed individual tests that made up each domain, except the constructional praxis task of the Consortium to Establish a Registry for Alzheimer's Disease (CERAD) battery, which was the only task for the VISUOSPATIAL Domain and the Shipley IQ for the INTELLIGENCE Domain.

Comparison of residualized measures with parenchymal volume loss (PVL) corrected and uncorrected
Highest to lowest median ranking of the seven morphometric measures relating to neuropsychological performance
Means of the absolute value of the correlation (uncorrected) of the atrophy measures
 You have
Access
- 41
- Cited by