Implications
Among the numerous constraints that livestock producers face to meet the societal requirements, ensuring the animal welfare while preserving the environment remains an important challenge since contradictions can rise up between these criteria. An increase of the size of the drainage openings in the continuous solid part of the pen for gestating sows to a value of 15%, compared with 2.5%, allows reducing ammonia and greenhouse gas emissions, without prejudice to compliance with EU regulation on welfare of gestating sows.
Introduction
Since January 2013 individual housing of sows has been prohibited in the EU during a period starting from 4 weeks after the service up to 1 week before the expected time of farrowing (Council Directive 2001/88/EC amending Directive 91/630/EEC laying down minimum standards for the protection of pigs). According to this EU legislation, group-housed gestating sows must have a minimum of 2.25 m2 floor area per sow (+10% for a group with five or less sows) with at least 1.3 m2 of continuous solid floor of which a maximum of 15% is reserved for drainage openings. These rules concerning the floor characteristics were determined according to the welfare requirements of sows. However, flooring arrangements also have environmental impacts with some influences on ammonia and greenhouse gas emissions (Philippe et al., Reference Philippe, Canart, Laitat, Wavreille, Vandenheede, Bartiaux-Thill, Nicks and Cabaraux2011a; Philippe and Nicks, Reference Philippe, Canart, Laitat, Wavreille, Bartiaux-Thill, Nicks and Cabaraux2015). Drainage openings on the solid floor must limit the fouling of the floor with deposits of urine and faeces which, if they occur, contribute to increase gaseous emissions particularly ammonia (NH3) but maybe also methane (CH4) and nitrous oxide (N2O) emissions
NH3-emissions have to be minimized because they contribute to soil and water acidification, to water eutrophication and to indirect N2O-emissions (IPCC, 2006). N2O-and CH4-emissions contribute to climate change, their global warming potential (GWP) over a 100-year period being 298 and 25 times that of carbon dioxide (CO2) (IPCC, 2007), respectively. The purpose of this study was to measure the impact of the percentage of the solid floor drainage openings on NH3-, CH4- and N2O-emissions, by comparing the maximum drainage openings authorized by EU legislation (i.e. 15%) to a minimum of 2.5%. CO2 and water vapour (H2O) emissions were also measured as the concentrations of these two gases can serve as indicators of the air quality inside animal houses (CIGR, 1984). Furthermore CO2-emissions may also differ between rearing systems as shown by example in weaning and fattening pigs by Philippe et al. (Reference Philippe, Cabaraux and Nicks2007) and Cabaraux et al. (Reference Cabaraux, Philippe, Laitat, Canart, Vandenheede and Nicks2009).
Material and methods
The trial was carried out in experimental rooms located at the Faculty of Veterinary Medicine of Liège University (Belgium). The ethical committee of the university approved the use and handling of animals in this study.
Experimental rooms
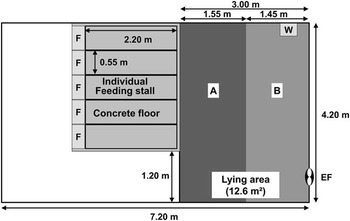
Two experimental rooms, similar in volume (103 m3) and surface (30.2 m2), were arranged and equipped for the experiment. Each room consisted of a service area and a pen designed to group-house five gestating sows. Each pen consisted of a lying area and a feeding area made up of five individual feeding stalls (Figure 1). The feeding stalls were equipped with front feeding troughs, rear gates and a concrete floor. There was a water trough with ad libitum access in each pen. The sows had access to the feeding stalls only during the feeding times.
Plan of the experimental rooms. F: feeding trough; W: water trough; EF: exhaust fan; A: concrete slat panels with a void percentage of 14.2% in room 1 or concrete perforated panels with a void percentage of 2.5% in room 2; B: concrete slat panels with a void percentage of 15.8% in the two rooms.

The surface of the lying area was 12.6 m2, that is 2.5 m2 per sow. In both rooms, the rear of the floor pen, that is 1.2 m2 per sow, was built with concrete slat panels with 20 mm rectangular openings (void percentage of 15.8%). The front of the floor, that 1.3 m2 per sow, was made either of concrete slat panels with 18 mm rectangular openings (void percentage of nearly 15%, that 14.2%) in room 1 (R15) or of concrete perforated panels with 2.8 cm2 circular holes (void percentage of 2.5%) in room 2 (R2.5). The slurry pits were under all the lying areas and were 30 cm deep. Just before the arrival of the sows, 700 l water were poured into each pit to have a 5 to 6 cm water layer in order to avoid crust formation and to ensure good homogenization of the slurry in the pit from the beginning. After each batch, the slurry pits were manually emptied. The manures were transitorily stored in mobile plastic tanks to be weighed, homogenized and sampled (two samples of about 3 l per room and per batch, as representative fractions of the whole content). The samples were analysed to determine their contents in dry matter, organic matter, total N (Kjeldahl method) and ammonium ions (NH4+), using Dutch standard methods (Schulten, Reference Schulten1998a and Reference Schulten1998b). The pens were completely cleaned between the rearing of each batch.
Each room was ventilated with an exhaust fan (Fancom, Panningen, the Netherlands) and the ventilation rate was adapted automatically to maintain a constant ambient temperature by means of FCTA regulator (Fancom). Fresh air entered through a 0.34 m2 opening which was connected to the service corridor of the building; the outside air was thereby preheated before entering the experimental rooms. The air temperature of the experimental rooms, the corridor and the outside were measured automatically every hour. The ventilation rates were measured continuously with an Exavent apparatus (Fancom) with an accuracy of 35 m3/h and a maximal ventilation capacity 3000 m3/h as specified by the manufacturer. The hourly means were recorded.
Animals and feed
Three successive batches of 10 Belgian Landrace gestating sows were used. They were divided into two groups of five animals similar according to parity, BW and backfat thickness. Each group was randomly allocated to a room: R15 or R2.5. The gestating sows arrived in the experimental rooms about 7 weeks after service, and they were moved to farrowing pens 7 days before farrowing; the stay duration in the experimental rooms was 9 weeks for each batch.
The sows received a conventional commercial gestation diet based on cereals with a CP content of 13% and a net energy content of 8876 kJ/kg. The amount of daily feed was restricted and determined per sow as a function of parity, backfat thickness and day of gestation, according to a decisional matrix given by the manufacturer. The feed was supplied once a day at 0800 h and all the sows were blocked in the individual feeding stalls during the feeding time (1 h). The feed and water intake were recorded per group and per batch. Individually, the sows were weighed and backfat thickness was measured on the P2-site by ultrasonography (Dourmad et al., Reference Dourmad, Etienne and Noblet2001) at the beginning and at the end of the trial period. The number of piglets born alive and stillborn was recorded.
Gas emissions measurement
The concentrations of gases in the experimental rooms and in the corridor supplying fresh air were measured by infrared photoacoustic detection with a Multi-gas Monitor – INNOVA 1412 (LumaSense Technologies A/S, Ballerup, Denmark) equipped and calibrated for simultaneous measurement of NH3, N2O, CH4, CO2 and H2O. The lower levels of detection were 0.2 ppm for NH3, 0.03 ppm for N2O, 0.1 ppm for CH4 and 3.4 ppm for CO2, with an accuracy rate of 95%. The monitor was rented and provided for each week of measurements by the Enmo Company (Turnhout, Belgium) which annually calibrates the monitor in accordance with ISO 6142 and ISO 1995. The air was sampled just upstream of the exhaust fan in the experimental rooms and at 1 m from the air inlets in the corridor. For each batch, the concentrations were measured three times (weeks 2, 5 and 8 of stay) during 6 consecutive days. The Multi-gas monitor was programmed to conduct a cycle of three measurements every hour, once every 20 min, the air being sampled successively in the two experimental rooms and the corridor.
For each gas, the emissions (Egas) were calculated on an hourly basis and expressed in mg/h using the following formula:
 $${\rm E}_{{{\rm gas}}} {\rm {\,\equals\,}D{\times}(C}_{{{\rm in}}} {\rm {\minus}C}_{{{\rm out}}} {\rm )}$$
with D, the hourly mass air flow (kg air/h); Cin and Cout, the concentrations of gas in the air of the room and the corridor, respectively (mg/kg air). The mean emissions per day and per sow were calculated for each series of measurements.
The GWP of the greenhouse gases, N2O and CH4 together, was expressed in CO2 equivalents (CO2eq). CO2-emissions were excluded from this estimation as recommended by IPCC (2007) because it is assumed that CO2-emissions due to feed utilization by animals are compensated by consumption by photosynthesis of plants used as feed. However, indirect N2O-emissions from atmospheric deposition of nitrogen (N) from NH3 on soils and water surfaces have been added to the direct N2O-emissions. The indirect emissions were calculated considering an emission of 0.01 kg N2O-N/kg emitted NH3-N (IPCC, 2006). The CO2eq-emissions of (kg/day per sow) were thus calculated using the following equation:
 $${\rm E}_{{{\rm CO}_{{\rm 2}} _{{{\rm eq}}} }} {\rm {\,\equals\,}25}\,{\rm E}_{{{\rm CH}_{{\rm 4}} }} {\rm {\plus}298\,\,(E}_{{{\rm N}_{{\rm 2}} {\rm O}}} {\rm {\plus}0}{\rm .01}\,{\rm E}_{{{\rm NH}_{{\rm 3}} {\rm {\hbox-}N}}} {\rm {\times}44/28)}$$
taking into account that the warming potentials of CH4 and N2O over a 100-year period are, respectively, 25 and 298 times that of CO2 (IPCC, 2007). This estimation considered the emissions from the building but not the emissions related to the storage and the spreading of manure.
Statistical analyses
For animal performance data, recorded per sow, the differences between groups housed on the two different floors were tested using analysis of variance with two factors: floor (1 df), batches (2 df) and interaction between floor and batches (2 df) (proc GLM) (SAS, 2005). For intake data and slurry characteristics recorded per pen, the differences were tested in the same way but with only the floor (1 df) as a factor (proc GLM) (SAS, 2005).
For room temperatures, ventilation rates, gas concentrations and emissions, the combined data from the three batches were tested in the form of a mixed model for repeated measurements (proc MIXED) (SAS, 2005) including the effects of the floor (1 df), the week of measurement (2 df), the interaction between the floor and the week of measurement (2 df) and the batch (2 df), with 144 (24 h×6 d) successive measurements per week. Residuals were normally distributed, with a null expectation (proc UNIVARIATE) (SAS, 2005). Correlation between successive measurements was modelled using a type 1-autoregressive structure.
Results
Climatic conditions of the rooms
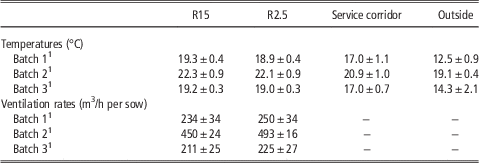
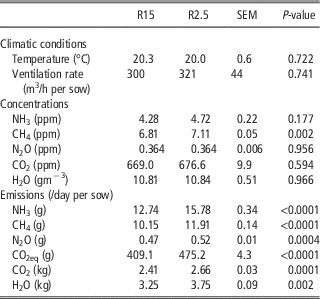
The data about the air temperatures and the ventilation rates are shown in Table 1. The differences between experimental rooms were not statistically significant. The average temperature of the air in the experimental rooms was 20.2°C and the mean ventilation rate, 311 m3/h per sow. Variations of ventilation rates from one replicate to another reflected the adaptation according to the incoming air temperature. Slight differences between temperatures of the two experimental rooms could be explained by differences in the thermal leakage of the walls relative to the location of the rooms in the building.
Climatic conditions during the experiment

R15 and R2.5 signify the percentage of drainage openings of the solid floor, i.e. 15% and 2.5%, respectively.
1 Mean±standard deviation between the three periods of measurements.
Animal performance
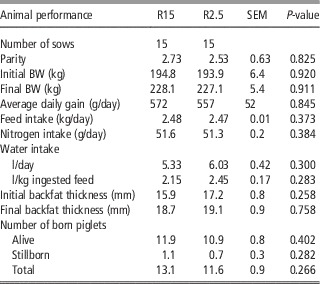
No significant difference in the animal performance was observed between the two rooms (Table 2). The mean initial and final BWs were 193 and 228 kg, respectively, with an average feed intake of 2.47 kg/day. The mean water consumption was 5.4 l/day per sow or 2.2 l/kg ingested feed.
Animal performance as influenced by the percentage of drainage openings of the solid floor in gestating sows (least square means)

R15 and R2.5 signify the percentage of drainage openings of the solid floor, i.e. 15% and 2.5%, respectively.
Amount and composition of manure
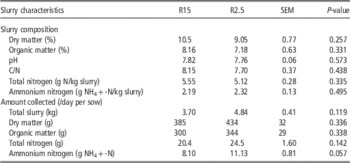
The differences between slurry characteristics from the two experimental pens were not statistically significant (Table 3). On average, 4.3 kg slurry per day and per sow at 9.8% dry matter were collected. N-NH4+ represented 42% of the total nitrogen.
Slurry characteristics as influenced by the percentage of drainage openings of the solid floor in gestating sows (least square means)

R15 and R2.5 signify the percentage of drainage openings of the solid floor, i.e. 15% and 2.5%, respectively.
Gas emissions
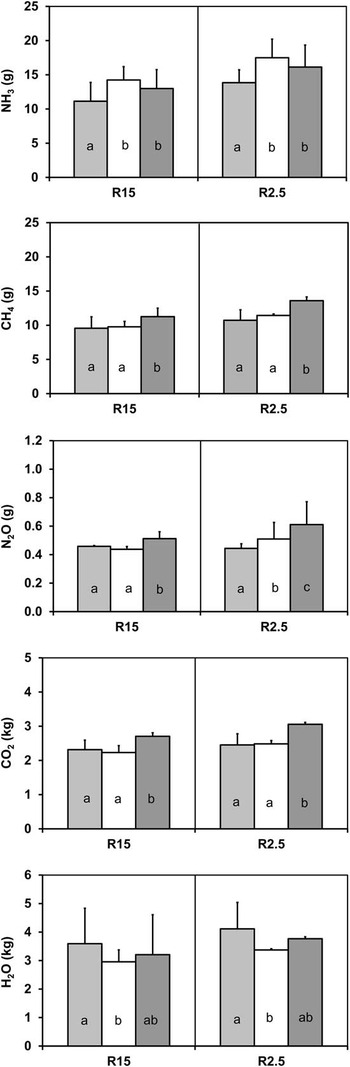
Gas concentrations and emissions measured in the experimental rooms are presented in Table 4. Gaseous emissions were lower with the drainage openings of 15% with reductions of 19% for NH3, 15% for CH4, 10% for N2O, 9% for CO2 and 13% for H2O as compared to the floor with a 2.5% drainage openings. Figure 2 shows the time-related evolution of the emissions. Except for H2O, the emission levels were significantly higher at the end of the stay of the sows than at the beginning. This pattern reflects the higher metabolism of sows and the accumulation of slurry over time.
Gas emissions per day and per sow (mean±standard deviation between the three batches) as influenced by the percentage of drainage openings of the solid floor (15% v. 2.5%) and according to the week of measurement (light-grey, white and dark-grey bars for weeks 2, 5 and 8, respectively). a,b,cWithin a same floor system, columns with different superscripts are significantly different from each other (P<0.05).

Climatic conditions, gas concentrations and emissions as influenced by the percentage of drainage openings of the solid floor in gestating sows (least square means)

R15 and R2.5 signify the percentage of drainage openings of the solid floor, i.e. 15% and 2.5%, respectively.
Discussion
The fact that gas emissions were all significantly different while gas concentrations were not significantly different (except for CH4) between the two rooms, highlighted the impact of ventilation rates on results. The significantly higher gas emissions within the room R2.5 compared to room R15 resulted from a combination in room R2.5 of a slightly higher gas concentrations (but not significant) and a higher ventilation rate (but not significant) by 8.3% on average.
NH3 emission was 19% lower with the solid floor of which 15% was reserved for drainage openings (12.77 v. 15.83 g/day per sow). These figures are close to the values reported in the review of the literature by Philippe et al. (Reference Philippe, Canart, Laitat, Wavreille, Vandenheede, Bartiaux-Thill, Nicks and Cabaraux2011a) which presented emissions ranging from 8.3 to 12.8 g/day per sow. It is usually assumed that NH3-emissions are lower with a partly slatted floor in comparison with a fully slatted floor on the condition that the emitting manure surface in the pit is reduced and the solid part of the floor is kept clean (Philippe et al., Reference Philippe, Canart, Laitat, Wavreille, Vandenheede, Bartiaux-Thill, Nicks and Cabaraux2011a). Indeed with a partly-slatted floor, the fouling of the solid floor can be important, especially in case of summer conditions and high animal density (European Commission, 2003; Aarnink et al., Reference Aarnink, Schrama, Heetkamp, Stefanowska and Huynh2006). So, if some of the authors observed a decrease of NH3-emissions with the use of a partly-slatted floor compared to a fully-slatted floor with fattening pigs (Groot Koerkamp et al., Reference Groot Koerkamp, Metz, Uenk, Phillips, Holden, Sneath, Short, White, Hartung, Seedorf, Schroder, Linkert, Pedersen, Takai, Johnsen and Wathes1998; Sun et al., Reference Sun, Guo, Peterson, Predicala and Laguë2008; Ye et al., Reference Ye, Zhang, Seo, Kai, Saha, Wang and Li2009), some others observed similar or increased NH3-emissions (Guingand and Granier, Reference Guingand and Granier2001; Guingand and Courboulay, Reference Guingand and Courboulay2007; Guingand et al., Reference Guingand, Quiniou and Courboulay2010). In addition in the current study, the clogging of the holes with animal waste in the R2.5 room could impair the drainage properties of the solid part of the floor with negative impact on NH3-emissions.
Moreover, other parameters than floor type influence NH3-emission (Philippe et al., Reference Philippe, Canart, Laitat, Wavreille, Vandenheede, Bartiaux-Thill, Nicks and Cabaraux2011). For example, emission is positively related to ambient temperature, the air velocity near the manure surface and the CP content of the diets.
In pig houses, the two main sources of CH4 are the animal digestive tract and the manure. The enteric production of CH4 (g/day) is related to the dietary fibre intake and the fermentative capacity of the animal’s hindgut (Philippe et al., Reference Philippe, Laitat, Wavreille, Nicks and Cabaraux2008). Thus, increased consumption of fibre is associated with increased CH4-production, while fermentative capacity depends on the physiological stage of the pigs, with typically higher CH4-production for adult pigs (Philippe et al., Reference Philippe, Laitat, Wavreille, Bartiaux-Thill, Nicks and Cabaraux2015). For gestating sows, the enteric CH4-production (g/day) can be estimated by the following equation proposed by Philippe and Nicks (Reference Philippe, Canart, Laitat, Wavreille, Bartiaux-Thill, Nicks and Cabaraux2015):
 $${\rm CH}_{{\rm 4}} {\rm {\,\equals\,}0}{\rm .021{\times}dRes}$$
where the fibre intake is expressed in digestible residue (dRes, in g/day), defined as the difference between digested organic matter and digested protein, fat, starch and sugar (INRA-AFZ, 2004).
Since fibre intake was similar for both treatments in this trial, the CH4-production from the sow digestive tract was estimated to about 8.00 g/day per sow regardless of the opening size of the floor. It can therefore be deduced that the releases from manure contribute to about 20% and 33% of total emissions for R15 and R2.5, respectively, and may explain the difference observed between the two treatments. In manure, the CH4-production is promoted by lack of oxygen, high temperature, high level of degradable organic matter, high moisture content, low redox potential, neutral pH and C/N ratio between 15 and 30 (Philippe and Nicks, Reference Philippe, Canart, Laitat, Wavreille, Bartiaux-Thill, Nicks and Cabaraux2015). The reasons for higher emissions in the case of the larger drainage openings are not so obvious. With fattening pigs, Guingand et al. (Reference Guingand, Quiniou and Courboulay2010) also reported lightly greater CH4-emissions from a room with a partly slatted floor compared to a room with a fully slatted floor.
The N2O-emissions observed in this trial are in line with the values reported in the literature for gestating sows, ranging from 0.30 to 1.09 g N2O/day per sow (Dong et al., Reference Dong, Zhu, Shang, Kang, Zhu and Xin2007; Costa and Guarino, Reference Costa and Guarino2009; Philippe et al., Reference Philippe, Laitat, Wavreille, Nicks and Cabaraux2011b). The lower emission observed with the solid floor of which 15% was reserved for drainage although significant is however relatively negligible, that is 0.05 g/day per sow. By comparison, the N2O-emissions measured with dry sows kept on straw bedded floor are higher with a range from 0.97 up to 6.12 g/day per sow (Philippe et al., Reference Philippe, Remience, Dourmad, Cabaraux, Vandenheede and Nicks2009, Reference Philippe and Nicks2010, Reference Philippe, Laitat, Wavreille, Nicks and Cabaraux2011b and Reference Philippe, Laitat, Canart, Vandenheede and Nicks2013). These higher levels with bedded systems are due to a close combination in the litter of aerobic and anaerobic areas favouring N2O-synthesis while strictly anaerobic conditions within the slurry limit its production (Veeken et al., Reference Veeken, de Wilde and Hamelers2002). Nevertheless, N2O-emissions can occur in case of crust formation on the surface of the slurry or accumulation of waste on the floor.
As a consequence of differences in CH4- and N2O-emissions according to the percentage of drainage openings, CO2eq-emission was also significantly lower from the R15 room.
The CO2-production from piggeries originates mainly from animal respiration but also from waste. CO2-production during respiration is function of energy metabolism and thus of BW, feed intake and animal activity (CIGR, 2002; Pedersen et al., Reference Pedersen, Blanes-Vidal, Jørgensen, Chwalibog, Haeussermann, Heetkamp and Aarnink2008). According to the models elaborated by the CIGR (2002), CO2-exhalation by sows can be estimated around 2.2 kg per day, representing 80% to 90% of the total emissions obtained in this trial. In manure, CO2 comes from three sources: (1) the rapid hydrolysis of urea into NH3 and CO2 catalysed by the enzyme urease; (2) the anaerobic fermentation of organic matter into intermediate volatile fatty acids, CH4 and CO2; (3) the aerobic degradation of organic matter (Philippe and Nicks, Reference Philippe, Canart, Laitat, Wavreille, Bartiaux-Thill, Nicks and Cabaraux2015). The relative contribution of these pathways depends of the biological, physical and chemical properties of the slurry, such as temperature, moisture content, carbon/nitrogen ratio, degradability of carbon compounds and the pH level.
The lower H2O-emissions observed in the R15 room may be associated to a lower level of water intake for the sows in this room, that is, 5.09 v. 5.74 l/day per sow.
Conclusion
This trial showed the interest to use the opportunity offered by the EU directive for the protection of pigs, to make drainage openings on the continuous solid part of the floor pen for group-housed sows. Indeed, this opportunity allows to associate measures allowing to improve sow welfare with measures allowing to mitigate NH3- and greenhouse gases emissions; what was observed in the present trial with lower gas emissions for drainage openings of the continuous solid part of 15% (the maximum permitted) compared to drainage openings of 2.5%.
Acknowledgements
The technical support of Edwin Dawans and Aurelia Zizo and the financial aid of the Operational Directorate-General for Agriculture, Natural Resources and the Environment of the Public Service of Wallonia (Belgium) were greatly appreciated. The article revision provided by Matthieu Girard is also acknowledged.