Implications
Concentrate-rich diets have become economically important in the production of meat and milk from ruminants. However, the breakdown of a large amount of readily fermentable materials can lead to a decline in ruminal pH and an increase in volatile fatty acid and lactic acid levels, which often induces metabolic acidosis. In this study, we try to illustrate the correlation between rumen chemical and bacterial changes during the stepwise adaptation to a 70% concentrate diet. Based on the current results, new research can be initiated towards the role of individual bacteria and the modulation of rumen bacterial community to prevent metabolic acidosis.
Introduction
Diets containing large proportions of readily fermentable carbohydrate, mainly high-concentrate diets, have become economically important in the production of meat and milk from ruminants. The breakdown of a large amount of readily fermentable materials, such as starch and soluble sugars, can lead to dramatic changes in rumen conditions, such as pH decline and a large increase in volatile fatty acid (VFA) and lactic acid levels, which often induce metabolic acidosis. Therefore, considerable attention has been focused on the fermentative changes in ruminants during switches to high-concentrate diets (Araba et al., Reference Araba, Byers and Guessous2002; Bevans et al., Reference Bevans, Beauchemin, Schwartzkopf-Genswein, McKinnon and McAllister2005). Also, rumen microbiological changes have been monitored using cultivation-based techniques (van der Linden et al., Reference van der Linden, van Gylswyk and Schwartz1984; Goad et al., Reference Goad, Goad and Nagaraja1998) or molecular methods, such as 16S rRNA gene sequencing (Tajima et al., Reference Tajima, Arai, Ogata, Nagamine, Matsui, Nakamura, Aminov and Benno2000) or real-time PCR (Tajima et al., Reference Tajima, Aminov, Nagamine, Matsui, Nakamura and Benno2001; Mosoni et al., Reference Mosoni, Chaucheyras-Durand, Béra-Maillet and Forano2007). However, few studies simultaneously studied both microbial changes and changes in metabolite production in such induction schemes (Mackie et al., Reference Mackie, Gilchrist, Robberts, Hannah and Schwartz1978; Goad et al., Reference Goad, Goad and Nagaraja1998). Moreover, microbial studies often have used cultivation-based techniques, which obviously only allow to investigate cultivable rumen bacteria while the effect on uncultivable bacteria, which can account for the majority of the rumen bacterial population, remained unclear. Therefore, the correlation changes in rumen metabolites and environment and the dynamics of rumen bacterial community on different diets is still poorly understood.
DNA fingerprinting techniques such as denaturing gradient gel electrophoresis (DGGE) and temperature gradient gel electrophoresis (TGGE) have been proven to be quick, sensitive and effective tools that can be used to describe microbial diversity and dynamics of a variety of complex ecosystems (Sigler and Turco, Reference Sigler and Turco2002). Combined with cloning and sequencing, the fingerprinting techniques allow to analyze phylogenetic sequences of bands generated by community members (Konstantinov et al., Reference Konstantinov, Zhu, Williams, Tamminga, de Vos and Akkermans2003), and therefore, the dynamics of corresponding bacteria could be monitored. In this study, PCR/DGGE with subsequent sequence analysis were used to monitor the dynamics of rumen bacteria during the stepwise adaptation to a 70% concentrate diet, and the correlation between rumen chemical and bacterial changes was evaluated.
Material and methods
Animals, diets and experimental design
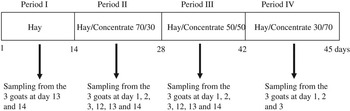
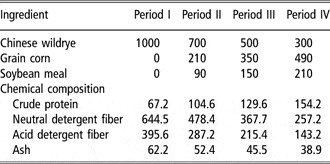
All surgical and animal care procedures throughout the study followed protocols approved by the Chinese Science and Technology Committee Experimental Animal Care and Use guidelines (1998). Three ruminally cannulated Nanjing local goats (male, 2 years old, average BW of 25.6 kg) were used in this study. The experiment consisted of four periods (Figure 1). In each period, animals were fed a different diet. The proportions of concentrate in diet I to IV were 0% (complete forage), 30%, 50% and 70%, respectively (Table 1). The composition of the concentrate was 70% ground corn grain and 30% soybean meal. At the first experimental period, animals were fed diet I, which contained only Chinese wildrye (Aneurolepidium chinense (Trin.) Kitag.), and at 2 weeks interval, animals were stepwisely switched to the high-concentrate diet, i.e., increasing proportion of the Chinese wildrye was replaced by concentrate. All diets were offered at the rate of 1000 g twice daily at 0800 and 1800 h. The goats were penned individually and had a continuous supply of water. Feed refusals were recorded daily. The goats had normal feed intake during the first three periods. After feeding diet IV, the intake was sharply reduced and on the third day, the goats refused feed. Therefore, the experiment was stopped.
Representation of the four periods of diet applied to three fistulated goats and dates of rumen sampling.

Ingredient and chemical composition of the basal diets (g/kg dry matter)

Sampling and chemical analysis
Samples of the four diets (Chinese wildrye, concentrate mix) were dried in an oven at 55°C for 48 h, and ground to pass through a 1-mm screen and analyzed for dry matter (Association of Official Analytical Chemists, 1995; method 930.15) and ash (AOAC, 1995; method 942.05). The neutral detergent fiber (NDF) and acid detergent fiber (ADF) were determined using the methods described by Van Soest et al. (Reference Van Soest, Robertson and Lewis1991) with heat-stable α-amylase and sodium sulfite used in the NDF procedure and expressed inclusive of residual ash. Crude protein (CP; N × 6.25) was determined by the method of Krishnamoorthy et al. (Reference Krishnamoorthy, Muscato, Sniffen and Van Soest1982).
At sampling dates, as shown in Figure 1, representative rumen content samples were obtained anaerobically via fistula from each animal at 0800 (before feeding), 1000, 1400 and 2000 h. Rumen fluid pH was determined on fresh samples collected at these different time points using a portable pH meter (EUTECH, EcoScan pH 5, IL, USA). Part of the rumen contents were filtered through two layers of cheese cloth and ruminal fluid was used for VFA and lactic acid analysis. In accordance with the samples for DGGE analysis (sampled at 1000 h), ruminal fluid samples at 1000 h were used for VFA and lactic acid analysis. VFA concentrations were analyzed according to the method of Qin (Reference Qin1983) using a gas chromatograph (Shimadzu, GC-14A, Kyoto, Japan) equipped with a flame-ionization detector and a capillary column (ULBON HR-52, 0.53 mm i.d. × 30 m, 3.0 μm; column temperature = 120°C, injector temperature = 180°C, detector temperature = 180°C). Values were calculated using a Chromatopac data processing system (C-R 4A, Shimadzu). Concentration of lactic acid was analyzed following the method described by Barker and Summerson (Reference Barker and Summerson1941). Other parts of rumen contents were stored separately at −20°C for later DNA extraction and DGGE analysis.
DNA extraction and PCR amplification
DNA was extracted according to a bead-beating method using a mini-bead beater (Biospec Products, Bartlesville, OK, USA) and followed by phenol–chloroform extraction (Zoetendal et al., Reference Zoetendal, Akkermans and de Vos1998). Primers U968-GC (5′-CGC CCG GGG CGC GCC CCG GGC GGG GCG GGG GCA CGG GGG GAA CGC GAA GAA CCT TAC-3′) and L1401 (5′-CGG TGT GTA CAA GAC CC-3′) were used to amplify the V6-V8 regions of the bacterial 16S rRNA gene (Nübel et al., Reference Nübel, Engelen, Felske, Snaidr, Wieshuber, Amann, Ludwig and Backhaus1996). PCR was performed with the Taq DNA polymerase kit from Promega (Madison, WI, USA) as described by Sun et al. (Reference Sun, Mao, Yao and Zhu2008).
DGGE and analysis of the gels
Amplicons of V6-V8 region of 16S rRNA genes were used for sequence-specific separation by DGGE according to the specifications of Muyzer et al. (Reference Muyzer, de Waal and Uitterlinden1993), using a Dcode TM system (Bio-Rad Laboratories, Hercules, CA, USA). DGGE was performed as described by Sun et al. (Reference Sun, Mao, Yao and Zhu2008). DGGE profiles were analyzed by software of Molecular Analyst 1.61 (Bio-Rad) to obtain densitomeric curves and subsequently similarity indices. Levels of similarity between fingerprints were calculated according to the Dice coefficient. The unweighted pair group method with arithmetic averages was used to create a dendrogram (Michener and Sokal, Reference Michener and Sokal1957; Zhu et al., Reference Zhu, Williams, Konstantinov, Tamminga, de Vos and Akkermans2003).
Cloning and sequence analysis
In order to study the composition of rumen bacterial community at 70% concentrate diet, the sample from goat C on day 2 of feeding diet IV was chosen as a representative for the three goats based on the rumen chemical results and DGGE profiles. Bacterial 16S rRNA genes were amplified (Zoetendal et al., Reference Zoetendal, Akkermans and de Vos1998) with a Taq DNA polymerase kit from Promega using primers 8f (5′-CAC GGA TCC AGA GTT TGA T(C/T)(A/C) TGG CTC AG-3′) and 1510r (5′-GTG AAG CTTACG G(C/F)T ACC TTG CGA CTT-3′) (Lane, Reference Lane1991). PCR products were purified with the Wizard SV Gel and PCR Clean-Up system (Promega) according to the manufacturer’s instructions. The following cloning and sequencing was conducted as described by Sun et al. (Reference Sun, Mao, Yao and Zhu2008).
Nucleotides sequence accession numbers
Nucleotides sequences have been deposited in the GenBank database under the accession numbers DQ085078-DQ085090, DQ256281-256291.
Statistical analysis
Ruminal pH, lactic acid and VFA were analyzed using the general linear model procedure of the ‘Statistical Package for the Social Sciences’ (SPSS, 1999) for repeated measures using the following model:

where μ is the overall mean, pi is a fixed effect of period, dj is a fixed effect of sampling date, gk is a random effect of goat, (pd)ij is a fixed effect of the interaction between periods with sampling date and εijk is random error. Differences between means were tested using the Tukey’s multiple comparison test with 95% confidence intervals. Significant differences were declared at P ⩽ 0.05.
Results
General feed intake behavior of the goats
For the first three periods, goats daily consumed 1000 g feed without refusals. After feeding diet IV, goats consumed the 1000 g of diet on day 1, but feed intake was reduced to about 700 g on day 2 and goats refused to take any feed on day 3. Therefore, the experiment was stopped after 3 days of feeding diet IV.
Rumen chemical changes during the stepwise adaptation to a high-concentrate diet
The stepwise shifts from hay to a high-concentrate diet were accompanied by a number of chemical changes in the rumen fluid of the goats. The pH fluctuated over the four sampling times (8000, 1000, 1400 and 2000 h) within each sampling day. Generally, the pH declined after morning feeding, but returned to the original level at the next morning during feeding at diets I, II and III. With diet IV, the pH declined from 6.8 to 5.4 after 2 h of morning feeding and increased to 6.4 at the morning of day 2, but then declined continually on days 2 and 3 (data not shown). In accordance with the samples (1000 h) for DGGE analysis (Figure 2a), the rumen pH sampled at 1000 h was presented in Table 2. In general, ruminal pH decreased when increasing the dietary concentrate proportion. Ruminal pH was maintained at about 6.7 when feeding a complete hay diet (diet I), sharply declined to about 5.5 after feeding 30% concentrate (diet II) and remained stable until feeding 70% concentrate (diet IV). However, after feeding diet IV, ruminal pH decreased to 5.3 on day 2 and it was maintained at about 4.7 on day 3. At the same time, goats started to reduce their feed intake on day 2 and refused to take any feed on day 3, indicating the occurrence of metabolic acidosis (Owens et al., Reference Owens, Secrist, Hill and Gill1998; Gentile et al., Reference Gentile, Sconza, Lorenz, Otranto, Rademacher, Famigli-Bergamini and Klee2004). Ruminal lactic acid concentration was stable and maintained in a range of 2.71 to 3.63 mmol/l during the initial three feeding periods, but increased significantly 1 day after feeding diet IV, with a peak of 10.6 mmol/l on day 2 of feeding diet IV and then decreased (Table 2).
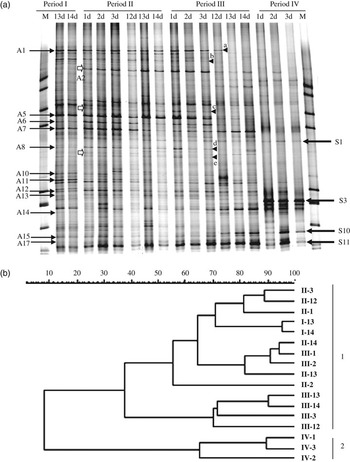
Denaturing gradient gel electrophoresis (DGGE) profile of rumen bacterial community during the stepwise adaptation to a high-concentrate diet (a) and similarity dendrogram (b). The proportions of concentrate in period I to IV were 0% (complete forage), 30%, 50% and 70%, respectively. A1 to A17 are fibrolytic-related bacterial clones from the same goat (goat C) feeding a complete hay diet. White arrowheads indicate bands appearing after feeding diet II, black arrowheads – a, b, c, d and e – indicate bands disappearing at period III. S1 and S11 remained throughout the whole experimental periods and their closely related bacteria are Succinivibrio dextrinosolvens and Prevotella salivae. S3 is the most dominant bacteria appearing after feeding diet IV and it is closely related to Streptococcus bovis. S10 appeared after 12 days of feeding 50% concentrate and remained present after feeding 70% concentrate and it is most closely related to Clostridium hathewayi.

Rumen chemical changes at 1000 h (2-h post-morning feeding) during the stepwise adaptation to a high-concentrate diet in three goats (n = 3)

ns = not significant; TVFA = total volatile fatty acid.
The proportions of concentrate in periods I to IV were 0% (complete hay), 30%, 50% and 70%, respectively.
ns P > 0.05; *P < 0.05; **P < 0.01; ***P < 0.001.
Total ruminal VFA concentration increased from period I to the initial stage of period III, with a peak after 12 days of feeding diet III, and then declined (Table 2). Overall, during experimental periods, ruminal acetate proportions decreased while ruminal propionate proportions increased. Ruminal butyrate proportion increased from period I to the initial stage of period III, but decreased from the late stage of period III (Table 2).
Dynamics of rumen bacterial community during the stepwise adaptation to a high-concentrate diet
Similar DGGE profiles have been observed for the three goats during the stepwise adaptation to a high-concentrate diet, suggesting similar dynamic patterns of the rumen bacterial community. In view of the similar DGGE profiles and similar changes of the physiological and rumen chemical results between the three goats, one goat was chosen as a representative of all DGGE profiles to show the dynamics of the rumen bacterial community during the stepwise adaptation to a high-concentrate diet (Figure 2a). In general, samples collected from period I to the initial stage of period III had similar DGGE patterns, with up to 30 predominant bands in each sample, including 17 common bands in all samples, with DGGE similarity up to 53% (Figure 2b). However, three bands (white arrow indicated) appeared when the feed switched from a complete hay (diet I) to a 30% concentrate diet (diet II) and five bands (indicated as solid arrow head a, b, c, d and e) at the upper of the DGGE gel disappeared after 12 days of feeding diet III. Compared with period III, the number of bands was reduced drastically in period IV and the bacterial community became relatively simple, only 17, 16 and 13 bands left after 1, 2 and 3 days of feeding diet IV, respectively. At the same time, one new most dominant band appeared at the lower part of the DGGE gel (Figure 2a, S3). Similarity analysis showed two clearly different clusters in DGGE similarity dendrogram (Figure 2b). Cluster 1 contained samples of diet I, II and III, whereas cluster 2 contained samples of diet IV. The similarity between the two clusters was only 8%, suggesting rumen bacterial community experienced a marked shift after feeding diet IV.
Dynamics of fibrolytic-related bacteria during the stepwise adaptation to a high-concentrate diet
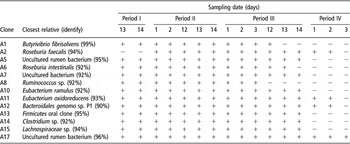
To study the dynamics of fibrolytic-related rumen bacteria during the stepwise adaptation to a high-concentrate diet, the DGGE profiles (Figure 2a) in this study were matched to fibrolytic-related bacterial clones (rice straw-associated bacterial clones) generated from the same goat (goat C) fed a complete hay diet reported in our previous study (Sun et al., Reference Sun, Mao, Yao and Zhu2008), with their sequencing results shown in Table 3. In general, most fibrolytic-related bacterial clones appeared in all DGGE profiles before feeding diet IV, only clone A8 (closest to Ruminococcus sp.) and clone A1 (closest to Butyrivibrio fibrisolvens) disappeared after 12 and 13 days of feeding diet III. However, after feeding diet IV, most clones disappeared and only clone A17 (closest to uncultured rumen bacteria) remained throughout the whole experimental periods. Interestingly, clone A2 appeared after feeding 30% of concentrate (diet II), but disappeared after 3 days of feeding diet IV.
Presence (+) or absence (−) of rumen fibrolytic-related bacterial clones in denaturing gradient gel electrophoresis profiling of rumen fluid obtained during the stepwise adaptation to a high-concentrate diet

The proportions of concentrate in periods I to IV were 0% (complete hay), 30%, 50% and 70%, respectively.
Identification of cloned 16S rRNA gene sequences in DGGE profiles after feeding 70% concentrate diet
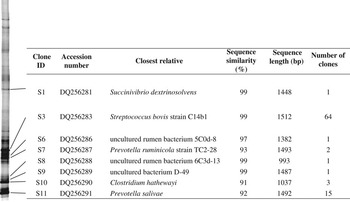
As shown in Figure 2a, many rumen bacteria disappeared and one ‘new’ most dominant bacteria appeared after feeding 70% concentrate (diet IV). It should be interesting to identify these newly appeared bacteria and therefore monitor the dynamics of those corresponding bacteria after feeding diet IV. In accordance with the dynamic analysis of fibrolytic-related bacteria in goat C (Figure 2a), samples from the same goat C on day 2 of feeding diet IV were chosen for detailed cloning and sequencing analysis. Among the 101 positive clones, 88 matched one of the 8 dominant bands in the DGGE profile, whereas 13 clones did not match any visible bands. Among the eight sequences of the matching dominant bands (Figure 3), one (corresponding to clone S3) showed 99% similarity with the known sequence of Streptococcus bovis in GenBank; two (corresponding to clone S7 and S11) showed 93% and 92% similarity with the known sequence of Prevotella ruminicola and Prevotella salivae, respectively. Clone S1 and S6 showed 99% and 97% similarity with Succinivibrio dextrinosolvens and uncultured rumen bacteria, respectively, and their corresponding bands remained throughout the whole experimental periods. Clone S10 showed 91% similarity with Clostridium hathewayi, and the corresponding band appeared after 12 days of feeding 50% concentrate and remained present during the 3 days of feeding 70% concentrate. Interestingly, clones corresponding to S. bovis and genus Prevotella represented 64 and 17 of the total positive clones, respectively. This suggested that S. bovis and genus Prevotella were the most dominant bacteria at high-concentrate diet.
Classification of clones, percentage of similarity to the known sequences in GenBank and clone number obtained from rumen content of a goat fed a 70% concentrate diet (goat C on day 2).

Discussion
Rumen chemical changes during the switch from hay to high-concentrate diet can be measured to diagnose acidosis (Goad et al., Reference Goad, Goad and Nagaraja1998; Kleen et al., Reference Kleen, Hooijer, Rehage and Noordhuizen2003). For example, ruminal pH of 5.5 and 5.0 were often used as thresholds for subacute and acute acidosis, respectively (Nocek, Reference Nocek1997; Kleen et al., Reference Kleen, Hooijer, Rehage and Noordhuizen2003). In this study, ruminal pH varied within a normal range during the first three feeding periods with a normal feed intake, suggesting a normal rumen environment. In fact, when the feed switched from a complete hay diet to 30% concentrate diet, rumen fermentation became more vigorous as revealed by the increase of total VFA, further characterized by an increase in the propionate proportion. This suggests that appropriate levels of concentrate could stimulate rumen fermentation. However, a concentrate level of 50% already may put some pressure on the rumen fermentation as the total VFA concentration declined after prolonged feeding of this diet, although ruminal pH remained at around 5.5. When the concentrate level increased further to 70%, ruminal pH decreased sharply to 5.3 and even 4.7 on days 2 and 3 of feeding diet IV. This change was coupled with a sharp reduction of feed intake and severe depression, which are two symptoms of acidosis observed in previous reports (Nocek, Reference Nocek1997; Gentile et al., Reference Gentile, Sconza, Lorenz, Otranto, Rademacher, Famigli-Bergamini and Klee2004). Thus, in this study, it was observed that feeding on concentrate proportions of around 30% is most suitable for the goats to perform normal rumen function.
It is generally regarded that decreased ruminal pH during subacute acidosis is associated with VFA accumulation (Burrin and Britton, Reference Burrin and Britton1986; Goad et al., Reference Goad, Goad and Nagaraja1998), while acute acidosis is associated with lactic acid accumulation (Harmon et al., Reference Harmon, Britton, Prior and Stock1985; Gentile et al., Reference Gentile, Sconza, Lorenz, Otranto, Rademacher, Famigli-Bergamini and Klee2004). In this study, as the concentrate level increased to 50% (diet III), total VFA concentration initially continued to gradually increase while lactic acid concentration remained relatively stable. After prolonged feeding of this diet (on day 14), total VFA concentration declined while lactic acid concentration and ruminal pH remained relatively stable. Thus, it appears that the gradual accumulation of VFA itself may have started to adversely affect the rumen fermentation, then resulting in a decline of VFA. As the concentrate level increased to 70%, total VFA concentration decreased further, while lactic acid concentration increased sharply, and at the same time ruminal pH started to decline. Therefore, the sharp accumulation of lactic acid was most likely associated with the sharp decrease of ruminal pH and the observed reduction of feed intake, which may suggest acute acidosis.
Similar to rumen fermentation profiles, the rumen bacterial community was relatively stable when feeding diets I and II (Figure 2a), although introduction of 30% concentrate in the diet (diet II) resulted in three additional bands (Figure 2a, white arrow indicated) in the DGGE profile, suggesting that appropriate concentrate can promote the proliferation of those corresponding bacteria. This is in agreement with the rumen fermentation profiles in which total VFA concentration increased as discussed above. Interestingly, one of the three bands is closely related to the bacteria Roseburia faecalis. This species possesses butyryl coenzyme A (CoA): acetate CoA transferase and acetate kinase activities, and could produce butyrate from acetate (Duncan et al., Reference Duncan, Barcenilla, Stewart, Pryde and Flint2002). Therefore, the proliferation of this species may partially illustrate the increase in butyrate and the decrease in acetate proportion after feeding diet II.
As with rumen fermentation profiles, the rumen bacterial community experienced marked changes with diet III. During the initial days of feeding diet III, DGGE profiles were similar to those associated with diets I and II, but after 12 days of feeding diet III, many corresponding bacteria disappeared, including several butyrate-producing bacteria such as B. fibrisolvens (corresponding to clone A1) and Roseburia intestinalis (corresponding to clone A6). This may partially illustrate the decrease in butyrate proportion at the late stage of period III. Ruminococcus sp. and B. fibrisolvens-related sequences also disappeared at the same time, in agreement with Tajima et al. (Reference Tajima, Arai, Ogata, Nagamine, Matsui, Nakamura, Aminov and Benno2000) who observed in a 16S rRNA gene clone library study that Ruminococcus related sequences disappeared 3 days after a switch to high-grain diet. After initiating the 70% concentrate diet (diet IV), a marked shift in DGGE profile was observed, with the disappearance of many fibrolytic-related species, in agreement with Russell and Wilson (Reference Russell and Wilson1996) who observed that many bacteria such as fibrolytic-relative species could not tolerate low ruminal pH and growth ceased.
As most fibrolytic-related bacteria disappeared, S. bovis and Prevotella dominated after feeding diet IV. S. bovis was regarded as the main causative agent in metabolic acidosis as it is capable of rapid growth on starch-based substrates, producing lactic acid as the primary fermentation end product (Russell and Hino, Reference Russell and Hino1985). In this study, S. bovis corresponding band firstly appeared and became the most predominant band after feeding 70% concentrate diet. Therefore, high-concentrate diet could promote the rapid growth of this species, in agreement with an accumulation of lactic acid and consequently a concomitant sharp drop in ruminal pH, which could lead to acidosis as reported previously (Goad et al., Reference Goad, Goad and Nagaraja1998; Kleen et al., Reference Kleen, Hooijer, Rehage and Noordhuizen2003).
A few bacterial species, for example S. dextrinosolvens-like species (Figure 2a, S1) and P. salivae-like species (Figure 2a, S11), were detected throughout the four feeding periods, suggesting their tolerance to low pH in the rumen. But, their role in the rumen is not fully understood. Interestingly, Prevotella-related clones accounted for 16.8% of the total positive clones after feeding 70% concentrate diet. Thus, as one of the most predominant genus at high-concentrate diet, the role of Prevotella species in the rumen merits further study. Another species, C. hathewayi-related sequence (Figure 2a, S10) appeared after 12 days of feeding 50% concentrate diet and remained after feeding 70% concentrate diet, suggesting that high-concentrate diets can promote the proliferation of this species. However, to our knowledge, this is the first report that C. hathewayi-related species found in the rumen and thus its possible role was not clear.
Conclusion
In conclusion, appropriate amount of concentrate could promote the growth of certain bacteria and improve rumen fermentation. However, prolonged feeding of 50% concentrate diet could start to adversely affect rumen fermentation, resulting in a VFA concentration decline. With concentrate levels up to 70%, lactic acid accumulated sharply with a concomitant sharp drop in ruminal pH, and the disappearance of most fibrolytic-related bacteria while S. bovis and Prevotella dominated.
Acknowledgments
This study was supported by National Natural Science Foundation of China (Grant no. 30371041 and 30530560).