I. INTRODUCTION
To meet anti-pollution and energy saving legislations, the automotive industry has paid more attention on realizing lightweight of vehicles by developing lighter and more energy-efficient components nowadays. Mg alloys have been increasingly used to realize lightweight, due to their advantages of low density, high specific strength along with good damping capacity. Reference Zhang, Sun, Han, Gao and Qiu1–Reference Cao, Jahazi, Immarigeon and Wallance5 Nevertheless, there exist some inherent problems in terms of cost and security performance for an intended all-Mg components. The multi-structure of Mg alloy and steel is expected to achieve automobile lightening, as well as reach a compromise between cost and security performance. The multi-structure methodology requires the joining of steel and Mg alloy. Reference Nasiri and Zhou6,Reference Wahba and Katayama7
Several solid state welding methods have been investigated to join Mg alloy to steel, including the diffusion welding, Reference Elthalabawy and Khan8–Reference Elthalabawy and Khan11 the friction stir welding, Reference Inoue, Koseki, Weinberger, Enzinger and Schneider12–Reference Liyanage, Kilbourne, Gerlich and North15 and the resistance spot welding. Reference Liu, Xiao, Feng, Tian, Zhou and Zhou16,Reference Liu, Xiao, Feng, Li, Esmaeili and Zhou17 However, their application is limited by the geometry and size of workpiece, and mechanical properties of welded joints achieved by these processes are also not satisfactory. The hybrid laser-TIG (tungsten inert gas) welding Reference Qi and Song18–Reference Liu and Qi21 and laser penetration brazing Reference Miao, Han, Yao and Li22,Reference Miao, Han, Yao and Li23 were also used for joining Mg alloy to steel. Those processes are costly and are mainly suitable for particular joint forms, e.g., lap assembly or butt assembly with different thickness, which suppressed the pervasive application.
Arc welding is a primary joining method adopted in the automotive industry. This method is cost effective in producing dissimilar joints between Mg and steel. Particularly, metal inert-gas arc welding (MIG welding) is widely applied in automobile and railway vehicle industries for its high efficiency, low cost, and good applicability for the geometry and size of workpiece. Reference Dong, Liao and Yang24,Reference Tay and Butler25 Therefore, it is of great importance to realize the MIG welding of Mg alloy to steel for mass serial production. However, limited publications have focused on the characteristics of Mg–steel MIG welded joints. In our previous studies, Reference Wang, Sun, Yin and Dong30 there exist two kinds of joining mechanisms in the Mg–steel butt joint, the fusion welding in the Mg alloy side and brazing in steel side. The formation of transition layer that was composed of intermetallic compounds at Mg/steel interface was a key for brazing process. Therefore, the intermetallic compounds that are formed by interface reaction are important for the joint performance and need deep-going researches.
The aim of the work is to understand microstructure characteristics and the kinetics of growth of interface intermetallic compounds in the MIG welded joint of the dissimilar materials of steel and Mg alloy, and investigate the effect of the intermetallic compounds on the mechanical behavior of the welded joint.
II. EXPERIMENTAL
S235JR low carbon steel sheets with thickness of 3.0 mm and AZ31B Mg alloy sheets with thickness of 3.0 mm were used in the work. Their chemical compositions in mass percentage are Fe–0.17C–0.2Si–0.45Mn–0.02S–0.01P for the steel and Mg–3.4Al–0.7Zn–0.2Mn–0.043Si for the Mg alloy respectively. The dimensions of sheet specimens for the steel and Mg alloy are 200 mm × 50 mm. The single groove was machined in the Mg alloy and low carbon steel plates, the bevel angles of Mg alloy and steel plates were 30° and 45° respectively, and then both plates were assembled into a single V-groove with a root opening of 1 mm.
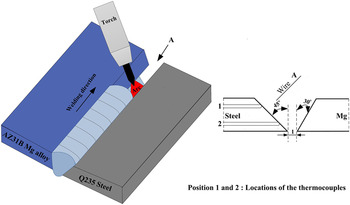
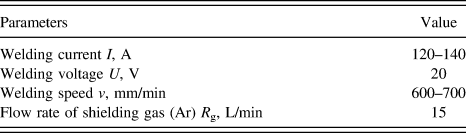
Before welding, the specimens were polished by abrasive paper first and then cleaned in acetone. The dissimilar material MIG welding was carried out using a direct current MIG machine equipped with manipulator. During MIG welding, the Mg alloy filler metal wire was directed toward the upper part of the steel groove face by welding torch, and was deposited in the V-groove at different welding parameters, as shown in Fig. 1. The torch has a drag angle along the welding direction for improving the liquid Mg spreading on solid steel surface and the Mg weld appearance. Before welding experiments, some preliminary welds were made to find a group of parameters by which defect-free joints could be acquired. Just after this optimisation, the experimentation started varying the weld parameters around those values. The optimum welding parameters were shown in Table I.
Schematic diagram of MIG welding and layout of the locations of the thermocouples.

The optimum welding parameters.

The weld thermal cycles at the Mg/steel interface were measured using embedded thermocouples. Two holes with 0.8 mm in diameter were machined in test plates for the placement of thermocouples, and high temperature epoxy was used to fix the thermocouples. The layout of the locations of the thermocouples was shown in position 1 and 2 on the steel side marked in Fig. 1. During MIG welding, a digital data logger with a total capacity of eight K-type thermocouples was used to record the weld thermal cycles, and thermocouples 1 and 2 were for the upper and lower of Mg/steel interface respectively.
After welding, the welded joints were sectioned through the weld zone (WZ), and then mounted and polished in sequence, followed by etching with the picric acid etchant solution to reveal microstructure of the Mg alloy WZ. Microstructure of Mg/steel interface in the welded joints was investigated by means of optical microscopy, scanning electron microscopy (SEM), and transmission electron microscopy (TEM). Chemical compositions across the Mg/steel interface were examined using energy dispersive spectroscopy (EDS). The Vickers microhardness of the joints was measured with a load of 50 g and a duration time of 10 s. Besides, material testing system was used to examine tensile strength of the welded joints at a crosshead speed of 0.5 mm/min. The tensile strength was determined by the average value of over three measurements per condition.
III. RESULTS AND DISCUSSION
A. Characteristics of interfacial intermetallic compounds layer
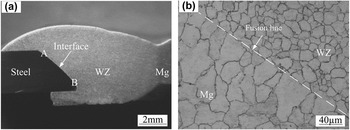
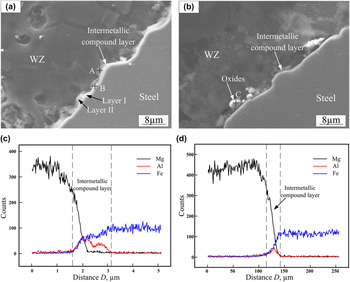
Figure 2 shows the cross-section of the MIG welded joint of S235JR low carbon steel and AZ31B Mg alloy, which was obtained at welding current of 130 A and welding speed of 650 mm/min. It can also be seen in Fig. 2(a) that the Mg–steel joint has a typical fusion welding characteristic in the Mg alloy side, and an apparent interface between steel and Mg alloy was observed in steel side. Figure 2(b) shows that the WZ had an equiaxed grain structure and that coarser grains formed in fusion zone. During welding, the Mg alloy in the welded joint was molten, i.e. Mg WZ, whereas the steel retained solid. The welded joint was achieved by means of wetting and spreading of liquid Mg alloy on solid steel surface, thus it can be regarded as a brazed joint in steel side. Figure 3 showed the SEM images of the Mg/steel interface regions. It indicated that an intermetallic compound layer was formed at the Mg/steel interface, and the intermetallic compound layer displayed a dual-layer characteristic in the thickness direction, a uniform layer (layer I) adjacent to steel side was of lath-like morphology and a dispersive layer (layer II) close to Mg alloy side was of flocculent-like morphology. In addition, the thickness of the intermetallic compound layer presented great variations at different regions along the interface. As is illustrated, an intermetallic compound layer I with thickness of about 1.5–2 μm was formed at the upper interface region [Fig. 3(a)], and the thickness of the intermetallic compound layer I decreased (<0.5 μm) at the lower region [Fig. 3(b)]. Compared with the microstructure at the upper interface, some large white phases precipitated in layer II, and the thickness of intermetallic compound layer II increased obviously. Figures 3(c) and 3(d) showed the element distributions at the upper and lower interface of joint respectively. On the intermetallic compound layer, element Fe increased gradually, and element Mg changed in the opposite direction, which was an indication of the diffusing or dissolving of alloy elements. According to the binary phase diagram of the Fe–Mg system, Reference Kattner, Massalski and Baker26 there was clear evidence that Mg and Fe could not mix in the liquid state at ambient pressure. Moreover, they could not react with each other to form the intermetallic compound. As a result, the formation of intermetallic compound layer was mainly controlled by the diffusion of alloy elements.
Cross-section of MIG welded joint: (a) overview, (b) Mg alloy fusion zone.

SEM images of Mg/steel interface regions in Fig. 2: (a) region A, (b) region B, (c) and (d) elements distributions across Mg/steel interface with line scanning analysis position shown in (a) and (b) respectively.

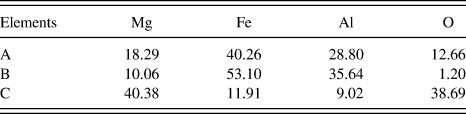
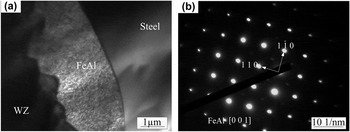
It was also worth noticing that element Al concentrated on the intermetallic compounds layer, as shown in Figs. 3(c) and 3(d), which could be caused by the formation of Fe–Al or Mg–Al phases at the intermetallic compound layer during the MIG process. To ascertain the components of intermetallic compounds, the EDS analysis was performed to obtain the chemical compositions of position A, B, and C as shown in Fig. 3 and the results were listed in Table II. It is indicated that the intermetallic compounds layer contained four elements: Mg, O, Al, and Fe. The intermetallic compound layer I was mainly composed of Fe, Al, and Mg, and both Al and Fe content were much higher than Mg content, which indicated that plenty of Fe–Al phases were formed in this layer. According to the Fe–Al binary phase diagram, Reference Kattner, Massalski and Baker26 the Fe-rich phases (Fe of 53.10 at.% and Al of 35.64 at.%) might be FeAl and Fe3Al. To certify the detailed phase compositions of the intermetallic compound layer I, the interfacial regions were examined by TEM. Figure 4 shows the TEM bright field image and the selected area electron diffraction patterns of the interface. The intermetallic compounds layer I with lath-like structure was observed between steel and Mg alloy WZ [Fig. 4(a)]. From the electron diffraction patterns shown in Fig. 4(b), it could be concluded that the lath-like phase was FeAl.
EDS analysis results of the intermetallic compound layer (at.%).

TEM image and selected area electron diffraction patterns for FeAl phase: (a) TEM image, (b) the selected area electron diffraction (SAED) of FeAl.

The main phases formed in intermetallic compounds layer II were also FeAl phases. However, the FeAl grew discontinuously in this layer because of deficient diffusion and reaction among elements by the fast heating and cooling rate during MIG process. Since the wettability of liquid Mg on steel is poor, the O can easily mix into WZ during the spreading process. As is illustrated in EDS results, except for Fe, Al, and Mg, much O was detected in the intermetallic compounds layer II close to Mg alloy side. Particularly in lower interface, some large oxide phases were formed, which implied that the intermetallic compounds layer II was oxidised partly in the MIG process. This characteristic will deteriorate the interface joining. Therefore, the formation of the intermetallic compounds layer II should be controlled.
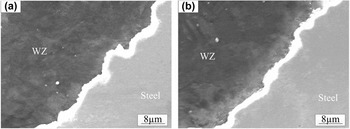
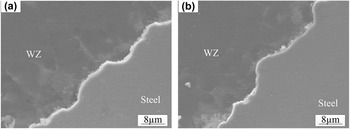
The different characteristics of intermetallic compounds layer in different interface regions could be related to the temperature distribution of joint interface. In MIG process, the upper interface has the higher temperature due to direct heating by arc source. With increasing temperature, the diffusion reaction became drastic. The strong diffusion and reaction among alloy elements would facilitate the formation of intermetallic compounds layer. Owing to the relatively low temperature at the lower part of joint, the intermetallic compounds layer was obscure. Actually, the interface temperature was controlled by welding heat input during MIG process. Thus, the thickness of intermetallic compounds layer will be various under different welding heat input. Figure 5 showed the SEM images of the upper interface under different welding parameters. With increasing the welding current or decreasing the welding speed, the Mg/steel intermetallic compounds layer I became thicker due to high welding heat input. Moreover, the formation of the intermetallic compounds layer II was suppressed, which may attribute to efficient diffusion and reaction among elements. The high temperature also promoted the spreading process of liquid Mg alloy on steel, which prevented much O entering into the interface zone. The same situation was also found in the lower interface as shown in Fig. 6.
Microstructure of intermetallic compound layer of upper interface region at different welding currents and welding speed: (a) 140 A, 650 mm/min, (b) 130 A, 700 mm/min.

Microstructure of intermetallic compound layer of lower interface region at different welding currents and welding speed: (a) 140 A, 650 mm/min, (b) 130 A, 700 mm/min.

B. Kinetics of growth of intermetallic compound layer
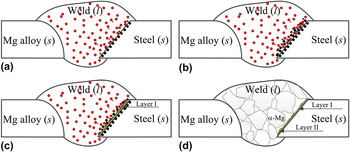
During MIG welding of S235JR steel and AZ31B Mg alloy, the temperature at the Mg/steel interface was higher than melting point of the Mg alloy and lower than that of the steel, and hence the welding process involved wetting and spreading of liquid Mg alloy on solid steel at the interface. Mg alloy finished spreading on steel surface process firstly, and then the reaction between Al element from liquid Mg alloy and Fe from solid steel induced the formation of intermetallic compound layer at Mg/steel interface. A schematic of formation process of intermetallic compounds layer was presented in Fig. 7. Firstly, liquid Mg alloy spread on the steel surface, and Al atoms gathered at Mg/steel liquid/solid interface due to serious burning loss of Mg under high interface temperature [Fig. 7(a)]. Then Fe atoms from steel base metal rapidly diffused and dissolved from the solid/liquid interface to liquid WZ when the temperature suffered at the interface was more than 1193 K (0.6 Tm of steel). Next, the Al atoms in WZ would diffuse to the liquid/solid interface with the increasing of the driving force, and segregate at the interface. The phase at this status can be regarded as a solid solution of Al in Fe, indicated in Fig. 7(b). When the temperature decreased to a lower level, the solid solubility of Al in Fe at the liquid/solid interface was saturated inducing the crystallization of FeAl. The nucleation and growth of FeAl phase occurred first at the liquid/solid interface, and then the intermetallic compounds layer I formed, as shown in Fig. 7(c). Finally, after the temperature further decreased to melting point of Mg alloy or below, the diffusion coefficient of Fe atoms into WZ decreased rapidly, and the intermetallic compounds layer II formed discontinuously, as shown in Fig. 7(d).
The schematic of formation process of intermetallic compounds layer: (a) segregation of Al atoms at the liquid/solid interface, (b) dissolution and diffusion of Fe atoms into WZ, (c) the formation of layer I, (d) the formation of layer II.

It can be shown in Fe–Al phase diagram Reference Kattner, Massalski and Baker26 that five types of intermetallic compounds (Fe3Al, FeAl, FeAl2, Fe2Al5, and FeAl3 phases) exist. According to some thermodynamic data, Reference Zhang, Sun, Han, Gao and Qiu1,Reference Cheng and Zhang27 the standard Gibbs free energy of formation of 1 mole Fe–Al intermetallic compound could be expressed as follows respectively:
 $$\Delta {G^\theta }\left( {{\rm{F}}{{\rm{e}}_3}{\rm{Al}}} \right) = - 67,659 + 90.77T\quad {\rm{,}}$$
 $$\Delta {G^\theta }\left( {{\rm{FeAl}}} \right) = - 58,950 + 15.99T\quad {\rm{,}}$$
 $$\Delta {G^\theta }\left( {{\rm{FeA}}{{\rm{l}}_2}} \right) = - 102577 + 33.20T\quad {\rm{,}}$$
 $$\Delta {G^\theta }\left( {{\rm{F}}{{\rm{e}}_2}{\rm{A}}{{\rm{l}}_5}} \right) = - 25,3971 + 85.91T\quad {\rm{,}}$$
 $$\Delta {G^\theta }\left( {{\rm{FeA}}{{\rm{l}}_3}} \right) = - 142,770 + 50.58T\quad {\rm{,}}$$
 $$\Delta {G^\theta }\left( {{\rm{F}}{{\rm{e}}_4}{\rm{A}}{{\rm{l}}_{13}}} \right) = - 659,915.8 + 272.32T\quad {\rm{,}}$$
where T was absolute temperature. During MIG welding process, the Fe atoms dissolve and diffuse into molten WZ, and reacted with Al atoms from molten AZ31 Mg alloy. Since Al content in the weld is limited to 3.17% in this experiment and Fe atoms were relatively sufficient at the interface regions, the formation of intermetallic compounds was determined by Gibbs free energy of formation of 1 mole Al atoms compound. From the Eqs. (1)–(6), it can be concluded that the Gibbs free energy of intermetallic compounds formation gradually decreased with increasing Al content. The Gibbs free energy of Fe3Al was the highest, and when the temperature ranged from the melting point of Mg alloy to the melting point of steel, Fe3Al could not form because ΔG(Fe3Al) > 0. It was in accordance with former results. However, the TEM results showed that only FeAl phase existed in the interface of Mg/steel MIG welded-brazed joint, the Fe2Al5 and Fe4Al13 phases with lower ΔG was not found. This was because that the thermodynamic calculation with Eqs. (1)–(6) which was associated with formation of the compounds was done in equilibrium state, and it predicted the kinds of compounds would be formed theoretically. In MIG welding process, the interface reaction between molten Mg alloy and solid steel was conducted in nonequilibrium state. Besides ΔG, the effects of growth dynamics condition, such as interface peak temperature and reaction time on formation of compounds layer were more important.
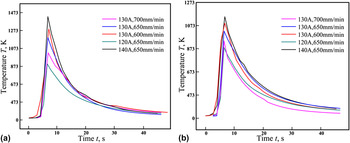
Therefore, it became indispensable to study kinetics of growth of the intermetallic compounds. Interface characteristic in Sec. III. A. showed that the thickness of the intermetallic compounds was influenced by temperature distribution of Mg/steel interface, which was determined by welding parameter. Figure 8 showed the weld thermal cycle curves recorded by thermocouples during MIG welding at different welding parameters. With increasing the welding current or decreasing the welding speed, the interface temperature and reaction time (≥873 K) between liquid Mg alloy and solid steel increased at the whole interface regions, which resulted in the formation of thicker intermetallic compound layer (Figs. 4 and 5). Taking the parameter of 130 A and 650 mm/min for example, it can be seen that the temperature distribution was uneven along the interface, and the upper interface had relatively high temperature. In the upper interface, the interface temperature was relatively high and reaction time was relatively long, so the diffusion and reaction process was drastic and the compound layer was thick. However, in the lower part of the interface, the interface temperature was low, the reaction time was short, and the compound layer was thin. This was consistent with microstructure of the interface layer as shown in Fig. 3.
Weld thermal cycle curves during MIG welding at different welding parameters (a) at upper interface, (b) at lower interface.

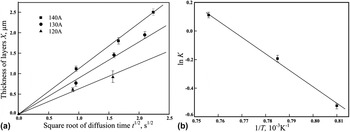
Figure 9(a) showed the relationships between the thickness of FeAl layers and the square root of reaction time for the specimens welded at 120, 130, and 140 A, respectively. It was suggested that the growth of these intermetallic layers was diffusion-controlled because the thickness of the layers demonstrated a linear relationship with the square root of reaction time. It was well known that the equation of such growth of layers consisting of intermetallic layer of thickness X and reaction time t were:
 $$X = K{t^{{1 \mathord{\left/ {\vphantom {1 2}} \right. \kern-\nulldelimiterspace} 2}}}\quad ,$$
and
 $$K = {K_0}\,\exp ({{ - Q} \mathord{\left/ {\vphantom {{ - Q} {RT}}} \right. \kern-\nulldelimiterspace} {RT}})\quad ,$$
where K 0 was a constant, R was the gas constant, Q was the activation energy for growth of the layer, and T was the absolute temperature (the average of the peak temperature in this experiment). Reference Kobayashi, Yakou, Kobayashi and Yakou28 As predicted from Eq. (7), the slope of the straight lines in Fig. 9(a) was determined by K. Figure 9(b) showed the relationships between the logarithmic plot of K and the reciprocal of the absolute temperature l/T. It can be seen that linear relationships exist between K and l/T. As predicted from Eqs. (7) and (8), the slope of the straight lines in Fig. 9(b) was determined by Q/R and hence we can obtain the activation energy Q for growth of the intermetallic layers. The activation energy obtained for the FeAl layer was Q FeAl = 195 kJ/mol.
Relationships between thermodynamic parameters: (a) relationship between X and t 1/2, (b) relationships between ln K and 1/T.

Above all, the growth behavior displayed particular characteristics due to the great discrepancy for the growth condition between MIG welding and other thermal processes with constant temperature. Reference Kobayashi, Yakou, Kobayashi and Yakou28,Reference Tanaka and Kajihara29 The intermetallic compound layer exhibited unequal thickness along the Mg/steel interface, and the higher thickness was obtained at the upper interface which was due to its higher interface temperature and longer reaction time. A rapid increasing tendency for the thickness of intermetallic compound layer was observed with increasing welding current or decreasing the welding speed. Furthermore, the growth coefficient of FeAl could be expressed as K = K 0 exp(−Q/RT) with Q of 195 kJ/mol in the experimental condition of this study.
C. Mechanical behavior of intermetallic compound layer
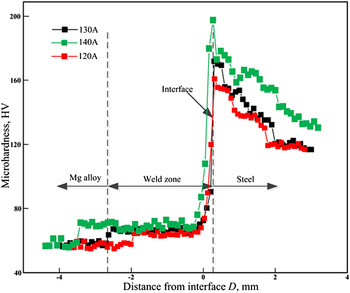
The Vickers microhardness profiles across Mg–steel joints were illustrated in Fig. 10. From Fig. 10, it could be seen that the microhardness distribution was uneven. Mg alloy fusion zone had the lowest microhardness, which was mainly associated with the grain coarsening in this zone. Compared with fusion zone, Mg alloy weld showed higher hardness values because it had a fine equiaxed grain structure. Reference Wang, Sun, Yin and Dong30 The average hardness increased quickly approaching steel base metal and reached the maximum value adjacent to the reaction layer. The presence of FeAl intermetallic compounds with high values of 660 HV Reference Tanaka and Kajihara29 was the main reason for the higher hardness distribution. It was believed that the higher the microhardness, the more brittle the microstructure. Thus, the brittle FeAl at the interface were expected to be the weakest part where the crack was prone to initiate and propagate during tensile test, which could be seen in fracture behavior. Additionally, the welding current had an effect on the joint microhardness. With an increase of the welding current, the microhardness decreased in fusion zone and increased at Mg/steel interface. It can be explained by forming coarser grain in fusion zone and more FeAl intermetallic compounds at the Mg/steel interfaces.
Hardness distribution at different welding currents.

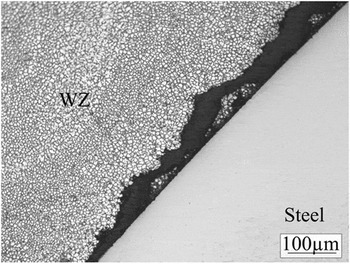
Tensile mechanical properties of MIG butt joints were evaluated by means of standard tensile tests in the transversal direction. The tests were executed at room temperature at a constant speed of 0.05 mm/min. The ultimate tensile strength of butt joints could reach 184.2 MPa at welding current of 135 A and welding speed of 650 mm/min. It was found that FeAl in the Mg/steel interface tend to act as original sites for cracking, as shown in Fig. 11. This was because FeAl phase was harder and more brittle compared with steel substrate and Mg alloy weld. It could also be found that some particles of Mg alloy remained on the fracture of steel side, which was the evidence for the reliable joining of Mg and steel.
Cracking at intermetallic compound layer of partially fractured MIG welded joint.

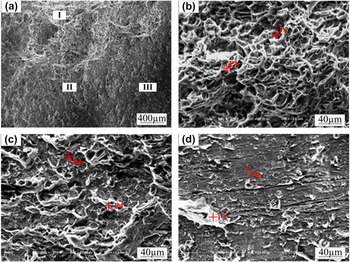
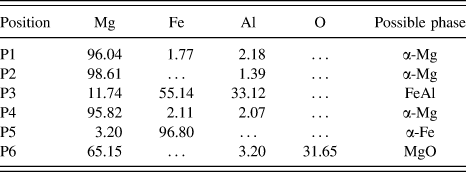
Figure 12 showed the fracture surface morphology of the welded joint obtained at welding current of 135 A and welding speed of 650 mm/min. Three different regions, indicated as I, II, and III, were observed in the fracture surface on the steel side [Fig. 12(a)]. As can be seen, region I exhibited a mixed fracture features with lots dimples and cleavage plane [Fig. 12(b)], region II presented brittle fracture features [Fig. 12(c)] and region III displayed relatively smooth steel surface with less retained Mg alloy [Fig. 12(d)]. The EDS point analysis of each zone (denoted by P1–P6) was performed, and the results were shown in Table III. The fracture surface of region I was mainly composed of α-Mg base phase, and those of region II and region III were mainly composed of FeAl phase, α-Mg base phase and α-Fe base phase, respectively. The reason for the mixed fracture feature lied in the formation characteristics of intermetallic compounds in different interface regions. At the lower interface, the intermetallic compound layer was discontinuous and there existed much oxide, thereby it had a detrimental effect on the mechanical resistance. However, the intermetallic compound layer was relatively thick and uniform at the upper interface, which was favored to lessen stress concentration.
Fracture surface morphology of MIG welded joint at steel side: (a) overview; (b) region I, (c) region II and (d) region III in (a).

EDS analysis results of fracture surface in Fig. 11 (at.%).

Based on above results, the brittle intermetallic compound layer was the weak zone where cracks were apt to derive and propagate. Hence, further efforts should be made to improve the mechanical properties of the Mg/steel interface by controlling the formation and growth of the FeAl intermetallic compounds.
IV. CONCLUSIONS
-
(1) The intermetallic compound layer at Mg/steel interface in MIG welded joint of S235JR steel and AZ31B Mg alloy was mainly composed of FeAl, and the thickness of the intermetallic compound layer varied with different locations along the interface.
-
(2) The formation and growth of the FeAl intermetallic compound was controlled by elements diffusion between solid steel and liquid Mg alloy during MIG welding process. The intermetallic compound layer was relatively thick at the upper interface, attributing to its higher interfacial temperature and longer reaction time. A rapid increasing tendency for the thickness of intermetallic compound layer was observed with increasing the welding current or decreasing the welding speed. The growth coefficient of FeAl intermetallic compound layer could be expressed as K = K 0 exp(−Q/RT) with Q of 195 kJ/mol.
-
(3) The MIG welded joint exhibited interface failure mode during tensile testing. The presence of FeAl intermetallic compounds with high hardness value made the Mg/steel interface layer to be the weak zone where cracks were apt to derive and propagate. The fracture surface of the welded joint displayed both brittle and ductile feature, and mounts of α-Mg and FeAl phases on the fracture surface suggested that the fracture occurred between the Mg alloy WZ and FeAl intermetallic compounds layer.