1 Introduction
Whether individuals in the U.S. are preparing adequately for retirement is an issue that concerns policy-makers and academics alike. Several policies (including Social Security, tax-preferred employment-based retirement plansFootnote 1 and others) exist with an aim to increase the funds that people have available in retirement, and numerous studies over the past few decades have attempted to examine whether individuals are saving enough to fund their years of retirement.Footnote 2 Some recent studies have found that immigrantsFootnote 3 have substantially less wealth, and tend to be less prepared for retirement, than comparable native citizens. At the same time, the share of immigrants in the U.S. population has increased dramatically, from roughly 5% in 1970 to in excess of 10% in recent years (Fix and Passel, Reference Fix and Passel2002; Capps et al., Reference Capps, Fix, Ost, Reardon-Anderson and Passel2005). However, relatively little attention has been paid to differences between these immigrants and natives in retirement plan participation, does there exist much evidence on the reason for any differences that exist. This paper examines the size of, and reasons for, differences between immigrants and natives in retirement plan participation.
Participation in employment-based retirement plans (both defined contribution (DC) and defined benefit (DB)) is relatively widespread. In 2009, for example, approximately 49% of all employees (and 62% of full-time full-year employees aged 21–64) had an employer or union that offered a retirement plan and about 40% of all employees (and 54% of full-time full-year employees aged 21–64) participated in a plan.Footnote 4 In the same year, assets in 401(k)-type DC accounts amounted to slightly over $3.37 trillion, with another $2.10 trillion in assets held in DB plans.Footnote 5 Correspondingly, the cost to the government in foregone revenue due to these savings incentives is quite large, with the tax expenditure on employer and 401(k) plans exceeding $84 billion in 2009.Footnote 6
As noted above, some recent studies have pointed to differences between natives and immigrants in overall asset holdings and in the level of retirement resources in particular, suggesting that immigrants tend to have substantially less wealth and are likely to be less prepared than natives with comparable demographic characteristics. For example, Cobb-Clark and Hildebrand (Reference Cobb-Clark and Hildebrand2006) find that the median wealth level of native-born couples is two-and-a-half times that of their immigrant counterparts and the analogous ratio for singles is around three. Similarly, Osili and Paulson (Reference Osili, Paulson, Michael and Blank2009) find that the median immigrant family has 18% of the wealth of their native counterpart. Osili and Paulson (Reference Osili, Paulson, Michael and Blank2009) also examine the utilization of financial instruments and find that immigrants are significantly less likely to participate in Individual Retirement Accounts (IRA) and Keogh plans even after accounting for differences in demographic and socio-economic characteristics. They do not, however, examine differences in employment-based retirement plans. In a recent working paper, Sevak and Schmidt (Reference Sevak and Schmidt2007) find that male and female immigrants are 11 and 15% less likely, respectively, to report that they have a pension (though the precise definition of having a pension is unclear) and this difference remains when demographic characteristics are controlled for.
Given these findings, a potential way to increase overall retirement wealth would involve closing the gap in retirement plan participation between immigrants and native-born citizens. However, if policy-makers wish to narrow this gap, knowing the reason for the overall difference in participation is crucial for forming the correct policy response.
Clearly, there are several reasons why immigrants might be less likely to participate in retirement plans. First, as is noted in a number of studies,Footnote 7 self-employment rates among immigrants tend to be higher than for natives, and retirement plans available for the self-employed are different from those offered to employees.Footnote 8 Second, because offering a retirement plan is optional for employers, among individuals that work for an employer, immigrants may be less likely to work for an employer that offers a plan to at least some employees. Third, among those that work for an employer that offers a plan, immigrants may be less likely to be covered by their employer's plan. Finally, among those that are covered by an employer's plan, immigrants may be less likely to participate than are natives.
If there is simply a take-up difference between natives and immigrants, allowing and encouraging auto-enrollment of employees in companies’ retirement plans (as was done in the Pension Protection Act of 2006) is likely to go a long way to close the retirement plan participation gap. If, on the other hand, immigrants are less likely to work for a company that even offers a retirement plan, auto-enrollment may have little effect on the retirement savings levels of immigrants.
In this paper, we distinguish between three types of immigrants – naturalized citizens, non-citizen permanent residents (who will be referred to as permanent residents) and non-citizen non-permanent residents (who will be referred to as non-permanent residents). The existing literature on wealth differences between natives and immigrants has tended to lump all types of immigrants together into one group. This may be problematic for two reasons. First, the three types of immigrant are likely to have very different planning horizons given their expected duration in and attachment to the U.S., with naturalized citizens likely having the longest horizons and greatest attachment, and non-permanent residents having the shortest horizons with the least attachment. Combining all three groups into one ‘immigrant’ category, then, is likely to mask significant differences in behavior across each type. Second, the extent to which savings differences between immigrants and natives is a longer run phenomenon that depends on which groups exhibit the difference. For example, if the only significant difference is between non-permanent residents and natives, and those non-permanent residents tend to leave the U.S. before retirement, then the gap between natives and the immigrants that remain would diminish or disappear as a cohort reaches retirement age. On the other hand, if there is a significant difference between naturalized citizens and natives, and naturalized citizens tend to stay in the U.S. during retirement, then the gap between natives and immigrants will remain as a cohort reaches retirement age.
This paper also contributes to a large literature that examines the determinants of participation in retirement savings plans. A number of papers, including Papke (Reference Papke1995), Bassett et al. (Reference Bassett, Fleming and Rodriques1998), Clark and Schreiber (Reference Clark, Schieber, Mitchell and Schreiber1998), Kusko et al. (Reference Kusko, Poterba, Wilcox, Mitchell and Schieber1998), Springstead and Wilson (Reference Springstead and Wilson2000) and Munnell et al. (2001/Reference Munnell, Sunden and Taylor2002), have examined the extent to which participation in employment-based retirement savings plans varies with a wide variety of individual and plan characteristics. These papers have generally found that the probability of participating in a retirement savings plan increases with income, age, job tenure, the existence of an employer match and if the savings plan is the sole retirement plan for the household. In addition, a recent set of papers, including Madrian and Shea (Reference Madrian and Shea2001), Choi et al. (Reference Choi, Laibson and Madrian2004a, Reference Choi, Laibson, Madrian, Metrick and Wiseb) and others, have found that automatic enrollment of workers in employment-based retirement plans (in which workers have to affirmatively opt-out of contributing to the plan) significantly increase the likelihood that a worker contributes to a tax-preferred account.
In this paper, we examine differences in retirement-plan participation (including DC and DB plans) between natives and immigrants using data from the 2001 panel of the Survey of Income and Program Participation (SIPP). We find that the participation rate among natives is 60%, while the gap in participation between natives and immigrants ranges from 10.9 percentage points for naturalized citizens to 35.4 percentage points for non-permanent residents. Controlling for demographic and job characteristics can explain up to half of the gap.
We then perform a decomposition similar to that used in Buchmueller et al. (Reference Buchmueller, Lo Sasso, Lurie and Dolfin2007), which studies health insurance coverage. In so doing, we attempt to decipher the source of the differences in participation by decomposing the overall gaps into intermediate gaps in working for an employer that offers a plan, being covered by a plan that is offered, and participating in an offered plan (or taking-up the offer). We find that differences between natives and immigrants in the likelihood of working for an employer that offers a plan are the primary drivers of the overall difference for each type of immigrant, though differences in take-up also plays a small role.
A potential limitation of this study is that the information on plan offers, eligibility, and take-up come from survey responses rather than administrative data. As a result, non-natives who are less familiar with the details of the retirement plan at their place of employment may be more likely to misreport those details. While this is a legitimate concern, we find that our results are fairly robust even when we focus on workers with long tenure at their current jobs.
Because we find that the gap in participation stems largely from a disparity between natives and immigrants in their likelihood of working for an employer that offers a retirement plan, the results from this paper suggest that policies that focus on increasing take-up among those who are eligible will have little effect on the native–immigrant gap in retirement plan participation. On the other hand, policies aimed at increasing the likelihood that employers offer a plan could help to close the gap.
The paper proceeds as follows. Section 2 describes the data, Section 3 estimates the difference between natives and immigrants in overall participation rates, Section 4 decomposes those differences and Section 5 presents results by tenure at an individual's firm. Section 6 concludes.
2 Data
The paper uses data from the 2001 panel of the SIPP. The SIPP is a longitudinal survey in which respondents are interviewed every 4 months over a 3-year period.Footnote 9 In each wave there is a core survey consisting of questions that are asked at every interview and several topical modules with detailed questions on specific topics.
Information on the availability of an employment-based retirement plan comes from the topical module of Wave 7 that was administered between January and April 2003. In this topical module, individuals that are identified as workers in the core module of Wave 7 are asked first to identify the main job at which they work, and then they are asked about pension plans available at that job. We constructed the following dependant variables from this module. First, we created an indicator variable for whether the employer offered a retirement or pension plan to anyone in the company.Footnote 10 Second, we created an indicator variable for participation in a retirement plan based on the follow-up question regarding whether the respondent is included in the company plan. Third, we created an indicator variable for the individual's eligibility to participate in the retirement plan that we inferred based on their response as to why they did not participate. We defined individuals as not eligible if the reason they gave for not participating was one of the following: no one in their type of job is eligible; they do not work enough hours, days, weeks or months; or they do not have enough tenure in the job. If the individual participated in the plan or if they gave another reason for not participating, we coded them as eligible.
Data on immigration and citizenship status come from the topical module of Wave 2 administered 20 months earlier. The SIPP first asks individuals aged 15 and older about their citizenship status. Individuals can choose one of the following answers: native citizen, naturalized citizen or non-citizen. For individuals who are not citizens, the SIPP asks what their status was when they entered the country. The answers include permanent resident and other options (in the public file we observe only permanent resident and other). If their response was not permanent resident, the follow-up question asks whether their status changed to permanent resident since they arrived. Using these questions, we identify four groups: native citizens, naturalized citizens, permanent residents and non-permanent residents.
To focus on adults in their prime working years, we include in the sample individuals who were between 25 and 64 years of age as of the seventh wave. We remove from the sample individuals who did not respond to the second wave questions on immigration status. In addition, we remove any observation for whom any of the employment-related variables were missing.
The SIPP offers several important advantages for this type of study. First, the SIPP is a nationally representative sample of all ages of respondents. Second, the SIPP identifies whether or not individuals have a retirement plan, whether those that have retirement plans are currently contributing, and if so, how much. Third, the SIPP identifies why individuals are not participating in the plan, which, as described earlier, has important policy implications. Fourth, the SIPP immigration information enables us to observe not just the country of birth but also immigration status, which we expect will affect the decision to participate in long-term benefit programs like retirement plans. It is important to note, however, that the SIPP (like most other surveys) under-represents the number of undocumented immigrants and therefore the fraction of non-permanent residents.
There are two potential weaknesses of using the SIPP, however. The first is that information on retirement plan offer, eligibility, and take-up come from survey responses rather than administrative data. This might be a problem, for example, if those who do not participate in a plan do not fully understand their employer's offerings, and report either that their employer does not offer a plan or that they are not eligible for the plan when the opposite was true, particularly if those with less attachment to the U.S. are more likely to misreport offer and eligibility information. Although such misreporting will not affect the results when we look at overall participation, it may affect the results when we attempt to decipher the reason for the difference in overall participation. In such a case, we may wrongly attribute the differences in overall participation rates to differences in offering or eligibility, when in fact the difference in overall participation was simply due to a difference in take-up.
The second weakness is that the SIPP does not contain information on whether the individual's employer offers a DB plan or a DC plan. This may cause a problem for our results because of the long-term decline in DB coverage and the long-term increase in DC coverage, combined with the fact that participation in DB plans are generally mandatory. If immigrants were more likely to be hired recently under DC plans where participation was voluntary, while natives were more likely to be hired while firms were offering DB plans, there could be a mechanical difference in take-up due to the type of plan. Unfortunately, we only observe the type of plan in which the individual participates if they take-up, so we cannot control for the type of plan being offered by the firm.
To attempt to address these issues, we utilize information on tenure at the individual's current job. One would expect that the greatest gap in plan knowledge across nativity would exist among those with the shortest tenure, since a worker that stays with a firm longer is likely to gain more information about the plan (perhaps through discussion with coworkers or through employer publications) even if they did not participate.Footnote 11 In addition, one would expect those with less tenure to be offered voluntary DC plans, while those with more tenure would be more likely to be covered by mandatory DB plans. As a result, if misunderstandings of lower attachment workers or DB versus DC plan offerings were driving the results, one would expect that differences across nativities would diminish as tenure increases. To examine whether this is the case, in some specifications we split the sample by tenure at the current job.
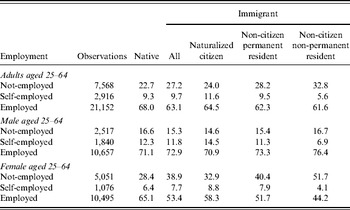
In this paper, we are primarily interested in the difference between immigrant and native employees in their participation in employment-based retirement plans. However, it is important to also understand the differences between immigrants and natives in whether they are employed, self-employed, or non-employed since this status will also impact whether they participate in such a plan. Table 1 shows labor force participation by nativity status and gender. The first panel of the table shows labor force participation of adults aged 25–64, and the second and third panels break up the sample by gender. The first panel suggests that native-born citizens are about 5% more likely to work than any type of immigrant, and immigrants with less attachment to the U.S. are less likely to work compared with immigrants with a greater attachment.Footnote 12 The data also suggest that immigrants overall are more likely to be self-employed than natives, which is consistent with earlier studies. Naturalized citizens and permanent residents are more likely to be self-employed while non-permanent residents are less likely than their native counterparts, and this pattern still holds if we condition on working. Thus, while the analysis that follows will examine differences between native and immigrant employees (and between different types of immigrants) in their propensity to participate in employment-based retirement plans, it is important to keep in mind that additional gaps will exist due to differing rates of employment by a firm.
Labor force participation rates, by gender and nativity status

Note: Weighted data from 2001 SIPP for adults aged 25–64 in the 7th wave who answered the nativity question in Wave 2. All of the rates in this table are reported in percentages.
The second and third panels show that the labor force participation rate among male immigrants is slightly higher than that for native males, and that the labor force participation rate among female immigrants is much lower than that for native females.Footnote 13 In addition, the self-employment rate among males (both native and immigrant) is quite a bit higher than for females. The immigrant and gender differences in labor force participation and in the probability of being an employee suggest that it will be important to also analyze males and females separately in the subsequent analysis.
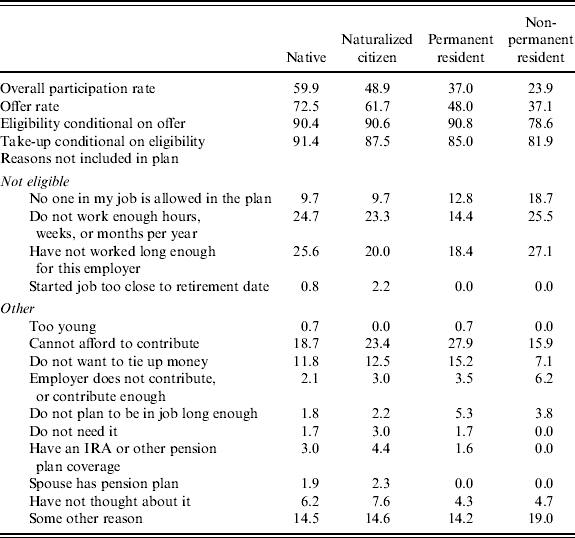
Table 2 presents tabulations of the overall participation rate, offer rate, eligibility rate conditional on being offered coverage and take-up rate conditional on being eligible. Among natives, the overall participation rate is 59.9%, while among immigrants, the overall participation drops with attachment to the U.S., with 48.9% of naturalized citizens, 37.0% of permanent residents and 23.9% of non-permanent residents participating. The offer rate and the take-up rate conditional on eligibility follow a similar pattern. However, the eligibility rate conditional on being offered a plan is roughly constant across natives, naturalized citizens and permanent residents, though non-permanent residents report a rate about 12 percentage points lower.
Sample participation, eligibility, take-up and reasons for not being included in employer pension plan, by nativity
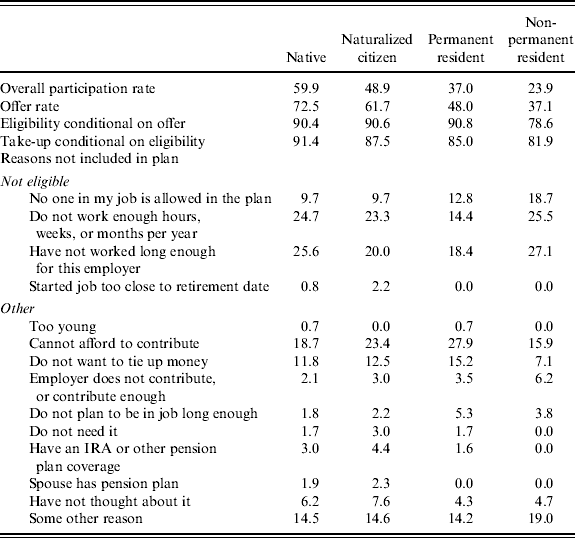
Note: Data from 2001 SIPP for adults aged 25–64 in the 7th wave who answered the nativity question in Wave 2. All of the entries in this table are reported in percentages.
Table 2 also presents tabulations of responses for why respondents were not included in a pension plan, by nativity status.Footnote 14 Across all nativity statuses, the two main reasons given for not being eligible were that the respondent did not work enough per year to qualify, or had not worked long enough with their employer. Among natives, only 9.7% answered that no one in their job was allowed in the plan, while 18.7% of non-permanent residents gave this answer. Among other reasons given for not participating, the two primary reasons across nativity statuses were that the respondent felt that they could not afford to contribute, or that they did not want to tie up the money. Among non-permanent residents, 6.2% said that they did not contribute because their employer did not contribute (or contribute enough), whereas only 2.1% of natives gave a similar answer.
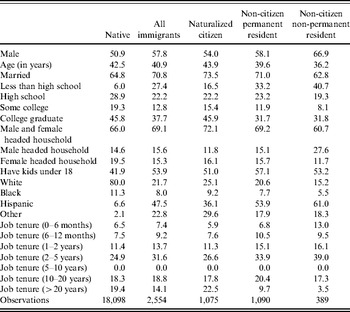
Table 3 shows descriptive characteristics of our employed sample by nativity status. As expected, immigrant workers and especially non-permanent resident workers are more likely to be male, to be younger, to be less educated, and to have kids under 18.
Descriptive characteristics of employed adults aged 25–64, by nativity status

Note: Weighted data from 2001 SIPP are for adults aged 25–64 in the 7th wave who answered the nativity question in Wave 2. For all variables except age, the entries in this table are reported in percentages.
3 Overall participation rates
We begin examining the role of immigration status in retirement plan participation among employees by performing a series of probit regressions for being a participant. We begin with a regression of the form:

where P denotes participating in a plan, and Immigrant is a vector that contains three indicator variables, where the first variable denotes whether the individual is a naturalized citizen, the second denotes whether the individual is a permanent resident and the third denotes whether the individual is a non-permanent resident.
We then add blocks of variables, in sequence, in an attempt to control for differences between natives and immigrants in observable characteristics. We first add a number of demographic characteristics, including age and age-squared, indicators for being male, married, and a married male, indicators for education level, indicators for the type of family, and a dummy variable for presence of children under 18 in the family. We then add a number of job characteristics, including whether the individual is employed full-time versus part-time, a union dummy, indicator variables for tenure at the job, industry dummies, occupation dummies, dummy variables for employer type and dummy variables for firm size.Footnote 15 The most comprehensive specification, then, is of the form:

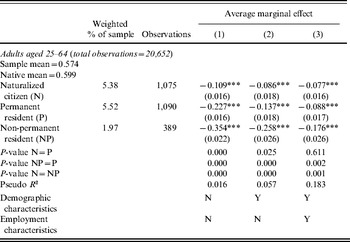
Results from these specifications are presented in Table 4. In this and all subsequent tables, the coefficients presented are the average marginal effects associated with the nativity status indicator variables. Column 1 presents the specification that only includes the immigrant status dummies. In this column, all three immigrant groups are estimated to have lower participation levels than natives, with the gap increasing as the level of attachment to the US decreases. Naturalized citizens are estimated to have a 10.9 percentage point lower participation rate than natives, permanent residents have a 22.7 percentage point lower rate, and non-permanent residents have a 35.4 percentage point lower rate. All of these differences are highly significant, and the differences between the three groups are all significant as well.
Probit estimation of overall participation in employment-based retirement plans, by nativity

Note: Data from 2001 SIPP. Coefficients in the table represent the average marginal difference between natives and each group of immigrants. Robust standard errors are displayed in parentheses. Regression models use population weights. All statistical tests are performed using two-sided t-tests. Model 1 includes naturalized citizen, permanent residents and non-permanent resident indicators. Model 2 includes naturalized citizen, permanent residents and non-permanent resident indicators, age, age-squared, a male dummy, a married dummy, married interacted with male, education dummies (less than high school, HS graduate, some college and college graduate), race indicators (white, black, Hispanic and other), type of family (headed by husband/wife, male headed and female headed), and a dummy for the presence of children under 18 in the family. Model 3 includes all Model 2 variables plus a full-time versus part-time employment dummy, union dummy, tenure at the job dummies (<6 months; 6–12 months; 1–2 years; 2–5 years; 5–10 years; >10 years), industry dummies (agriculture, mining, construction, manufacturing (durables/non-durables), transportation, wholesale trade (durables/non-durables), retail trade, finance, repair services, personal services, entertainment, professional services, public administration and active duty), occupation dummies (managerial and professional specialty; technical, sales and admin support; service; farming, forestry and fishing; precision production, craft and repair; operators, fabricators and laborers; armed forces), employer-type dummies (private for-profit, private not-for-profit, local/state government, federal government and family worker without pay), and firm size dummies (<25, 25–99 and 100+).
***P<0.01, **P<0.05, *P<0.1.
When demographic characteristics are added in Column 2, the gaps shrink somewhat, but all are still highly significant. In addition, the estimated gaps still increase as the level of attachment to the U.S. decreases, with naturalized citizens 8.6 percentage points less likely than natives to participate in an employment-based plan, permanent residents 13.7 percentage points less likely, and non-permanent residents 25.8 percentage points less likely.
Finally, when employment characteristics are added in Column 3, the gaps again decrease.Footnote 16 In total, controlling for the combination of demographics and job characteristics explains about 30% of the gap for naturalized citizens and about 50% of the gap for non-citizens. However, significant differences between natives and all three types of immigrants remain, as does the overall gap increasing with decreasing attachment to the U.S. The difference between naturalized citizens and permanent residents is no longer significant, though all other differences between the immigrant groups are still highly significant.
Overall, these results suggest that, even after controlling for a wide array of demographic and employment characteristics, employment-based retirement plan participation rates for immigrants are lower than the rate for natives, and the differences are both statistically significant and substantial. In addition, even for naturalized citizens, the gap is significant, suggesting that a gap would still remain among a retiring cohort even if immigrants with less attachment to the U.S. were to emigrate to their home countries before retirement.Footnote 17
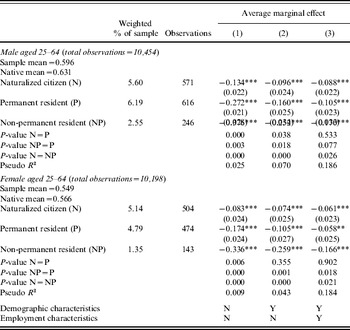
Table 5 presents results from the same set of estimations as in Table 4, but where the sample is split by gender. Given the differences across gender in labor force participation that were seen in Table 1, one may expect differences in retirement savings behavior as well. However, across both males and females, the same broad patterns hold. Large gaps are found when no covariates are included, and the gaps decrease when demographic and employment characteristics are included. However, significant gaps still remain even after controlling for demographic and employment characteristics. In addition, in all specifications, the gap in participation increases as attachment to the U.S. decreases, with naturalized citizens exhibiting the smallest gap and non-permanent residents exhibiting the largest gap. Finally, the gap for naturalized citizen males and permanent resident males appears to be larger than for their female counterparts, though the gap for non-permanent residents is about the same across genders.
Probit estimation of overall participation in employment-based retirement plans, by nativity and gender

Note: Data from 2001 SIPP. Coefficients in the table represent the average marginal difference between natives and each group of immigrants. Robust standard errors are displayed in parentheses. Regression models use population weights. All statistical tests are performed using two-sided t tests. Model 1 includes naturalized citizen, permanent resident and non-permanent resident indicators. Model 2 includes naturalized citizen, permanent residents and non-permanent resident indicators, age, age-squared, a male dummy, a married dummy, married interacted with male, education dummies (less than high school, HS graduate, some college and college graduate), race indicators (white, black, Hispanic and other), type of family (headed by husband/wife, male headed and female headed), and a dummy for the presence of children under 18 in the family. Model 3 includes all Model 2 variables plus a full-time versus part-time employment dummy, union dummy, tenure at the job dummies (<6 months, 6–12 months, 1–2 years, 2–5 years, 5–10 years, 10–20 years and >20 years), industry dummies (agriculture, mining, construction, manufacturing (durables/non-durables), transportation, wholesale trade (durables/non-durables), retail trade, finance, repair services, personal services, entertainment, professional services, public administration and active duty), occupation dummies (managerial and professional specialty; technical, sales and admin support; service; farming, forestry and fishing; precision production, craft and repair; operators, fabricators and laborers; armed forces), employer-type dummies (private for-profit, private not-for-profit, local/state government, federal government and family worker without pay) and firm size dummies (<25, 25–99 and 100+).
***P<0.01, **P<0.05, *P<0.1.
4 Decomposition of participation rates
In this section, we attempt to discern the reason for the differences found above between natives and immigrants (and among different types of immigrants) by decomposing the gap in retirement plan participation into three constituent parts in a manner that closely follows the work in Buchmueller et al. (Reference Buchmueller, Lo Sasso, Lurie and Dolfin2007) . Formally, the probability that an individual participates in a plan can be written as the product of three probabilities:

where O denotes an employer offering a plan to any employee(s), E denotes the individual being eligible for such a plan and T denotes the individual taking up the plan. As a result, the overall difference in participation can be decomposed into differences in an individual's employer offering a plan, differences in being eligible (conditional on having an offer) and differences in take-up (conditional on being eligible).
We estimate each component of the decomposition separately using three probit regressions. The first probit estimates the probability of working for an employer that offers a retirement plan, the second cuts the sample to those who work for a firm that offers a plan and estimates a probit of being eligible for the plan, and the third cuts the sample to those that are eligible for a plan and estimates take-up of the plan. For each set of probits, we begin by including only the individual's immigration status to estimate raw differences, and then add demographic and employment characteristics in turn.
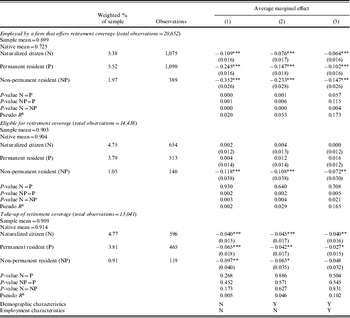
Table 6 presents the results of this decomposition. The first panel presents the results for an employer offering a plan, the second panel presents the results for being eligible conditional on being offered a plan, and the third panel presents the results for taking-up the plan conditional on being eligible.
Probit estimation of employment-based retirement plan offers, eligibility and take-up; by nativity

Note: Data from 2001 SIPP. Coefficients in the table represent the average marginal difference between natives and each group of immigrants. Robust standard errors are displayed in parentheses. Regression models use population weights. All statistical tests are performed using two-sided t tests. Model 1 includes naturalized citizen, permanent residents and non-permanent resident indicators. Model 2 includes naturalized citizen, permanent residents and non-permanent resident indicators, age, age-squared, a male dummy, a married dummy, married interacted with male, education dummies (less than high school, HS graduate, some college and college graduate), race indicators (white, black, Hispanic and other), type of family (headed by husband/wife, male headed and female headed), and a dummy for the presence of children under 18 in the family. Model 3 includes all Model 2 variables plus a full-time versus part-time employment dummy, union dummy, tenure at the job dummies (<6 months, 6–12 months, 1–2 years, 2–5 years, 5–10 years, 10–20 years and >20 years), industry dummies (agriculture, mining, construction, manufacturing (durables/non-durables), transportation, wholesale trade (durables/non-durables), retail trade, finance, repair services, personal services, entertainment, professional services, public administration and active duty), occupation dummies (managerial and professional specialty; technical, sales and admin support; service; farming, forestry and fishing; precision production, craft and repair; operators, fabricators and laborers; armed forces), employer-type dummies (private for-profit, private not-for-profit, local/state government, federal government and family worker without pay) and firm size dummies (<25, 25–99 and 100+).
***P<0.01, **P<0.05, *P<0.1.
Looking first at the top panel, there are large and statistically significant differences between natives and immigrants and across immigrant types in the probability of working for an employer that offers a retirement plan. The unconditional gap in Column 1 is 10.9 percentage points for naturalized citizens, 24.5 percentage points for permanent residents and 35.2 percentage points for non-permanent residents. Controlling for demographic and employment characteristics explains between 40% and 60% of the raw gap, depending on immigrant type. However, the estimated differences in Column 3 are still highly significant, with the gap ranging from 6.4 percentage points for naturalized citizens to 14.7 percentage points for non-permanent residents. Once again, the gap increases as attachment to the U.S. decreases.
In the middle panel, which estimates being eligible conditional on the employer offering, significant differences from natives are only found for non-permanent residents, with a gap of 11.8 percentage points if no additional covariates are included, and a gap of 7.2 percentage points if demographic and employment characteristics are controlled for. In contrast to non-permanent residents, conditional on working for an employer that offers a plan, naturalized citizens and permanent residents are estimated to have about the same rate of eligibility as natives.Footnote 18
In the bottom panel, which presents results for taking-up a plan conditional on being eligible, significant differences from natives are found for all three immigrant types. However, the differences are not significantly different from each other. Controlling for demographic and employment characteristics explains almost half of the gap for permanent residents and non-permanent residents, but none of the gap for naturalized citizens.
Using the results in this table, one can make a back of the envelope calculation of what the effect on the participation rates of each type of immigrant would be if each intermediate gap (offer, eligibility and take-up) were closed while if all other behaviors were to stay the same. Performing this calculation using the results from the specification with the full set of controls suggests that closing the gap in employer offers would result in a 5.1 percentage point increase in participation for naturalized citizens, an 8.3 percentage point increase among permanent residents and a 10.6 percentage point increase among non-permanent residents.Footnote 19 Closing the gap in eligibility would have essentially no effect for naturalized citizens and permanent residents, but would increase participation by 3.6 percentage points for non-permanent residents. Finally, closing the gap in take-up would increase participation by 2.4 percentage points for naturalized citizens, 1.5 percentage points for permanent residents and 2.3 percentage points for non-permanent residents. Taken together, these results suggest that the overall differences in participation are primarily driven by immigrants working for employers that are less likely to offer a retirement plan, with differences in eligibility explaining some of the gap only for non-permanent residents, and differences in take-up explaining a relatively smaller part of the gap for all three groups.
These findings have important policy implications. In recent years, much of the policy effort has been in attempting to increase take-up among those that are eligible, for example, through automatic enrollment.Footnote 20 These results suggest that auto-enrollment will likely make only a small dent in the gap between natives and immigrants, because the overall differences in participation are primarily due to differences between immigrants and natives in working for an employer that offers a plan. Thus, if policy-makers are interested in closing the retirement gap between immigrants and natives, they will need to focus on policies that encourage employers to offer plans, or encourage immigrants to work for employers that offer plans.
We also performed decompositions analogous to those in Table 6 for males and females, respectively. The results for males mirror those for all individuals. Sizable and significant differences are found in the likelihood of employment at a firm that offers a plan and in take-up conditional on eligibility for all immigrant groups. A significant difference is also found for non-permanent residents in being eligible, conditional on working for an employer that offers a plan. In addition, the gap in working for an employer that offers a retirement plan increases with decreasing attachment to the U.S., and the gap in take-up is about the same across all retirement groups. For females, on the other hand, significant differences are only found in working for an employer that offers a plan; all differences in eligibility conditional on an employer offering a plan and in take-up conditional on being eligible are small and insignificant. However, the coefficients from the female specification are not statistically significantly different from those in the male specification.
5 Results by tenure
As was noted above, there are two alternative explanations for these results. The first is that natives may have more tenure, and thus may be more likely to work for an employer that offers a mandatory DB plan, mechanically causing a gap in overall participation and in take-up. The second is that immigrants with less attachment to the U.S. have less information about their employer's plan offerings or eligibility, and answer these questions erroneously, leading to a gap in eligibility and offer that was actually a gap in take-up.
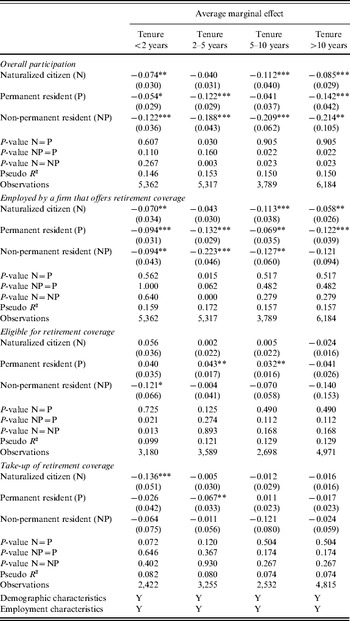
To address both of these concerns, we split the sample into four groups based on the tenure of the individual at their current employer: those with tenure of less than 2 years, those with tenure of 2–5 years, those with tenure of 5–10 years, and those with greater than 10 years of tenure. We then re-ran both the overall participation specification and the decomposition of overall participation rates. These results are presented in Table 7.
Probit estimation of employment-based retirement plan offers, eligibility and take-up; by nativity and job tenure

Note: Data from 2001 SIPP. Coefficients in the table represent the average marginal difference between natives and each group of immigrants. Robust standard errors are displayed in parentheses. Regression models use population weights. All statistical tests are performed using two-sided t tests. Model includes naturalized citizen, permanent residents and non-permanent resident indicators, age, age-squared, a male dummy, a married dummy, married interacted with male, education dummies (less than high school, HS graduate, some college and college graduate), race indicators (white, black, Hispanic and other), type of family (headed by husband/wife, male headed and female headed), a dummy for the presence of children under 18 in the family, a full-time versus part-time employment dummy, union dummy, industry dummies (agriculture, mining, construction, manufacturing (durables/non-durables), transportation, wholesale trade (durables/non-durables), retail trade, finance, repair services, personal services, entertainment, professional services, public administration and active duty), occupation dummies (managerial and professional specialty; technical, sales and admin support; service; farming, forestry and fishing; precision production, craft and repair; operators, fabricators and laborers; armed forces), employer-type dummies (private for-profit, private not-for-profit, local/state government, federal government and family worker without pay), and firm size dummies (<25, 25–99 and 100+).
***P<0.01, **P<0.05, *P<0.1.
The top panel presents results for the overall participation rate. If the results were driven by differences in DB versus DC plan offerings between natives and immigrants, one would expect to see greater gaps in overall participation among those with less tenure, who would be more likely to be covered by a DC plan. However, the results in this panel do not follow this pattern. Among all tenure groups, the gap in participation increases with decreasing attachment to the U.S. In addition, the estimated gap for non-permanent residents is actually smallest for those with the shortest tenure, and the estimated gaps for all three immigrant groups are largest for those with the longest tenure (>10 years).
The next three panels present the results of the decomposition by tenure. If the decomposition results were driven by recent immigrant hires not answering retirement plan questions accurately, one would expect there to be more of a gap in offers and/or eligibility for those with the shortest tenure. These results, however, do not appear to be entirely consistent with that explanation. For offers, those with tenure of 5–10 years have the largest gap between natives and naturalized citizens, while those with tenure of 2–5 years exhibit the greatest gap for permanent and non-permanent residents. In addition, those with the longest tenure exhibit the largest gap in eligibility for non-permanent residents, though this gap is not statistically significantly different than the gap estimated for the other tenure groups. Thus, differences in plan knowledge do not appear to be a primary explanation for the gaps found above.
Overall, these results suggest that the above findings were not primarily driven by differences between natives and immigrants in plan type or in knowledge about plan offerings.
6 Conclusion
In this paper, we used data from the 2001 panel of the SIPP to examine differences between immigrant and native households in employment-based retirement plan participation, while making a distinction between naturalized citizens, permanent residents and non-permanent residents. We found that the participation rate among natives is 60%, while the gap in participation between natives and immigrants ranges from 10.9 percentage points for naturalized citizens to 35.4 percentage points for non-permanent residents. Controlling for demographic and job characteristics explained up to half of the gap, though the gap between natives and immigrants was still smallest for naturalized citizens and largest for non-permanent residents.
Through a decomposition of plan participation, we then explored three potential sources for the gap including differences in employer offers of retirement plans, differences in eligibility and differences in plan take-up. The decomposition results suggested that the overall differences in participation between natives and immigrants were driven by differences in the likelihood of working for an employer that offers a plan. Differences in take-up also played a role in explaining the gap for men, but played no role in the gap for women.
Some limitations of this study should be kept in mind. First, since we are using a cross-section of data, we are examining how participation in retirement plans varies with immigration status as it exists at a point in time. Thus, it is unclear from this study to what extent a change in an individual's immigration status (from permanent resident to naturalized citizen, for example) would affect their retirement plan participation behavior. Second, it is not possible to identify immigrants who are residing in the country illegally in this dataset. Finally, as noted above, the information on plan details came from survey responses rather than administrative data, and so non-natives who are less familiar with the details of the retirement plan at their place of employment may be more likely to misreport those details. However, the results were fairly robust even when we focused on workers with long tenure at their current jobs.
Given that immigrants are shown to be less likely to participate in retirement plans than natives, policy-makers may be interested in closing this gap. Although recent legislation has encouraged automatic enrollment in plans to increase take-up among those that are eligible, the results from this paper suggest that such policies, though they may have other worthwhile effects, will have little effect on the native–immigrant gap in retirement plan participation. Rather, the results from the decomposition suggest that focusing on policies that increase employer offers of retirement plans, particularly among firms that hire large numbers of immigrants, are more likely to be successful.
Appendix
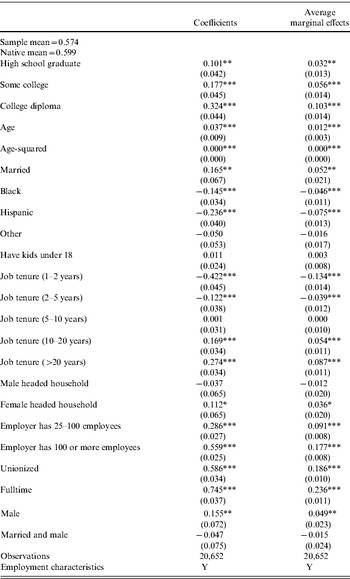
Probit estimation of overall participation in employment-based retirement plans, regression coefficients and average marginal effects for a select group of variables

Note: Data from 2001 SIPP. Robust standard errors are displayed in parentheses. Regression models use population weights. All statistical tests are performed using two-sided t-tests. Model also includes naturalized citizen, permanent residents and non-permanent resident indicators, industry dummies (agriculture; mining; construction; manufacturing (durables/non-durables); transportation; wholesale trade (durables/non-durables); retail trade; finance; repair services; personal services; entertainment; professional services; public administration; active duty), occupation dummies (managerial and professional specialty; technical, sales, and admin support; service; farming, forestry, and fishing; precision production, craft, and repair; operators, fabricators, and laborers; armed forces), and employer type dummies (private for-profit; private not-for-profit; local/state government; federal government; family worker without pay).
***p<0.01, **p<0.05, *p<0.1.
 , the employee may make penalty-free withdrawals from the balance of the account, which will consist of all contributions plus any investment returns. Contributions to DC plans are excludable from income when figuring taxable income and plan assets grow tax free, but distributions from the plan (including contributions and account earnings) are taxable. Cash balance plans are a hybrid of DC and DB plans. Under a cash balance plan, a notional account is set up for each employee, but actual funds are pooled and invested by the employer. For a detailed explanation of the different types of plans, see Copeland (