

Introduction
According to the U.S. Census Bureau (2012), by the year 2020 over 39 million adults over age 65 will be active drivers. Older adults are involved in a disproportionate number of driving accidents, second only to that of drivers younger than 25 (Hunt & Arbesman, Reference Hunt and Arbesman2008). More knowledge about factors that identify which older adults are at risk for driving accidents, as well as training that may lower that risk, is a critical need. As not all older drivers are at risk for driving accidents, it is important to identify individual difference factors that predict driving risk.
There is a clear link between global cognitive dysfunction (i.e., dementia) and driving risk (Apolinario et al., Reference Apolinario, Magaldi, Busse, da Costa Lopes, Kasai and Satomi2009; Iverson, Gronseth, Reger, Classen, & Dubinsky, Reference Iverson, Gronseth, Reger, Classen and Dubinsky2010; Mans-Son-Hing, Marshall, Molnar, & Wilson, Reference Mans-Son-Hing, Marshall, Molnar and Wilson2007). It is also important to understand driving risks outside of global cognitive dysfunction, given known aging-related changes to cognitive domains (Richardson & Morattoli, Reference Richardson and Marottoli2003; Salthouse, Reference Salthouse2010), as well as the more focal cognitive impairments associated with other neurological conditions and/or mild cognitive impairment, that might be related to driving skill.
Existing research examining driving ability (as measured by crash history, on-road driving evaluations, and driving simulator performance) suggests that measures of processing speed (Baldock, Mathias, McLean, & Berndt, Reference Baldock, Mathias, McLean and Berndt2007; Shanmugaratnam, Kass, & Arruda, Reference Shanmugaratnam, Kass and Arruda2010; Stutts, Stewart, & Martell, Reference Stutts, Stewart and Martell1998), attention (Baldock et al., Reference Baldock, Mathias, McLean and Berndt2007; Bédard et al., Reference Bédard, Leonard, McAuliffe, Weaver, Gibbons and Dubois2006; Chaparro, Wood, & Carberry, Reference Chaparro, Wood and Carberry2005; Hoffman, McDowd, Atchley, & Dubinsky, Reference Hoffman, McDowd, Atchley and Dubinsky2005; Parasuraman & Nestor, Reference Parasuraman and Nestor1993; Richardson & Marotolli, Reference Richardson and Marottoli2003), visuospatial and visuoconstructional abilities (De Raedt & Ponjaert-Kristoffersen, Reference de Raedt and Ponjaert-Kristoffersen2001; Stav, Justiss, McCarthy, Mann, & Lanford, Reference Stav, Justiss, McCarthy, Mann and Lanford2008; Zook, Bennett, & Lane, Reference Zook, Bennett and Lane2009), and executive functioning (Daigneault, Joly, & Frigon, Reference Daigneault, Joly and Frigon2002; Whelihan, DiCarlo, & Paul, Reference Whelihan, DiCarlo and Paul2005; Zook et al., Reference Zook, Bennett and Lane2009) are among the strongest cognitive predictors of driving ability in healthy older drivers (Anstey, Wood, Lord, & Walker, Reference Anstey, Wood, Lord and Walker2005; Mathias & Lucas, Reference Mathias and Lucas2009). Useful Field of View, which measures speeded visual discrimination and selective attention, is also predictive of driving ability, with a large effect size (Clay et al., Reference Clay, Wadley, Edwards, Roth, Roenker and Ball2005), and now used in some U.S. states (e.g., Florida, Maryland, California) to screen older adult drivers (Lade, Reference Lade2001; Viamonte, Vance, Wadley, Roenker, & Ball, Reference Viamonte, Vance, Wadley, Roenker and Ball2010). Continued research on the neurocognitive correlates of driving has tremendous potential to assist in identifying individuals at risk for driving accidents.
Another important area of research in driving ability is hazard perception. Hazard perception is the ability to identify potentially dangerous situations while driving (Horswill & McKenna, Reference Horswill and McKenna2004). The process by which a driver must detect a situation, determine whether or not it is a hazard, and react to the hazard must occur within a very limited time frame; the faster a driver accomplishes this task, the less risk of crash involvement at any age (Jackson, Chapman, & Crundall, Reference Jackson, Chapman and Crundall2009; Horswill et al., Reference Horswill, Marrington, McCullough, Wood, Pachana, McWilliam and Raikos2008; Wallis & Horswill, Reference Wallis and Horswill2007). Prior research has documented that novice drivers are generally worse at hazard perception as compared to experienced drivers (Scialfia, Borkenhagen, et al., Reference Scialfa, Borkenhagen, Lyon, Deschênes, Horswill and Wetton2012), and there is evidence that hazard perception skills can be trained to improve the safety of novice drivers (Beanland, Goode, Salmon, & Lenne, Reference Beanland, Goode, Salmon and Lenne2013; Horswill, Taylor, Newman, Wetton, & Hill, Reference Horswill, Taylor, Newnam, Wetton and Hill2013; Pollatsek, Narayanaan, Pradhan, & Fisher, Reference Pollatsek, Narayanaan, Pradhan and Fisher2006). However, even though hazard perception improves with driving experience and training, there is some recent evidence that hazard perception declines in older age (Horswill et al., Reference Horswill, Marrington, McCullough, Wood, Pachana, McWilliam and Raikos2008, Reference Horswill, Pachana, Wood, Marrington, McWilliam and McCullough2009; Scialfa, Deschênes, et al., Reference Scialfa, Deschênes, Ference, Boone, Horswill and Wetton2012).
There is evidence of the importance of hazard perception to good driving (Horswill, Anstey, Hatherly, & Wood, Reference Horswill, Anstey, Hatherly and Wood2010; Jackson et al., Reference Jackson, Chapman and Crundall2009; McKenna & Horswill, Reference McKenna and Horswill1999; Pelz & Krupat, Reference Pelz and Krupat1974; Quimby, Maycock, Caarter, Dixon, & Wall, Reference Quimby, Maycock, Carter, Dixon and Wall1986; Smith, Horswill, Chambers, & Wetton, Reference Smith, Horswill, Chambers and Wetton2009; Wetton et al., Reference Wetton, Horswill, Hatherly, Wood, Pachana and Anstey2010; Wood, Horswill, Lacherez & Anstey, Reference Wood, Horswill, Lacherez and Anstey2013), even in older adults (Horswill, Anstey, Hatherly, & Wood, Reference Horswill, Anstey, Hatherly and Wood2010; Wood et al., Reference Wood, Horswill, Lacherez and Anstey2013). There also is preliminary evidence of a decline in hazard perception skills with older age (Horswill et al., Reference Horswill, Marrington, McCullough, Wood, Pachana, McWilliam and Raikos2008, Reference Horswill, Anstey, Hatherly and Wood2010; Scialfa, Deschênes, et al., Reference Scialfa, Deschênes, Ference, Boone, Horswill and Wetton2012). Thus, it would be useful to know what individual differences predict hazard perception ability in older adults, as this could lead to better screening for driving risk, as well as indicate who would benefit most from hazard perception interventions to help older adults improve or maintain driving ability.
The purpose of the present study was to examine the neuropsychological correlates of hazard perception in older adults without dementia. Given prior research literature suggesting that psychomotor processing speed and visuospatial/constructional abilities are related to driving ability, we hypothesized that these skills would also be associated with hazard perception skills. In addition, given evidence that executive functioning skills such as divided attention and selective attention, cognitive flexibility and inhibition may also be related to driving ability, as well as some preliminary evidence of their relationship to hazard perception skills (Horswill et al., Reference Horswill, Marrington, McCullough, Wood, Pachana, McWilliam and Raikos2008), we hypothesized that executive function skills would also be associated with hazard perception skills. Finally, we explored the relationship of memory ability to hazard perception. While, as noted above, dementia has been strongly linked to driving risk, memory ability has received comparatively little attention relative to other neuropsychological domains in driving studies of healthy older adults (Mathias & Lucas, Reference Mathias and Lucas2009). Nevertheless, it is possible memory is needed to encode schemas of driving scenarios and recognize potential hazards.
Method
Participants
A total of 68 participants were recruited from a small Midwestern community through ads placed in local newspapers, word of mouth, and fliers posted at various locations throughout the community, as well as from among a participant pool available through the second authors’ research laboratory. All participants (1) were 60 years old or older; (2) were fluent in written and spoken English; (3) had a current valid driver’s license; (4) were active drivers over the previous 2 years; (5) reported no major medical or neurological conditions that may impact cognitive skills, including but not limited to dementia, head trauma, brain tumors, seizure disorder, stroke, major cardiovascular or ischemic incidents, or currently undergoing chemotherapy; and (6) did not appear to have evidence of global cognitive impairment, as judged by a dementia screen. Four participants were excluded from data analysis due to potential visual problems (see below). Thus, the final sample consisted of 22 male and 42 female healthy aging older adults between the ages of 60 and 88 (M=70.36; SD=6.88), and with levels of education that ranged from 9 to 24 years (M=16.92; SD=3.03). Of the participants in the sample, 63 identified themselves as Caucasian and 1 identified as African American.
On average, participants started driving at age 17 (M=17.55; SD=3.01; range 15–28). All participants reported being active drivers during the 2 years before study participation. The vast majority (92.2%) reported they drive on a daily basis, while 4.7% described themselves as weekly drivers and 3.1% stated they drove monthly or less frequently. A little over half (56.3%) reported they had modified their driving habits compared to when they were younger, with the most common driving modification being avoidance of night driving. Most drivers (92.2%) reported no accidents in the past year, but 39.1% reported near misses in the past year. Few (6.3%) reported traffic violations in the past year, while 18.8% reported getting lost while driving in the past year.
Procedure
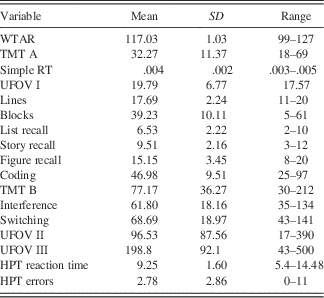
All data were collected in compliance with the institutional review board at Ohio University. After completion of informed consent, participants completed a short semi-structured interview during which demographic information and medical history was collected and driving history was obtained. Then, neuropsychological tests were administered, followed by the hazard perception test (see Table 1 for participant descriptive statistics on all study variables). After completion of the tests, participants were offered clinical feedback on their cognitive abilities. All assessment measures were administered by trained graduate students or trained undergraduate students under the direct supervision of a graduate student. Clinical feedback was provided by the second author (a licensed psychologist) or by trained graduate students with neuropsychological assessment experience under the supervision of the second author. The entire procedure, including review of consent forms and feedback, took between 2.5 and 3 hr to complete.
Descriptive statistics for independent and dependent variables in the study

Note. WTAR = Wechsler Test of Adult Reading; TMT = Trail Making Test; Simple RT = Simple Reaction Time Task; UFOV = Useful Field of View; Lines = Repeatable Battery for the Assessment of Neuropsychological Status – Line Orientation Subtest; Blocks = Wechsler Test of Adult Intelligence – Block Design Subtest; List Recall = Repeatable Battery for the Assessment of Neuropsychological Status – List Recall Subtest; Story Recall = Repeatable Battery for the Assessment of Neuropsychological Status – Story Recall Subtest; Figure Recall = Repeatable Battery for the Assessment of Neuropsychological Status – Figure Recall Subtest; Coding = Repeatable Battery for the Assessment of Neuropsychological Status – Coding Subtest; Interference = Delis-Kaplan Executive Function System – Color-Word Interference Test – Inhibition Score; Switching = Delis-Kaplan Executive Function System – Color-Word Interference Test – Switching Score; HPT = Hazard Perception Test.
Materials and Measures
Following the standard set by previous studies of cognitive correlates of either driving or hazard perception, only raw data from cognitive measures were used in data analysis. Driving and hazard perception are believed to require absolute cognitive demands that are the same for all drivers, and adjusting for demographic variables diminishes the predictive accuracy of cognitive measures (Anstey, Horswill, Wood, & Hatherly, Reference Anstey, Horswill, Wood and Hatherly2012; Barrash et al., Reference Barrash, Stillman, Anderson, Uc, Dawson and Rizzo2010; Horswill et al., Reference Horswill, Marrington, McCullough, Wood, Pachana, McWilliam and Raikos2008, Reference Horswill, Pachana, Wood, Marrington, McWilliam and McCullough2009).
Repeatable Battery for the Assessment of Neuropsychological Status
The Repeatable Battery for the Assessment of Neuropsychological Status (RBANS) is a comprehensive, yet relatively brief, measure designed to screen for dementia and other cognitive impairment. The RBANS is composed of 12 subtests that measure immediate and delayed memory, language, attention, and visuospatial/constructional abilities (Randolph, Reference Randolph2012). The RBANS Composite score was used to confirm that no participants were experiencing global cognitive decline. Age- and education-corrected standard scores from all RBANS subtests were used to give clinical feedback to study participants. For the purposes of testing study hypotheses, raw scores from Coding, Line Orientation, List Recall, Story Recall, and Figure Recall were evaluated for their relationship to hazard perception. To minimize practice effects, participants who had previously participated in cognitive screening studies in the same laboratory were administered an alternative, but equivalent RBANS form. Thus, participants who were administered RBANS form A during participation in a previous study were administered RBANS form B in the present study and vice versa.
Trail Making Test A and B
The Trail Making Test (TMT) (Reitan & Wolfson, Reference Reitan and Wolfson1985) is a two-part test (parts A and B). Part A consists of a series of circles with the numbers 1–25 scattered on a sheet of paper. Individuals are asked to draw a line from one circle to the next following the sequential order of the numbers until all the encircled numbers are connected. They are asked to complete each of these tasks as quickly as they can without making mistakes. Part B consists of encircled numbers (1–13) and letters (A–L). Individuals are asked to connect the circles alternating between numbers and letters as quickly as they can without making mistakes.
The TMT is a well-validated measure of psychomotor processing speed and cognitive switching. For the purposes of our analyses, Part A was used as a measure of processing speed and Part B as a measure of executive functioning.
Delis-Kaplan Executive Function System – Word-Color Interference Test
The Word-Color Interference Test (CWIT) from the Delis-Kaplan Executive Function System (D-KEFS; Delis, Kaplan, & Kramer, Reference Delis, Kaplan and Kramer2001) is designed to measure executive inhibition. It includes two basic naming conditions and an interference condition that are similar to the traditional Stroop (Stroop, 1935) measure. In addition to the traditional Stroop tasks, the CWIT of the D-KEFS includes a final switching condition. The Interference and Switching conditions of this measure were used as measures of executive function domains of inhibition and cognitive switching.
Block Design
The Block Design subtest of the Wechsler Adult Intelligence Scale-IV (Wechsler, Reference Wechsler2008) was used as a measure of visuospatial/ constructional abilities. The subtest requires individuals to use four to nine red and white colored blocks (the number of blocks is dictated by the item number) to replicate a design presented as a two-dimensional image on a page.
Wechsler Test of Adult Reading
The Wechsler Test of Adult Reading (Wechsler, 2001) was used as an estimation of general intellectual functioning. This measure consists of a reading recognition task in which individuals are asked to read aloud a list of 50 words.
Useful Field of View
The Useful Field of View (UFOV; Visual Awareness Research Group, 2009) includes three subtests that assess processing speed, divided attention, and selective attention, respectively. In subtest I, participants see a figure flash inside a small box in the middle of the computer screen and are immediately prompted to identify whether the flashing image was a car or a truck. As the items progress, the duration of the stimulus presentation on the screen is gradually reduced until the viewer starts responding with less than 75% accuracy. The normal processing speed threshold is ≤30 ms.
As in subtest I, in subtest II individuals see a flashing image in a small box located in the middle of the screen. The added component in this subtest is an object (car or truck) that flashes in unison with the first image, but appears in the periphery of the screen. Individuals are then asked to identify the image that flashed in the middle of the screen as a car or a truck and are also asked to identify the location of the image that flashed in the periphery of the screen by selecting from eight spokes radiating from the center of the screen that point to various positions in the screen’s periphery. Normal divided attention is ≤100 ms.
The third subtest is similar to subtest II, but this time the flashing image in the periphery is embedded among a radiating array of distractors. The normal selective attention threshold is ≤350 ms.
The raw score for subtest I was used as a measure of processing speed and vision. As noted in the Participants section, data for 4 individuals who failed this subtest were removed from analysis because failing scores are indicative of poor vision (Owsley, Ball, & Keeton, Reference Owsley, Ball and Keeton1995; Visual Awareness Research Group, 2009), and poor vision could be responsible for poor performance on other tasks. The raw scores of subtests II and III were included as measures of attention and executive functioning.
Simple Reaction Time Task
The simple reaction time task in the present study was modeled after a reaction time task designed to be administered in conjunction with the Hazard Perception Test and described by Scialfa et al. (Reference Scialfa, Deschênes, Ference, Boone, Horswill and Wetton2011). The test was presented on a touch-sensitive 17-inch LCD monitor (ELO TouchSystems 1729L) with a 1280×1024 resolution. The monitor was set at an approximate viewing distance of 19.5 inches. In this task, black boxes of different sizes appeared at varying locations throughout the screen. The size and location of the boxes correlated with the size and location of first appearance of a hazard in the Hazard Perception Test. Participants were asked to touch the boxes as quickly as possible. Visual feedback was provided to participants via a yellow circle that appeared on the screen at the point of contact to let participants know their response was detected by the computer program.
Hazard Perception Test
The Hazard Perception Test (HPT) implemented in the present study follows the guidelines set forth by Scialfa et al. (Reference Scialfa, Deschênes, Ference, Boone, Horswill and Wetton2011). The HPT consists of short videos (ranging in length from 10 to 60s) presented on a touch-screen monitor. The reaction time to the hazard is defined as the amount of time that transpires between the first appearance of a hazard on the screen to the moment the hazard is accurately touched on the screen. Reaction time is measured in milliseconds. The error score consists of the number of hazards individuals fail to identify throughout the task. The videos were presented on a touch-sensitive 17-inch LCD monitor (ELO TouchSystems 1729L) with a 1280×1024 resolution. The monitor was set at an approximate viewing distance of 19.5 inches.
The set of videos presented were filmed and standardized using a population of young adults by Scialfa and colleagues at the University of Calgary (Scialfa et al., Reference Scialfa, Deschênes, Ference, Boone, Horswill and Wetton2011). In 2012, Scialfa and colleagues compared the performance of young versus older adults on the HPT. They found older adults were slower at detecting target hazards than their younger counterparts.
There are a total of 26 videos; 17 videos present hazards and the remaining nine do not contain any hazards. Scialfa and colleagues (2011, 2012; Scialfa, Borkenhagen, Lyon, & Deschénes, Reference Scialfa, Borkenhagen, Lyon and Deschênes2013) reported valid and reliable results using a set of 96 videos. The shorter version used in the present study uses a subset of the 96 videos used in previous studies. The long and short versions of this measure have similar ratios between videos with and without hazards. In the long version 67% contain hazards while 33% of the videos do not. In the short version 65% of the videos have hazards while 35% do not. Scialfa, Pereversev, and Borkenhagen (Reference Scialfa, Pereversev and Borkenhagen2014) reported a reliability study of the shorter version of the HPT with a sample of young adults, which yielded a Cronbach’s alpha of .75 when internal consistency was studied. Scialfa et al. (Reference Scialfa, Pereversev and Borkenhagen2014) also reported a short-term (mean number of days between testing=27.58) test–retest reliability of .72. As previously stated, hazard perception tests have been found to correlate with on-the-road test driving (De Raedt & Ponjaert-Kristoffersen, Reference de Raedt and Ponjaert-Kristoffersen2000) and risk of motor vehicle accident (Sims, McGwin, Allman, Ball, & Owsley, Reference Sims, McGwin, Allman, Ball and Owsley2000). Average reaction time to hazards and absolute number of errors were used as the dependent variables in the present study. HPT error scores were determined by counting the number of driving scenarios in which each participant did not identify the target hazard.
Results
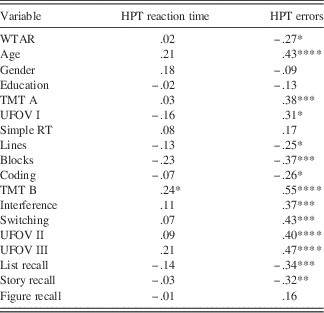
Age, education, gender, and estimated intellect were not significantly related to HPT reaction time, while both age and estimated intellect were related to HPT errors (see Table 2 for correlations of study variables with hazard perception ability). However, age was not controlled for in subsequent analyses because, as noted above, it would likely remove variance from expected age-related changes in functioning, rather than variance from age itself as a stand-alone variable, and, as noted above, driving and the various abilities that allow for safe driving (including hazard perception) should be assessed based on absolute performance, without adjusting for demographic variables such as age.
Correlations of study variables with hazard perception ability
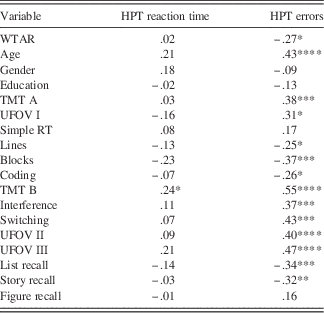
Note. WTAR = Wechsler Test of Adult Reading; TMT = Trail Making Test; Simple RT=Simple Reaction Time Task; UFOV = Useful Field of View; Lines=Repeatable Battery for the Assessment of Neuropsychological Status – Line Orientation Subtest; Blocks=Wechsler Test of Adult Intelligence – Block Design Subtest; List Recall=Repeatable Battery for the Assessment of Neuropsychological Status – List Recall Subtest; Story Recall=Repeatable Battery for the Assessment of Neuropsychological Status – Story Recall Subtest; Figure Recall=Repeatable Battery for the Assessment of Neuropsychological Status – Figure Recall Subtest; Coding=Repeatable Battery for the Assessment of Neuropsychological Status – Coding Subtest; Interference = Delis-Kaplan Executive Function System – Color-Word Interference Test – Inhibition Score; Switching=Delis-Kaplan Executive Function System – Color-Word Interference Test – Switching Score; HPT=Hazard Perception Test.
*p<.05.
**p<.01.
***p<.005.
****p<.001.
Hypotheses testing revealed no processing speed or visuospatial/constructional measures were related to HPT reaction time, but higher number of HPT errors was related to worse performance on Line Orientation and Block Design (small to medium effect sizes) and slower reaction time on both TMT A and UFOV part I (medium effect sizes). HPT reaction time was significantly related to TMT B (small effect size). Higher number of HPT errors was associated with all executive function measures, including lower performance on Coding (small effect size), slower performance on TMT B, Interference, and Switching (medium to large effect sizes), and worse performance on both UFOV part II and part III (medium effect sizes). Finally, exploration of the relationship of memory performance to hazard perception showed that memory was not related to HPT reaction time, but a higher number of HPT errors was related to poorer list recall and story recall (medium effect sizes).
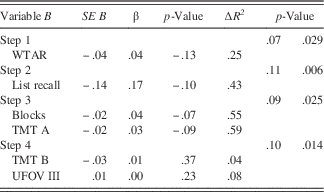
To determine how much variance in HPT errors could be accounted for by these cognitive constructs, we conducted a hierarchical linear regression, using measures with the highest correlations from each cognitive domain. We controlled for estimated intellect on the first step. We then entered List Recall to represent the memory construct, followed by Block Design and TMT A to represent visuospatial/constructional skills and processing speed, respectively. Finally, we entered executive function measures (TMT B and UFOV part III) on the final step. Estimated intellect accounted for 7% of the variance in HPT errors, F(1,65)=4.96, p=.029. Memory accounted for an additional 11% of variance in HPT Errors, F change (1,64)=8.22, p=.006. Visuospatial and constructional measures accounted for an additional 9% of variance in HPT errors after accounting for intellect and memory, F change (2,62)=3.93, p=.025. Finally, after entering all other variables, executive function measures accounted for an additional 9.7% of the variance in HPT errors, F change (2,60)=4.61, p=.014. Overall, the neuropsychological variables accounted for 36.7% of variance in HPT errors, F(6,60)=5.79, p<.001. With all variables in the model, the only independent predictor was TMT B (see Table 3).
Linear regression model for explaining variance in hazard perception errors

Note. WTAR= Wechsler Test of Adult Reading; TMT=Trail Making Test; UFOV=Useful Field of View; Blocks=Wechsler Test of Adult Intelligence – Block Design Subtest; List Recall=Repeatable Battery for the Assessment of Neuropsychological Status – List Recall Subtest.
Discussion
Results of the present study suggest that neuropsychological measures are related to hazard perception skills in older adults without global cognitive impairment/dementia. Of interest, average HPT reaction time was only related to TMT B, while HPT errors was related to many neuropsychological variables, suggesting that cognitive skills were related to overall hazard perception accuracy more than hazard perception speed per se. It is of note that TMT B has emerged in the existing driving literature as a strong predictor of general driving risk (Mathias & Lucas, Reference Mathias and Lucas2009). The relationship between TMT B and HPT reaction time does not seem to be merely because both involve processing speed, given that HPT reaction time was not correlated to other measures of reaction time or processing speed; instead, it is possible that the relationship between the two tasks is because both involve quick visual scanning of a complex environment, as well as motor speed.
Generally, neuropsychological constructs that have been related to other measures of driving skill in existing literature were also significantly associated with HPT errors, including processing speed, visuospatial/constructional skills, and executive functioning. Of note, while there is some preliminary evidence that skills measured by tasks such as UFOV, TMT B, and coding tasks are associated with hazard perception in older adults (Horswill et al., Reference Horswill, Marrington, McCullough, Wood, Pachana, McWilliam and Raikos2008), other cognitive domains (inhibition, visuospatial orientation, visuoconstructional skills) had not been examined to date. In addition, few prior studies of older adults without dementia (e.g., Anderson, Rizzo, Shi, Uc, & Dawson, Reference Anderson, Rizzo, Shi, Uc and Dawson2005) have examined memory tests as predictors of driving skill, with a larger focus on visual memory tests. Even after controlling for general intellect, processing speed, visuconstructional skills, and memory, executive function measures still contributed significant variance to HPT errors.
Overall, neuropsychological variables accounted for 36.7% of the variance in HPT errors, suggesting that, while a neuropsychological battery might provide some useful information regarding hazard perception ability, there are clearly additional variables, not accounted for in the present study, that are important contributors to hazard perception skills in healthy older adults. For example, executive functioning measures that tap abstract reasoning and problem solving (e.g., Matrix Reasoning, Wisconsin Card Sorting Test) were shown to activate brain regions that were significantly correlated with scenes of driving hazards on an fMRI study with an older adult population (Hirth, Davis, Fridriksson, Rorden, & Bonilha, Reference Hirth, Davis, Fridriksson, Rorden and Bonilha2007). These measures were not included in the present study to avoid fatiguing the participants. Another possibility is that non-cognitive variables, such as miles per year driven, which has been previously correlated with risk of involvement in motor vehicle accidents (Lee, Reference Lee2008) could be more predictive of hazard perception ability.
The present study adds to the understanding of risks of driving for older adults by providing preliminary evidence of significant correlations between hazard perception ability and visuospatial/constructional skills, processing speed, memory, and executive functioning in a healthy aging older adult population. Given the limited availability of previous research on hazard perception in this population, it is our hope that the present findings will encourage and guide future research to help promote the maintenance or rehabilitation of cognitive abilities involved in hazard perception. However, the generalizability of the present results is limited due to the nature of our sample, which consisted of highly educated, healthy aging older adults in one geographical region. These preliminary findings should be followed by studies with larger samples more inclusive and representative populations to assist with generalizability of data.
In addition, studying hazard perception in individuals who have been involved in recent accidents, who have reported driving difficulties, or who have been identified by others (e.g., spouses, children) as having driving difficulties might yield more clinically relevant results. It would also be valuable to explore hazard perception in samples with larger variability in their cognitive abilities, including individuals with Mild Cognitive Impairment or mild dementia. In the general driving literature, studies that include individuals with Mild Cognitive Impairment or dementia have shown relationships between driving ability and general cognitive abilities (Bieliauskas, Roper, Trobe, & Lacy, Reference Bieliauskas, Roper, Trobe and Lacy1998; Cooper, Tallman, Tuokko, & Beattie, Reference Cooper, Tallman, Tuokko and Beattie1993; Zuin, Ortiz, Boromei, & Lopez, Reference Zuin, Ortiz, Boromei and Lopez2002), as well as specific cognitive domains including processing speed (Whelihan et al., Reference Whelihan, DiCarlo and Paul2005), visuospatial/constructional abilities (Anderson et al., Reference Anderson, Rizzo, Shi, Uc and Dawson2005), attention (Rizzo, Reinach, McGhee, & Dawson, Reference Rizzo, Reinach, McGhee and Dawson1997), and executive functioning (Szlyk, Myers, Zhang, Wetzel, & Shapiro, Reference Szlyk, Myers, Zhang, Wetzel and Shapiro2002).
Future research on hazard perception would also benefit from the inclusion of eye tracking measures, which might aid in separating attention to a hazard (eye fixation) from reaction to that hazard (touching the hazard on the screen, or reacting in a driving simulator). Eye tracking data have produced evidence of slower attention to hazards by novice drivers when compared to experienced drivers, suggesting that novice drivers may not have as effective visual search patterns in driving scenes (Huestegge, Skottke, Anders, Musseler, & Debus, Reference Huestegge, Skottke, Anders, Musseler and Debus2010) and has shown that, following hazard perception training, young novice drivers are more likely to attend to potential hazards (Pollatsek et al., Reference Pollatsek, Narayanaan, Pradhan and Fisher2006). It would be important to note whether hazard perception errors in older adults are related to visual attention or to slower response once a hazard has been identified.
Future research might also consider the role of insight/awareness of deficit and how it is related to both executive functioning and to changes in driving behavior in older adults. This could be an important avenue for lowering overall driving risk for aging adults. In addition, there is some preliminary evidence of the benefits of hazard perception training in older adults (Horswill, Kemala, et al., Reference Horswill, Kemala, Wetton, Scialfa and Pachana2010; Horswill, Falconer, Pachana, Wetton, & Hill, Reference Horswill, Falconer, Pachana, Wetton and Hill2015). Future studies might explore the ability of a neuropsychological screening to identify which older adults might benefit most from such training.
Acknowledgments
The authors declare no conflict of interest. The authors thank Dr. Chalres Scialfa for providing the videoclips used in the hazard perception task.