NOMENCLATURE
- a max
maximum acceleration (mm/s2)
- DOF
Degrees of Freedom
- Ep i
encoder position signal
- F
centre of the base coordinate system
- f Ax, f Ay, f Az
translational specific forces (m/s2) at the cockpit reference point for x, y, z axes, respectively
- f Acc
aircraft translational specific forces (m/s2) at the cockpit reference point
- GPS
Global Positioning System
- i
gear ratio
- K p, K i, K d
denote the coefficients for the proportional, integral and derivative terms, respectively
- L 1, . . ., L 6
latency of simulations
- L i
inverse kinematic actuator length (mm)
- L IS
rotation matrix that transforms vector components from the simulator reference frame to the inertial frame
- M
movable platform coordinate system
- PID
Proportional-Integral-Derivative controller
- PLC
Programmable Logic Controller
- S max
maximum actuator stroke (mm)
- T MF
transformation matrix coordinates, from movable coordinate system to base coordinate system
- T S
transformation matrix, from angular velocity to Euler angles rates
- U
linear length per rotation (mm/U)
- V
voltage
- V i
length vectors of the actuators (mm)
- V max
maximum speed (mm/s)
- W
body-axis components of the angular velocities (rad/s)
- W x, W y, W z
angular velocities (rad/s) at the cockpit reference point for x, y, z axes, respectively
- X, Y, Z
linear translatory motions (surge, sway, heave)
- dΔi
displacement of actuator (mm)
- ζ
damping coefficient
- φ, θ, ψ
motions of rotation (roll, pitch, yaw)
- ωn
natural frequency
Greek Symbol
1.0 INTRODUCTION
The interest for Stewart platforms emerges from the demand to create flight simulators increasingly realistic to be used for pilot and crew training and in the design and evaluation of aircraft control and embedded systems(Reference Page1). The application of flight simulation in research has increased considerably in the last decades, as hardware improvements have become available(Reference Jamson2). As this growth proceeds, there are many issues that are being discussed regarding the use of simulation for experimental research and development. One of the main issues surrounding human factors flight simulation research involves setting what level of simulator fidelity is needed to provide acceptable experimental results(Reference Rehmann3). The entire structure motion of a flight simulator system can be understood in a way that, when the pilot responds to motion sensations and to tasks given by training, it represents the inputs for the dynamic model of the aircraft which will have as output the specific forces and angular velocity from the aircraft Centre of Gravity (CG). Then, due to the limitations of the motion mechanism, the specific forces and angular velocity of the aircraft model is filtered by the washout filter. The trajectories generated by the filter are the reference inputs of the motion controller. The controller drives the actuators servo motors with appropriate control signals and receives signals from encoders as feedback signals(Reference Lemes, Breganon, Souza, Salvi, Angelico, Barbosa and Belo4). So, understanding the latency behaviour generated by the washout filter becomes very important to ensure greater simulation fidelity.
Also, it is important to understand the visual system on this fidelity process. The visual system provides a number of scenes for real-time images seen from the pilot eye position(Reference Buffett5). As the aircraft manoeuvres, the position and orientation of the pilot’s eye are computed in the motion equations and the scene is rendered every frame, typically 60 Hz(Reference Allerton6). Depending on the imaging system, there is latency between obtaining a new eye position and the pilot seeing the projected image. This latency, commonly related to as visual latency, should be kept to a minimum but can extend to three or four frames (four frames at 50 Hz is 80 ms). A value of 100 ms is commonly accepted as the worst admissible latency (depending on the aircraft dynamics) and figures of 20 ms to 50 ms are more commonly quoted for current flight simulators(Reference Allerton6).
It is obvious that a Stewart Platform cannot generate the same forces on the human sense as an aircraft flying, and understanding the human motion sensing system is essential to explaining the way which the human responds to motion. Also, it is important to identify the human limitations sensing systems that enable forces to be simulated in a way that is indiscernible to the pilot in a flight simulator(Reference Lee7).
The vestibular human system consists of two sets of sensors, which measure the angular and specific forces. Angular accelerations are sensed by the semi-circular canals, organised in three perpendicular planes(Reference Previc and Ercoline8). At low angular frequencies, below 0.1 Hz, they measure acceleration; at high frequencies (above 5 Hz), they measure displacement; and in the mid-range, they measure velocity. This behaviour can be considerably similar to a second-order filter(Reference Allerton6).
While the semi-circular canals feel angular acceleration, the otoliths sense specific forces. The transfer function is almost the same to the semi-circular canals. For combined motion of angular and specific forces, the semi-circular canal signals dominate with the otoliths providing measurements of predominantly linear motion(Reference Allerton6).
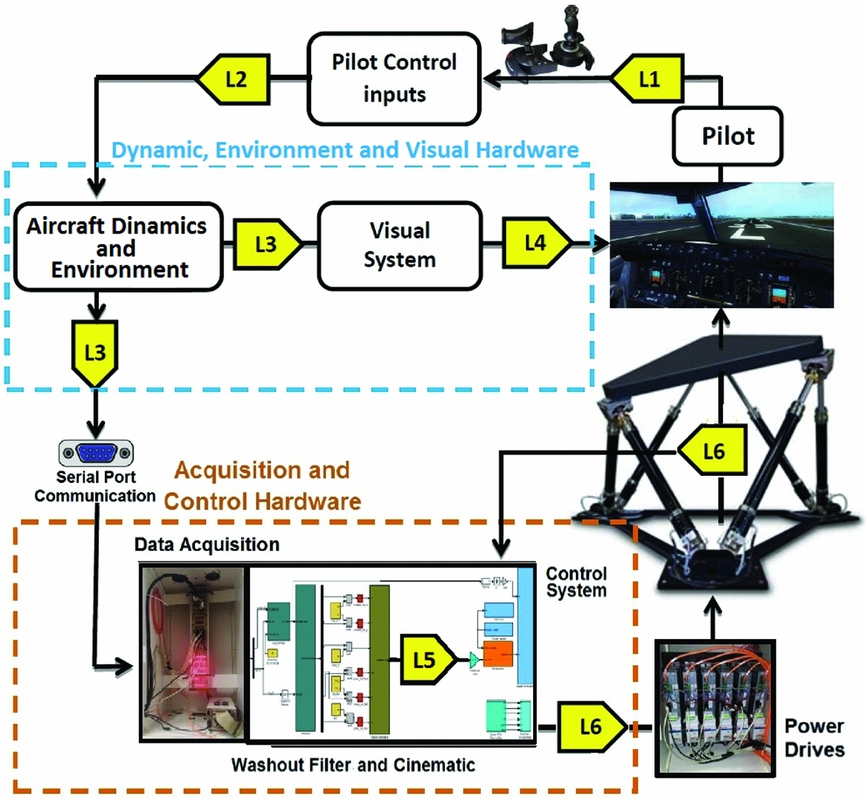
Flight simulators must be constructed using real-time systems. It means that the equations are solved at a fixed frame rate, which must be sufficiently fast in a way that they do no perceptible discontinuities in the simulation. We know that inevitable latency occurs in real-time simulation. These latency are related to lags or latency and if they are enough large, they can introduce many problems in real-time simulation. A simplified diagram of the primary sources of latency in flight simulation is shown in Fig. 1.
Latency in flight simulation platform.

Latency L1 emerges from the pilot’s response, that is, the time to acquire information, process the information (cognition) and then activate the muscles to implement the desired control function. Typical pilot latency are of the order 300 ms to 500 ms(Reference Allerton6). Although the latency of a pilot is likely to be the same in a simulator as it is in an aircraft, it may be affected by the visual feedback cues, motion feedback cues and tactile cues provided in the simulator. L2 occurs due to a finite time to acquire the inputs needed by the flight model and engine model, which will include analogue to digital conversion sampling times.
The latency L3 is the time needed to compute the aircraft dynamics before the updated aircraft position and attitude can be passed to the visual system. The latency of the real-time connection between the serial port data dynamics and motion control ensures that the arrival of this data is not significantly delayed. Testing of this connection during the commissioning of a simulator indicated the average time delay between the sending of dynamic data and its use by the washout filter to be less than 0.5 ms(Reference Jamson2).
Finally, the visual system needs to complete its current frame, render the image for the next frame and then project the image for the pilot. L4 can vary from one to four frames, depending on the rendering methods used by the image generator. The total latency L5 is mainly caused by phase error due to the motion drive algorithm which includes the third- and second-order equations present in the filters models and the integration techniques. Rounding out the total delay L5, delays caused by the motion drive algorithm, are added to the delays caused by the data acquisition system and the computational cost of the inverse kinematics of the platform. The control system and the dynamics of the actuators used are responsible for the L6 delay caused in the flight simulation platform.
In simulators with both visual and motion systems, it is particularly important that the latency of the motion system not be greater than the visual system, or symptoms of simulator sickness may result(Reference Dasgupta and Mruthyunjaya9). This is because in the real world, motion cues are those of acceleration and are quickly transmitted to the brain, typically in less than 50 milliseconds(Reference Previc and Ercoline8). These are followed some milliseconds later by a perception of change in the visual scene. The visual scene change is essentially the change of perspective and/or displacement of objects such as the horizon, which takes some time to build up to discernible amounts after the initial acceleration that causes the displacement. A simulator should therefore reflect the real-world situation by ensuring that the motion latency is equal to or less than that of the visual system and not the other way round.
2.0 THE EESC-USP STEWART PLATFORM
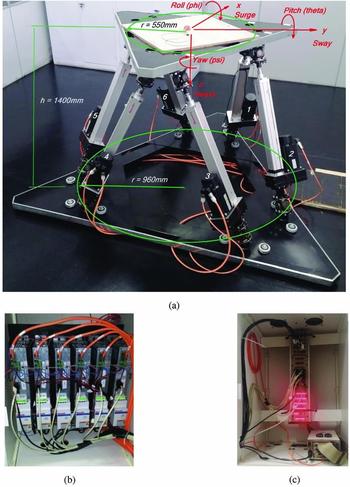
A Stewart platform, Fig. 2(a) was designed in the Flight Dynamics and Control Laboratory of the Department of Aeronautics of the Engineering School of São Carlos (EESC - USP) and it is composed of two platforms connected by six parallel linear actuators. The relative position between the two platforms can be changed by extending or retracting the actuators.
The Stewart platform of the Department of Aeronautics Flight Dynamics and Control Laboratory EESC-USP (a); Power units and PLC incorporated into the drives (b); Acquisition, transmission and processing systems dSPACE (c).

Gough, the first person to develop and utilise this type of parallel structure, had previously suggested a tire test machine(Reference Gough10) and Stewart adapted it for flight simulation platforms. This type of structure allows movement of the movable platform in six degrees of freedom; the three linear translatory motions X, Y, Z (surge, sway, heave); and the three rotational motions ϕ (roll), θ (pitch) and ψ (yaw)(Reference Stewart11). The axes adopted for the movable platform correspond to the axes usually adopted for the airplanes. On an aircraft, the frame X-axis typically points out the nose, the Y-axis points out the right side of the fuselage, and the Z-axis points out the bottom of the fuselage. It has six electromechanical actuators that are used to control the position and attitude of the movable platform. To measure the variation of the actuators’ lengths, encoders in the shaft of the actuators engines were used to measure the number of rotations of the engine, and then a calibration curve was applied to obtain each actuator length variation.
The acquisition, transmission and processing system dSPACE©, Fig. 2(c), was used to send a signal of voltage in the range of −10 V to +10 V to the power units and Programmable Logic Controller (PLC) incorporated into the drives to control the motors (Fig. 2(b)). For this platform, synchronous servomotors (Bosch-Rexroth) were used, that are composed of the servo drive, the electric motor and the feedback sensor installed in the electric motor housing. All these sets of elements form a closed-loop control, whose input is the current (or its equivalent voltage) that, according to the drive configuration, may represent a desired torque or a desired speed.
3.0 THE WASHOUT FILTER
The motion cueing algorithm, also called the washout filter, transforms the motion from real vehicles to simulators. The objective of the washout filter is to reproduce the angular rates and forces that a pilot would feel if the simulation was real, using a 6 DOF Stewart Platform, which has limited workspace(Reference Reid and Nahon12). To do this, the filters’ inputs are the specific forces and angular rates that would be sensed by the pilot’s head, where the human vestibular system is located. Such input is then reproduced, in the most realistic way, at the pilot’s head position by moving the platform in which the pilot is seated. Its major function is to wash out unnecessary signals and pull the position of, or move, the simulator back to its neutral position. Other functions of the washout filter are designed to increase the efficiency of the platform workspace. The senseless manoeuvre is developed to move the platform towards its original position beyond the threshold of human perception(Reference Chen and Fu13).
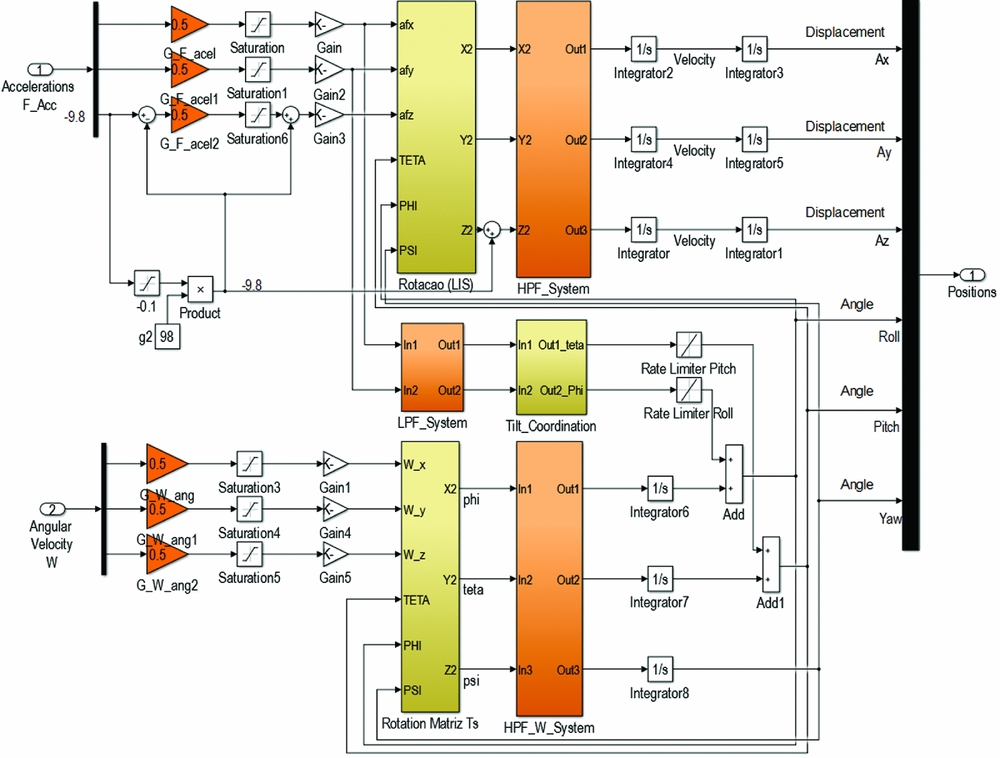
Classical washout filters, Fig. 3, are composed of linear low-pass filters and high-pass filters and are featured by their simplicity and ease of adjustment according to Equations (1) to (5)(Reference Reid and Nahon12). The inputs to the algorithm are the aircraft translational specific forces f Acc = [f Ax, f Ay, f Az]T and angular velocities W = [W x, W y, W z]T, while the outputs are the simulator displacement’s linear translatory motions (surge, sway, heave) and the motions of rotations (roll, pitch, yaw). Before filtering, the input channels’ signals are scaled and limited, then transformed to the inertial reference frame by transformation matrices L IS and T S. Both matrices depend on the actual state of the simulator and are continuously updated. After that, gravity is added to the specific forces to create the inertial frame accelerations. The inertial accelerations are high-pass filtered at the first section, called High-Frequency Translation Motions (Equation (1)), in order to remove the large displacement low-frequency motions. Finally, twice integrating the filtered accelerations, one obtains the desired translational displacements of the actuators. The aircraft translational specific forces signals f Acc are also sent to a second section called Tilt-coordination where they are low-pass filtered in order to remove the large displacement high-frequency motions and then subjected to tilt coordination to transform the translational motions into rotational motion (Equation (1)). These signals are then limited to 3 deg/s to keep the tilt rate and acceleration motions below the human perception thresholds, so that only the gravity component of the tilt angle can be detected(Reference Ko14).
Classical washout algorithm.

In a third section called High-Frequency Rotational Motions, the rotational motions signals are first scaled, limited and transformed into Euler rates using the matrix TS (transformation matrix from angular velocity to Euler angle rates) and then are high-pass filtered (Equation (3)) to yield the high-frequency component of the simulator angular motion. The values of natural frequency ωn and damping coefficient ζ can be determined by Equations (4) and (5), as well as from a set of values tuned by trial and error through experiments reported by the flight simulator pilot relative to a set of manoeuvres(Reference Nahon and Reid15).
 $$\begin{equation}
B_{X,Y,Z} = \left(\frac{s^2}{s^2+2\zeta _{x,y,z} \omega _{n x,y,z}s+\omega _{n x,y,z}^2}\times \frac{s}{s+\omega _{n x,y,z}}\right)
\end{equation}$$ \\
 $$\begin{equation}
{\it Btilt}_{\phi ,\theta } = \left(\frac{\omega _{n x,y}^2}{s^2+2\zeta _{x,y} \omega _{n x,y}s+\omega _{n x,y}^2}\times \frac{\omega _{n x,y}}{s+\omega _{n x,y}}\right)
\end{equation}$$ \\
 $$\begin{equation}
B_{\phi ,\theta ,\psi } = \left(\frac{s^2}{s^2+2\zeta _{\phi ,\theta ,\psi } \omega _{n \phi ,\theta ,\psi }s+\omega _{n \phi ,\theta ,\psi }^2}\right)\phi ,\theta ,\psi
\end{equation}$$ \\
 $$\begin{equation}
\omega _n^2 = \frac{a_{{\rm max}}}{{V_{{\rm max}}}}
\end{equation}$$ \\
 $$\begin{equation}
2\zeta \omega _n = \frac{a_{{\rm max}}}{{V_{{\rm max}}}}
\end{equation}$$
4.0 THE INVERSE KINEMATICS
Once defined, the desired position and attitude of the Stewart platform from the dynamic and washout filter, the length of the six actuators can be obtained utilising the inverse kinematics of the platform(Reference Nguyen, Antrazi, Zhou and Campbell16). Joints of actuators are known for a given platform, and their relative positions can be written in relation to the centre of each platform in two coordinate systems. The base platform coordinate system utilises the centre of the base platform F as origin, the xF-axis pointing between joints with actuators 1 and 6, zF-axis is perpendicular to the platform plane, and yF-axis completes the right-hand rule. The movable platform coordinate system centre M and its axis xM, yM and zM are defined in a similar way. The positions of joints of the base fixed and movable platforms in its coordinate systems are represented in Equations (6) and (7), respectively(Reference Souza, De Salvi, Carlos, Moreira, Schwening, Belo, Breganon and Lemes17).
 $$\begin{equation}
[F_i]^F = \left(F_{i1} \quad F_{i2} \quad 0 \right)^T, i=1,2,\ldots ,6
\end{equation}$$\\
 $$\begin{equation}
[M_i]^M = \left(M_{i1} \quad M_{i2} \quad 0 \right)^T, i=1,2,\ldots ,6
\end{equation}$$
The transformation matrix [T MF] to obtain coordinates from the movable coordinate system to the base coordinate system can be obtained utilising three rotations in sequence(Reference Advani18). The first rotation is applied in the xM-axis until the yM-axis is parallel to the base platform plane and this angle of rotation ϕ is known as the roll angle. Then, it is applied as a rotation in the yM-axis until the movable platform is parallel to the base platform and the pitch angle θ is obtained. The last rotation is applied in the zM-axis generating the yaw angle ψ(Reference Souza, De Salvi, Carlos, Moreira, Schwening, Belo, Breganon and Lemes17). The transformation matrix is shown in Equation (8), where C = Cosine and S = Sine.
 $$\begin{equation}
[T^{MF}]=\left(\begin{array}{c@{\quad}c@{\quad}cc}C\psi C\theta & C\psi S\theta S\phi -C\phi S\psi & C\psi C\phi S\theta +S\psi S\phi \\
C\theta S\psi & C\psi C\phi + S\psi S\theta S\phi & C\phi S\psi S\theta -C\psi S\phi \\
-S\theta & C\theta S\phi & C\theta S\phi \end{array} \right)
\end{equation}$$
The position of the movable platform can be written in the base platform system as shown in Equation (9) and the length vectors V i of the six actuators can be obtained utilising Equation (10).
 $$\begin{equation}
\lbrace M\rbrace ^F = \left\lbrace x \quad y \quad z \right\rbrace ^T
\end{equation}$$ \\
 $$\begin{equation}
\lbrace V_i\rbrace ^F = \left\lbrace V_{i1} \quad V_{i2} \quad V_{i3} \right\rbrace ^T= \lbrace M\rbrace +[T^{MF}]\ast \lbrace M_i\rbrace -\lbrace F_i\rbrace , i=1,2,\ldots ,6
\end{equation}$$
The actuators length Li is the module of the vector [V i] as shown in Equation (11).
 $$\begin{equation}
L_i=\left(V_{i1}^2 \quad V_{i2}^2 \quad V_{i3}^2 \right)^{0.5}, i=1,2,\ldots ,6
\end{equation}$$
5.0 EXPERIMENTAL SET-UP
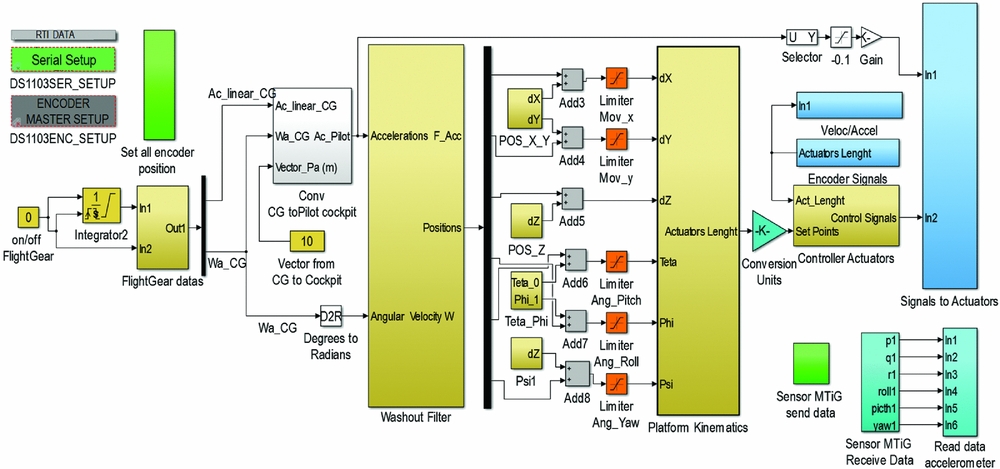
The experimental set-up was implemented using Matlab/Simulink, Fig. 4. In order to investigate the latency on a Stewart Platform caused by the washout filter, it is necessary to reproduce the specific forces and angular velocities as input to the filter. These signals were created using the FlightGear software by reproducing a Boeing 747-400 take-off procedure, saved into Matlab/Simulink function block and converted from the CG of the aircraft to the cockpit pilot seat. These data of the specific forces and angular velocities are then compared before the entry of the washout filter, with the specific forces and angular velocity developed by the movable platform. These results can be seen from Figs 5 and 8. Then, the signals are washout filtered and inserted in the inverse kinematics of the movable platform, which will transform the correct motions of the actuators according to the motion sensations created by the input data; see Fig. 4.
Experimental set-up.

A Proportional-Integral-Derivative (PID) controller was used with a transfer function presented in Equation (18) and was applied to all actuators. The controller takes as input the signal from the error between the desired actuator length and real length (encoder signals block, Fig. 4) and then defines the control action that is the sum of proportional, derivative and integrative actions.The displacement of each actuator (dΔi) is measured by absolute encoder-type sensors (Ep i). The ratio of the encoder signals to the linear motion of the actuators is given by the Equations (12) and (17) and were obtained experimentally.
 $$\begin{equation}
d\Delta _1 = \frac{-834.986+Ep_1}{25}+0.399
\end{equation}$$ \\
 $$\begin{equation}
d\Delta _2 = \frac{-835.447+Ep_2}{25.001}+0.417
\end{equation}$$\\
 $$\begin{equation}
d\Delta _3 = \frac{-833.397+Ep_3}{25}+0.336
\end{equation}$$\\
 $$\begin{equation}
d\Delta _4 = \frac{-827.575+Ep_4}{24.998}+0.106
\end{equation}$$ \\
 $$\begin{equation}
d\Delta _5 = \frac{-833.615+Ep_5}{24.998}+0.347
\end{equation}$$ \\
 $$\begin{equation}
d\Delta _6 = \frac{-834.222+Ep_6}{25.001}+0.368
\end{equation}$$
A PID controller continuously calculates an error value e(t) as the difference between a desired set point and a measured process variable and applies a correction based on proportional, integral and derivative terms. The controller attempts to minimise the error over time by adjustment of a control variable u(t), such as the position of the actuators.
 $$\begin{equation}
u(t)=K_p e(t)+K_i + \int _{0}^{t} e(\tau ) d\tau + K_d \frac{de(t)}{dt}
\end{equation}$$
To compare the input signals with the motions produced by the movable platform, an inertial measurement unit with an attitude and heading reference system processor is used at the centre of the movable platform. This measurement unit low-power signal processor provides real-time inertial enhanced 3D position and velocity estimates. The inertial sensor also provides drift-free, GPS enhanced, 3D orientation estimates, as well as calibrated 3D accelerations, 3D rates of turn, 3D earth-magnetic field data and static pressure (barometre). The dynamics of the actuators were defined according to the maximum payload and maximum acceleration of 700 kg and 15 m/s2, respectively. Table 1 shows the dynamics of actuators used for this platform.
Dynamic actuator characteristics – Rexroth EMC 80-32

6.0 RESULTS
The experimental flight data of the simulation take-off process was recorded and reproduced using the system presented in Fig. 4. The recorded data has 50 Hz acquisition and transmission frequency. For the experimental results, a Boeing 747-400 was used during take-off procedure using FlightGear open-source software. The linear translatory motions X, Y, Z (surge, sway, heave), and the three rotations ϕ, θ, ψ (roll, pitch, yaw) are transmitted to the data acquisition board through the computer serial port. These data are converted from aircraft CG to the pilot’s seat base to ensure that the same inertial forces that a pilot would feel inside the cockpit would be reproduced by the movable platform.
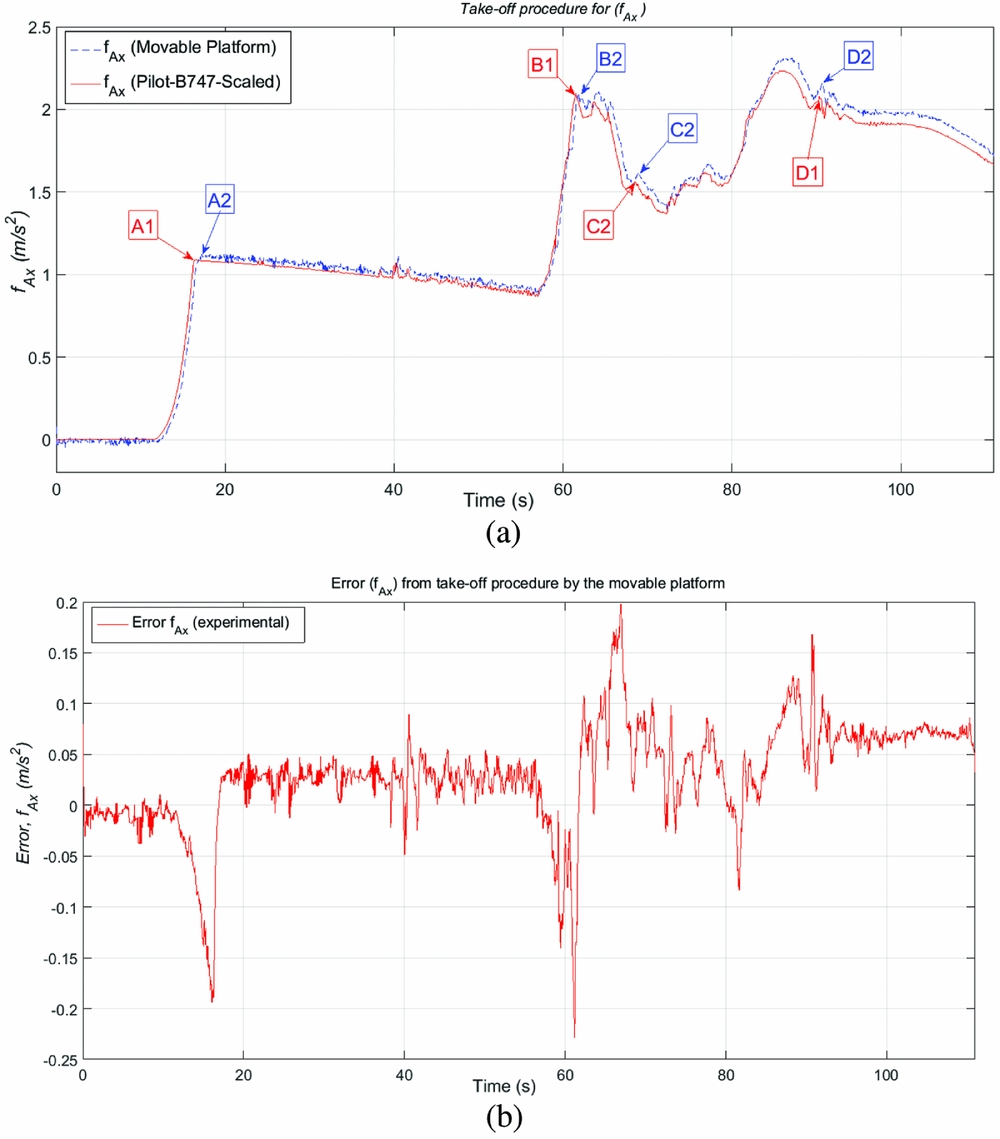
Figure 5 shows the specific forces felt by the pilot on the X-axis aircraft direction, according to the take-off procedure already scaled and limited by the washout filter input (Fig. 3), and compares it with the acceleration created by the movable platform. One also can observe the total latency (L5 + L6) present in this experimental procedure. One may also notice the take-off procedure used. In the beginning, the engines are turned on and the aircraft has the brakes activated. Around 15 s, the brakes are deactivated and the aircraft starts running on the runway until the take-off, around the time of 56 s. The aircraft remains for approximately 8 seconds at take-off angle, and then some unconventional disturbances are created during take-off so that it is possible to analyse and quantify the movable platform latency in reproducing aircraft accelerations. The signals A1, B1, C1 and D1 are the accelerations developed by the aircraft cockpit, while A2, B2, C2 and D2 are the accelerations reproduced by the movable platform. The movable platform latency responsible for reproducing the aircraft f Ax acceleration are A2 = 440 ms, B2 = 240 ms, C2 = 180 ms and D2 = 260 ms. The data show an average total latency (L5 + L6) of about 280 ms for the movable platform to reproduce the f Ax, even at the points of greatest variation of acceleration as shown in Fig. 5(a) and the errors presented by Fig. 5(b). It is also possible to say that the smaller the acceleration error, the smaller the signal delay.
Comparison of f Ax created by the aircraft and reproduced by the movable platform (a); Experimental acceleration error in f Ax (b).

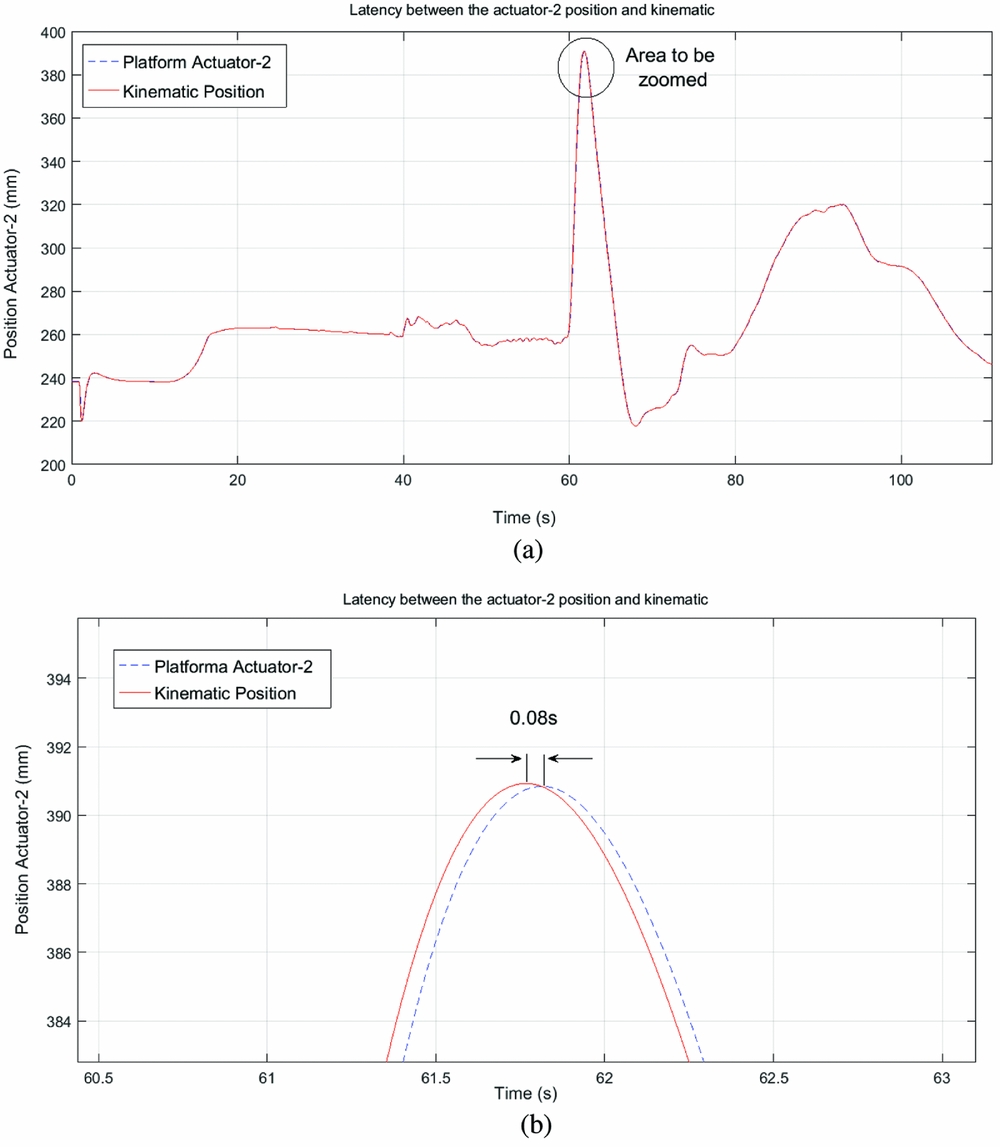
To find out the washout filter latency influence (L5) to reproduce the motion sensations by the movable platform, it is necessary to know the dynamic and control delays of the platform (L6) and subtract that from the total latency (L5 + L6). Figure 6(a) and (b) compare the second actuator position indicated by the kinematics to the real actuator position and how to obtain the latency (L6) caused by the dynamic system of the motion platform and control system used. The average latency obtained by the author in several points along the time axis indicated by Fig. 6(a) is about 40 ms, with the maximum latency of 80 ms, indicated by Fig. 6(b) during the moment of highest peak acceleration required. As a result of this, the average delay L5 influenced by the washout filter is about 240 ms for the f Ax.
Kinematics and actual second-actuator position (a); Maximum latency indicated (b).

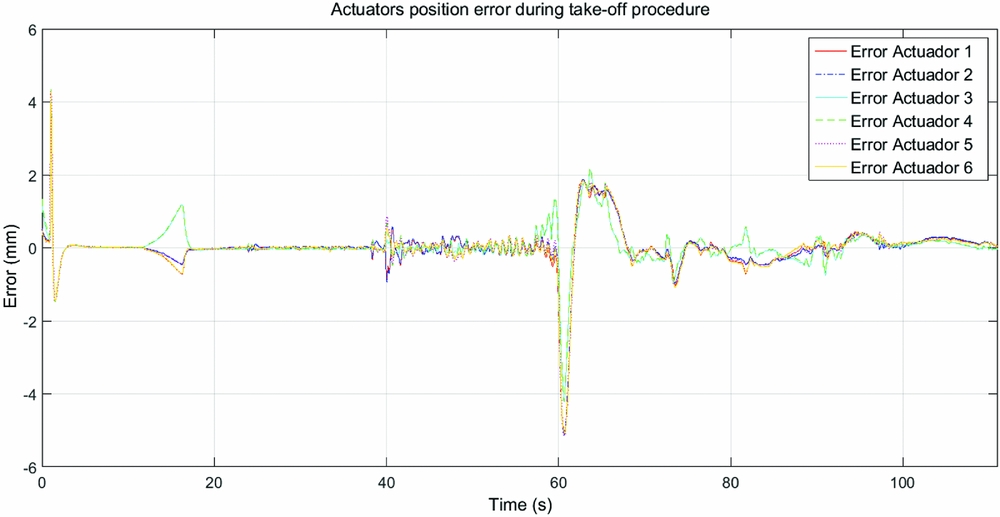
Still in Fig. 6(a), it may be noted close to the time of 40 s, a small correction is applied by the pilot to the rudder to correct an aircraft position on the runway, causing a rotation of the aircraft’s Z-axis and creating small disturbances that are reproduced by the movable platform. Figure 7 shows the position error of the platform actuators for the entire take-off procedure, where the efficiency of the control applied to each actuator can be noted.
Platform actuator position error.

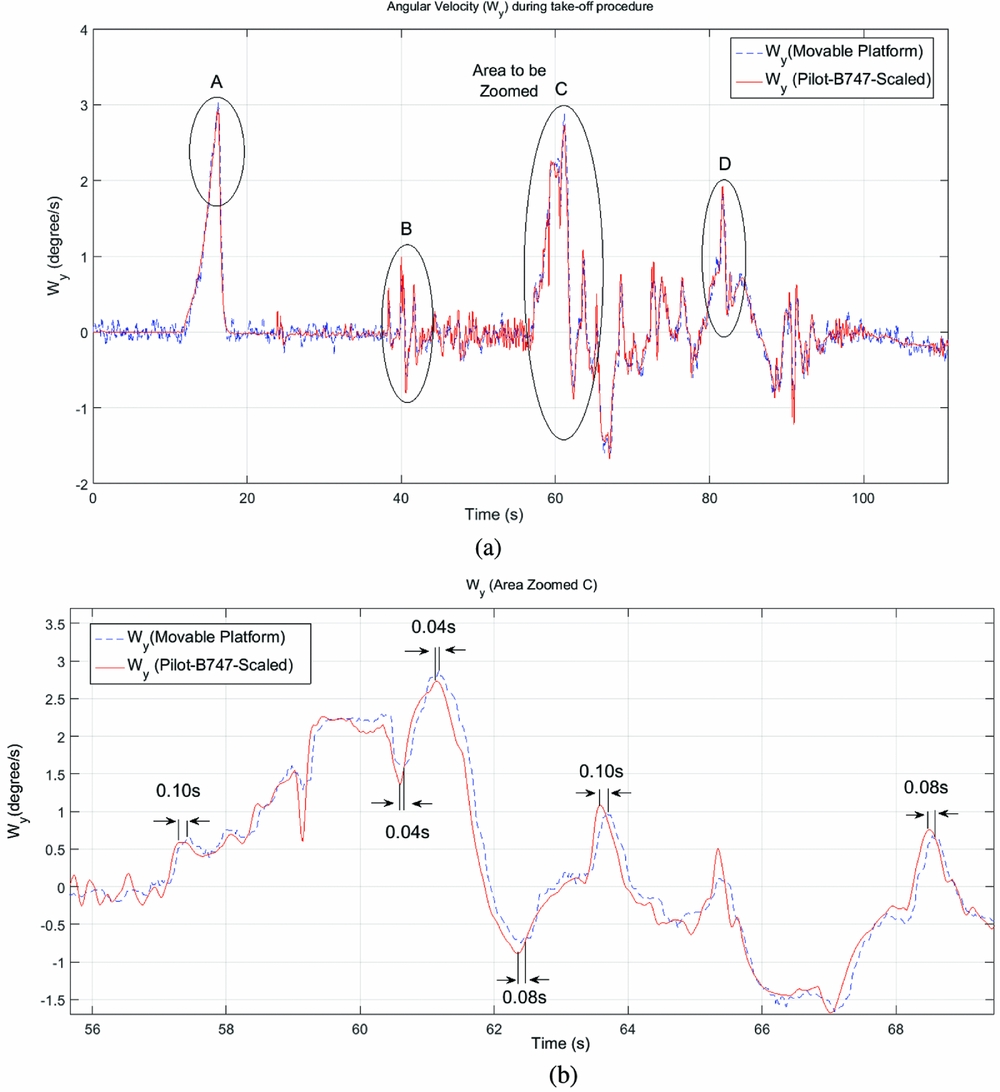
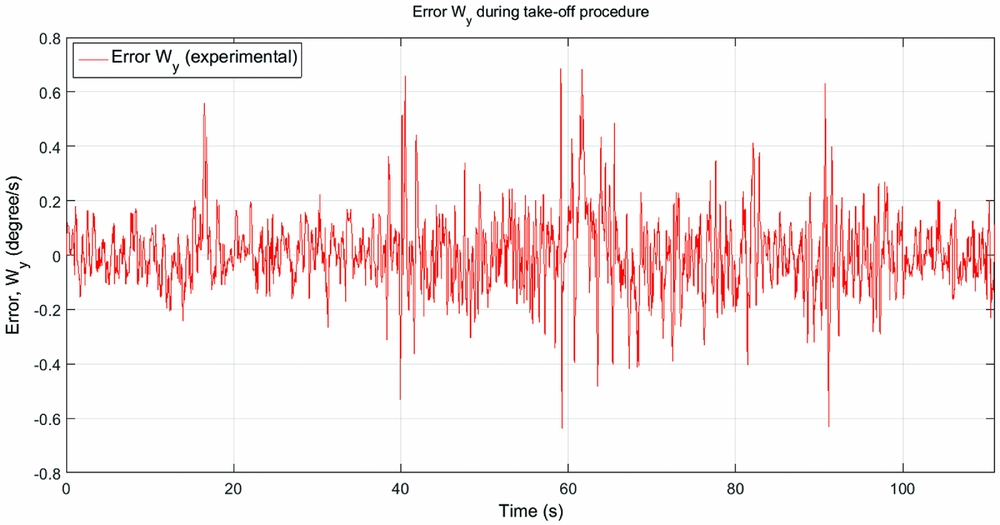
Figure 8 shows the Y-axis angular speed of the aircraft cockpit generated during the take-off procedure and the angular speed reproduced by the movable platform on the Y-axis. The details of latency can be well observed in Fig. 8(b) which is the zoom at time C. Time A had an average latency of 40 ms, 100 ms for instant B, 60 ms for instant C and 80 ms for D. According to the data, the average total latency (L5+L6) for W y was 70 ms, with an average error below 0.8º/s as shown on Fig. 9. As a result of this, the average delay L5, influenced by the washout filter, is about 30 ms for the W y.
Angular velocity on the Y-axis of the aircraft cockpit during the entire take-off process and the movable platform angular velocity of the Y-axis (a); Latency of the angular velocity in the Y-axis at time C (b).

Experimental error of the angular velocity (W y).

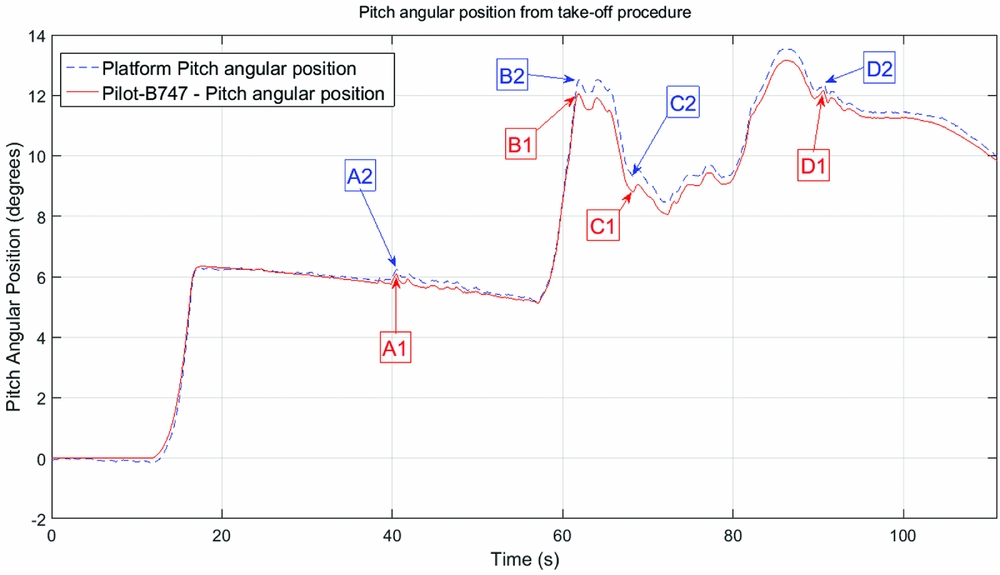
Figure 10 shows the pitch angle formed by the washout filter output which is composed mainly of the input of specific force f Ax and the angular velocity of W y and compares with the pitch angle formed by the movable platform. Signals A1, B1, C1 and D1 are the angular pitch positions developed by the aircraft, while A2, B2, C2 and D2 are the angular pitch positions reproduced by the movable platform. The latency observed by the platform in reproducing the pitch angle of the aircraft are A2 = 40 ms, B2 = 60 ms, C2 = 60 ms and D2 = 40 ms. These data present an average total latency (L5 + L6) of approximately 50 ms for the movable platform to reproduce the pitch angles considerably.
The pitch angle formed by the washout filter output and the pitch angle formed by the movable platform.

7.0 CONCLUSIONS
Many works in recent years have been produced to optimise these filter models within the platform work area, without worrying about the latency that these models may cause to simulation quality. This results, seeks to draw attention to the importance of latency caused by these filters models, in the simulation procedure of this kind of platform.
As the take-off process flight data were recorded and are reproduced directly in the data acquisition system, there is no signal delay between the operating hardware FlightGear and hardware data acquisition system. Obviously, the natural delays (L1, L2 and L4) shown in Fig. 1 are already contained in the recorded flight data to be reproduced by the movable platform. To know the dynamic and control latency platform (L6) and the washout filter latency (L5), the frequency acquisition and data transmission (L3) of 50 Hz is subtracted from the total latency (L5 + L6) experimental results data presented in Figs 5 to 10. The results showed that the parametrisation used for the washout filter (Equations (1) to (5)), and the control system used (Equation (12)), was able to allow the movable platform to accurately reproduce the accelerations and angular speeds from the Boeing 747 cockpit during the take-off procedure performed in the FlightGear software. With a total latency (L5 + L6) of 280 ms presented by the specific force f Ax, the washout filter was responsible for 86% of the total latency in this case and 43% for the case of the angular velocity in W y. The greater latency presented by the specific force f Acc can be explained by the characteristic that the washout filter presents, where the values of the latency f Acc is composed by the sum of the latencies caused by the third-order low-pass filter tilt coordinates channel with the second-order high-pass filter rotation motion channel, thus forming the resulting Euler angles for the transformation matrix LIS that will produce the inertial coordinates vector to the third-order high-pass translation motion channel.
For future work, it would be recommended to compare the latency L5 caused by different motion drive algorithms. It would also be interesting to develop, test and apply better filters of lower-order equations to high- and low-pass filters, or apply mathematical models to the motion drive algorithms to reduce the latency caused by L5, without causing greater losses in reproducing the specific forces felt by the pilot in the simulator.