Introduction
GABA is the main inhibitory neurotransmitter in the adult brain. GABA is one of the first neurotransmitters to become functional during development, and initially, it depolarizes neuronal progenitors and immature neurons in many developing networks (Ben-Ari, Reference Ben-Ari2002). GABA has been implied to regulate stem and progenitor cell proliferation (LoTurco et al., Reference LoTurco, Owens, Heath, Davis and Kriegstein1995; Andäng et al., Reference Andäng, Hjerling-Leffler, Moliner, Lundgren, Castelo-Branco, Nanou, Pozas, Bryja, Halliez, Nishimaru, Wilbertz, Arenas, Koltzenburg, Charnay, El Manira, Ibanez and Ernfors2008), neuronal migration (Behar et al., Reference Behar, Li, Tran, Ma, Dunlap, Scott and Barker1996), and activity-dependent trophic interactions (Represa & Ben-Ari, Reference Represa and Ben-Ari2005; Wang & Kriegstein, Reference Wang and Kriegstein2009). These different actions by one single molecule may be explained by a high degree of complexity in the constitution of the GABA receptors. The chloride-permeable (GABAA) receptors are the main mediators of fast inhibitory neurotransmission in the mammalian central nervous system. These receptors are heteropentamers formed from at least 16 different subunits with minor variations among species. In chick, subunits α1-6, β1-4, γ1-3, δ, ε, and π have been identified (references for each subunit can be found in Table S1). Individual neurons express several subunits resulting in the formation of structurally and functionally different receptor subtypes.
The transcript encoding the α3-subunit of the GABAA receptor has been shown to be subjected to RNA editing giving rise to an amino acid isoleucine-to-methionine (I-to-M) change in the third transmembrane domain of the receptor subunit (Ohlson et al., Reference Ohlson, Pedersen, Haussler and Öhman2007). This amino acid exchange has been suggested to change the kinetics of the GABAA receptor (Rula et al., Reference Rula, Lagrange, Jacobs, Hu, Macdonald and Emeson2008; Nimmich et al., Reference Nimmich, Heidelberg and Fisher2009). Adenosine-to-inosine (A-to-I) RNA editing is a cotranscriptional or posttranscriptional event on double-stranded RNA that is catalyzed by adenosine deaminases that act on RNA (ADARs) (reviewed in Maydanovych & Beal, Reference Maydanovych and Beal2006). Editing is a mechanism of gene control similar to alternative pre-mRNA splicing, and like alternative splicing, editing plays an important role in the nervous system by increasing the diversity of the proteome. Well-characterized substrates for RNA editing are the transcripts of the glutamate receptors (Seeburg, Reference Seeburg2002). Editing of the GluA2 (AMPA) transcript, at the Q/R (glutamine/arginine) site is essential to the organism and required for a normal brain development (Brusa et al., Reference Brusa, Zimmermann, Koh, Feldmeyer, Gass, Seeburg and Sprengel1995; Feldmeyer et al., Reference Feldmeyer, Kask, Brusa, Kornau, Kolhekar, Rozov, Burnashev, Jensen, Hvalby, Sprengel and Seeburg1999). Furthermore, editing that fine-tunes the features of several other proteins involved in neurotransmission has been described, where single amino acid changes, leading to an alteration in gating and kinetic properties of a number of neural receptors (reviewed in Jepson & Reenan, Reference Jepson and Reenan2008).
The GABAA receptors are most commonly composed of two α, two β, and either one γ or δ subunit (Hevers & Lüddens, Reference Hevers and Lüddens1998). There are six types of α subunits, and the α3 subunit is one of the common α subunits in the embryonic brain (Laurie et al., Reference Laurie, Seeburg and Wisden1992a; Laurie et al., Reference Laurie, Wisden and Seeburg1992b). As development progresses, the α3 subunit has been shown to be replaced by the α1 subunit, and its expression to be restricted primarily to cortical neurons in the adult (Laurie et al., Reference Laurie, Seeburg and Wisden1992a; Laurie et al., Reference Laurie, Wisden and Seeburg1992b; Wisden et al., Reference Wisden, Laurie, Monyer and Seeburg1992). The α3 subunit is expressed in the rat retina by dopaminergic amacrine cells (Greferath et al., Reference Greferath, Grunert, Fritschy, Stephenson, Mohler and Wassle1995) and by alpha ganglion cells (Koulen et al., Reference Koulen, Sassoe-Pognetto, Grunert and Wassle1996).
Recent studies demonstrate that editing of the α3 transcript in mouse brain is developmentally regulated (Ohlson et al., Reference Ohlson, Pedersen, Haussler and Öhman2007; Rula et al., Reference Rula, Lagrange, Jacobs, Hu, Macdonald and Emeson2008; Nimmich et al., Reference Nimmich, Heidelberg and Fisher2009). Only 6% of the transcripts are edited at embryonic day 15 (E15), whereas 93% of the transcripts are edited in the adult brain (Wahlstedt et al., Reference Wahlstedt, Daniel, Enstero and Öhman2009). Our preliminary data indicated that the α3 transcript in adult retina was A-to-I edited. The aim of this study was to determine if the α3 subunit is expressed in developing chick retina and if editing of the transcript changes during development. We were also interested in knowing if a change in editing was temporally related to the developmental shift from excitation to inhibition by GABA as suggested by previous studies (Ohlson et al., Reference Ohlson, Pedersen, Haussler and Öhman2007; Rula et al., Reference Rula, Lagrange, Jacobs, Hu, Macdonald and Emeson2008). To monitor the shift, we studied the temporal expression of chloride ion transporters in retina, involved in the establishment of high intracellular chloride concentration, necessary for the reversed chloride ion transport and cell depolarization by GABAA receptors (Ben-Ari et al., Reference Ben-Ari, Gaiarsa, Tyzio and Khazipov2007). We also studied the localization of the α3 subunit messenger RNA (mRNA) in the retina and the temporal expression of mRNA for 16 GABAA receptor subunits in the developing chick retina. Our results show that the mRNA expression of the majority of the receptor subunits, including the edited α3, increases concurrently with an increase in expression of the chloride ion transporter KCC2.
Material and methods
Animals
Fertilized white leghorn eggs were obtained from Ova Produktion AB (Västerås, Sweden) and incubated at 38°C in a humidified incubator. Embryos were staged (st) according to Hamburger and Hamilton (Reference Hamburger and Hamilton1951).
Analysis of mRNA editing, quantitative reverse transcription PCR, and sequencing
The extent of editing was determined by sequencing of complementary DNA (cDNA) from different embryonic ages (E) and adult chicken. RNA was isolated from retinas from st30 (E6.5), 35 (E8–9), 38 (E12), 42 (E16), 45 (E19), and 6-month-old chicken retinas; 6-month cerebellum; optic tectum; and cerebrum (telencephalon) using TRIzol (Invitrogen AB, Täby, Sweden). Four RNA preparations from retinas from one to seven embryos per sample and brain tissue from four individuals were collected. Random primers were used for first-strand cDNA synthesis (Superscript III RT; Invitrogen). PCR (Platinum Taq; Invitrogen) was carried out with primers specific for GABAA receptor α3 subunit sequences (see Table S1). The PCR products were gel purified and sequenced and the relative peak heights in the chromatogram were compared for A/G at nucleotide position 10884709 in GABRA3 on chick chromosome 4 (WashUC2), corresponding to exon 8 and amino acid 5 in the third transmembrane domain of the α3 subunit. Pyrosequencing was used to verify the mRNA editing in the st45 embryo. Four parallel PCRs (one reaction/cDNA batch) with an unbiotinylated forward primer and a biotinylated reverse primer (Table S1) were carried out producing 121-base pair PCR fragments covering the edited nucleotide in chick α3 subunit sequence. The biotinylated PCR products were bound to streptavidin sepharose high-performance beads (17-5113-01; GE Healthcare Sverige AB, Stockholm, Sweden) and denatured before annealing (979007, 9; Qiagen Solutions) to a specific sequencing primer (Table S1). Sequencing reactions were run on a PSQ96 MA pyrosequencing machine using pyroMark Gold Q96 reagents (972804; Qiagen AB, Sollentuna, Sweden). The Pyrosequencing analysis is designed to differentiate between specific single nucleotide polymorphisms at defined positions, and we tested st30 and 45 for the presence of A at nucleotide position 10884709 that corresponds to the unedited variant of the GABRA3 transcript. To quantify the editing, PCR products from st30, 35, 38, 42, 45, and 6-month chicken retina cDNA made from a pool of all stage-specific RNA samples were cloned in pGEM-T easy vectors (Promega Biotech AB, Stockholm, Sweden), and 20 clones originating from each stage were individually sequenced. Chick genomic DNA was sequenced as a control. The data were statistically analyzed using the chi-square test (df = 1).
For the quantitative reverse transcription PCR (qRT-PCR), cDNA was prepared from 1 μg of RNA from each RNA batch using GeneAmp (Applied Biosystems, Stockholm, Sweden). The analysis was performed using IQ SyBr Green Supermix (Bio-Rad laboratories AB, Sundbyberg, Sweden) with primers designed by using Primer Express v2.0 (Applied Biosystem), default setting; Tm 60°C, 50% G/C, amplicon size minimum 100 base pairs. Each primer sequence was blasted separately against GenBank and European Molecular Biology Laboratory (EMBL), and only primers with one perfect match within the target sequence and with the second best hit <75% identity were used. The primer pairs were checked for linearity in the amplification. To confirm identity of amplified PCR products, dissociation curve analysis and agarose gel electrophoresis were performed after analysis. The initial mRNA levels were first normalized to β-actin and TATA box–binding protein (TBP) mRNA levels to correct for variations in the cDNA syntheses and experimental procedure. The use of β-actin and TBP for normalization purposes was validated by testing for the most stable mRNA expression of TBP, β-actin, β-2-microglobulin, and glyceraldehyde 3-phosphate dehydrogenase (GAPDH) over the developmental stages of chick retina. The software geNorm (also included in Biorad MyIQ software package) was used (Vandesompele et al., Reference Vandesompele, De Preter, Pattyn, Poppe, Van Roy, De Paepe and Speleman2002). Control reactions containing primers but without reverse transcriptase were analyzed in parallel. Primer sequences are listed in Table S1. To visualize differential amplification levels of the GABAA receptor subunit mRNAs, we plotted the relative expression levels of each subunit during development in relation to the amplification levels at 6-month retina and in relation to the α3-mRNA levels. The relative mRNA levels of NKCC1, KCC2, ADAR1, and ADAR2 were plotted in relation to the level for the gene with the relative lowest expression at the latest stage included (st45 for NKCC1 and KCC2; 6-month posthatch for ADAR1 and ADAR2).
In situ hybridization
Dissected eyes from chicken st25, 35, 38, 42, and 45 were fixed in 4% paraformaldehyde in phosphate-buffered saline for 1 h at 4°C. Fixed eyes were then incubated overnight in 30% phosphate-buffered sucrose at 4°C, embedded in Optimum Cutting Temperature (O.C.T.) freezing medium (Tissue-Tek; Sakura Finetek Europe B.V., Zoeterwoude, Netherlands), frozen, and sectioned in a cryostat. Ten-micrometer thick sections transversely cut through the optic nerve were collected on glass slides (Super Frost Plus; Menzel-Gläser, Menzel GmbH & Co KG, Braunschweig, Germany). In situ hybridization analysis was performed as previously described (Pringle, Reference Pringle2006; Boije et al., Reference Boije, Edqvist and Hallböök2008). In short, a complementary RNA probe was made using the DIG RNA Labeling Kit (Roche Diagnostic GmbH, Mannheim, Germany). The α3 subunit probe was made from the Expressed Sequence Tag (EST) clone ChEST884i11 (nt 829–1534) as a template. Probes were hybridized to untreated sections overnight at 68°C under conditions containing 50% formamide and 5× SSC in a humidified chamber. The DIG-labeled probes were detected by using an alkaline phosphatase–conjugated anti-DIG antibody (Roche), followed by incubation with BCIP/NBT developing solution (Roche) for 2–5 h at 37°C. Images were captured by using a Zeiss Axioplan2 microscope equipped with Axiovision software (4.8; Carl Zeiss Vision GmbH, Carl Zeiss Vision GmbH, Göttingen, Germany).
Immunohistochemistry
Dissected eyes from st45 chicken were fixed in 4% paraformaldehyde in phosphate-buffered saline for 3 h at 4°C. Fixed eyes were then incubated overnight in 30% phosphate-buffered sucrose at 4°C, embedded in OCT freezing medium (Tissue-Tek; Sakura), frozen, and sectioned in a cryostat. Ten-micrometer thick sections transversely cut through the optic nerve were collected on glass slides (Super Frost Plus; Menzel-Gläser). Sections were first incubated in 0.3% H2O2 in PBS for 10 min and then in blocking solution (PBS containing 1% fetal calf serum and 0.1% Triton X-100) for 30 min. Primary and secondary antibodies were diluted in blocking solution. Primary antibody was allowed to react with the sections overnight at 4°C and secondary antibody for 2 h at room temperature. Primary antibody used in this study was against the tyrosine hydroxylase (TH; MAB318; Chemicon (Millipore), Temecula, CA) diluted 1:500 and choline acetyltransferase (ChAT; ab144p; Millipore Corporation, Temecula, CA) 1:100. The primary antibodies were detected using a horseradish peroxidase–conjugated secondary antibody in combination with a 3′3-diaminobenzidine kit (DAB, Vector, Vector laboratories, Burlingame, CA). The DAB solution was allowed to react for 10 min at room temperature. The number of cells on the vitreal side of the internal nuclear layer in sections stained either by in situ hybridization for α3 subunit mRNA or by immunohistochemistry for TH or ChAT was counted. The compared sections were adjacent and cut in parallel with a plane through the center of the lens and the optic nerve in the central region from two st45 retina, and cells from four sections containing the entire retina were counted.
Results
GABAA receptor α3 subunit mRNA editing
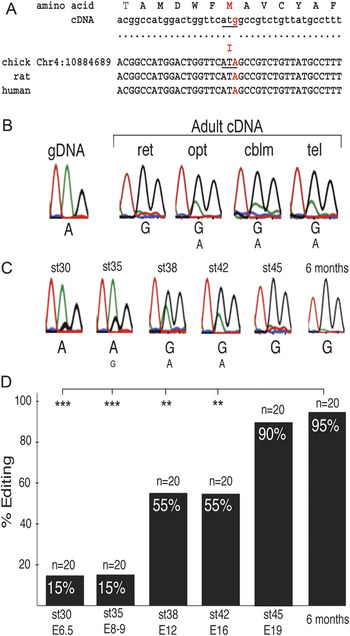
Among the GABAA receptor transcripts, only the α3 subunit transcript has been found to be edited (Ohlson et al., Reference Ohlson, Pedersen, Haussler and Öhman2007; Rula et al., Reference Rula, Lagrange, Jacobs, Hu, Macdonald and Emeson2008; Wahlstedt et al., Reference Wahlstedt, Daniel, Enstero and Öhman2009). To investigate if the chicken Gabra3 transcript is edited, we sequenced chicken cDNA and genomic DNA in the region of the putatively edited site in Gabra3. The genomic DNA sequence was read as an A, identical with the sequence in the chick genome database (WASHUC2). To determine RNA editing, cDNA was synthesized from adult brain (optic tectum, cerebellum, and telencephalon), from retina, and from a series of developing retina (st30–6 months). The result showed that the chick Gabra3 transcript was subjected to A-to-I editing at the same site as the mouse and human transcripts, changing isoleucine (295) to methionine (Fig. 1A–1C). The edited site containing the nucleotide I is read as a G after the sequencing reaction. A representative sequence electropherogram is shown for each brain region and stage, illustrating the site and the degree of editing (Fig. 1B and 1C). The Gabra3 transcript was extensively edited in the retina and other regions of the adult brain as indicated by the relative heights of the electropherogram peaks. The direct sequencing of cDNA batches from developing retina implied that the Gabra3 editing was developmentally regulated with a low degree of editing at st30 as shown by a dominating A-peak and a high degree at later ages as shown by a dominating G-peak at st45 and 6 months. This result was verified by using Pyrosequencing. Pyrosequencing is often used to differentiate single nucleotide polymorphisms at specific positions, and we designed an assay that tested the occurrence of the nucleotide A at nucleotide position 10884709 (GABRA3) that corresponds to the unedited transcript. The Pyrosequencing gave an A in all the st30 retina samples, four cDNA batches synthesized from four RNA samples each prepared from seven different retinas. None of four st45 samples gave an A.
Adenosine-to-inosine RNA editing of the transcript for GABAA receptor α3 subunit. (A) Amino acid, complementary DNA (cDNA), and genomic DNA sequences in the vicinity of the I/M RNA editing target site in α3 subunit. The edited site (A–G) is shown in red and the resulting isoleucine-to-methionine change is underlined. (B) Representative electropherograms of the sequence at the I/M site from genomic DNA and from cDNA synthesized from adult brain and retina RNA and (C) RNA of a series of retinas from st30 to 6-month chickens. (D) Quantification of RNA editing. PCR products from cDNA from developing and adult retina (st30 to adult) were cloned, and 20 individually picked clones from each stage were sequenced to determine the A to G change. Statistical test was chi-square test, df = 1, ***P < 0.001, **P < 0.01. cblm, cerebellum; E, embryonic day; gDNA, genomic DNA; opt, optic tectum; st, Hamburger & Hamilton developmental stage; ret, retina; tel, telencephalon.

To determine the degree of editing, 20 individually picked cDNA clones from each age were sequenced. The cDNA clones were generated from pools of all RNA samples from each age. The result confirmed that editing was developmentally regulated (Fig. 1D).
The expression of the ADAR enzymes catalyzing RNA editing in the retina was confirmed by qRT-PCR. The relative mRNA expression was at background levels in the early retina for both enzymes (st25–30). ADAR1 increased above background levels from st30 with an approximately four-fold increase from st45 to 6 months, whereas ADAR2 raised above background levels from st35 with an approximately five-fold increase from st45 to 6 months (Fig. S1).
Expression of α3 subunit mRNA
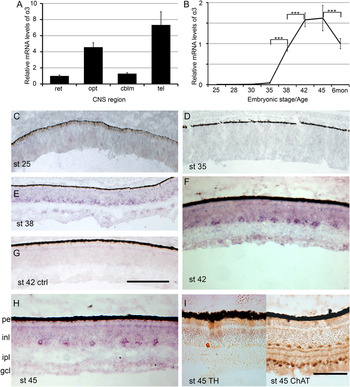
We analyzed the relative mRNA levels of the α3 subunit using qRT-PCR. The level in adult retina and brain regions is shown in Fig. 2A. Retinas from different developmental stages were analyzed and the expression was at background levels at st25 and 28, above background at st30 and 35 with peak values at st42–45, followed by a decrease in the adult 6-month retina (Fig. 2B).
Expression of GABAA receptor α3 subunit messenger RNA (mRNA) in chick retina. Analysis of relative GABAA receptor α3 subunit mRNA expression by using quantitative reverse transcription PCR in (A) 6-month-old retina, optic tectum, cerebellum, and cerebrum (telencephalon) and (B) developing retina from st25–45 and 6-month retina. Error bars ± s.d., n = 4, one-way ANOVA, Tukey’s multiple comparison test ***P < 0.001. (C–H) Bright-field micrographs showing α3 subunit in situ hybridization analysis of mRNA expression of chick retina from st25–45 as indicated in panels (C–F) and (H). (G) Negative hybridization control using a sense probe. (I) Bright-field micrographs showing immunohistochemistry for tyrosine hydroxylase (left) and choline acetyltransferase (right) in chick retina stage 45. cblm, cerebellum; ChAT, choline acetyltransferase; gcl, ganglion cell layer; inl, inner nuclear layer; ipl, inner plexiform layer; opt, optic tectum; pe, pigment epithelium; st, Hamburger & Hamilton developmental stage; ret, retina; tel, telencephalon; TH, tyrosine hydroxylase. Scale bar in (G) is 100 μm also valid for (C–E), bar in (I) is 50 μm also valid for (F and H).

We analyzed the localization of the α3 subunit mRNA expression by using in situ hybridization analysis of retina from five different embryonic stages: st25, 35, 38, 42, and 45. The staining was below detection at the early stages from st25 to 35. At st38, staining was seen in cells in the inner nuclear layer on the portion toward the inner plexiform layer (Fig. 2E) and in cells in the ganglion cell layer. At st42 and 45, staining was in separate cells, mainly in the inner nuclear layer (Fig. 2F and 2H). The α3 subunit mRNA sense-control probe did not give any staining at any stage as exemplified by st42 (Fig. 2G). The localization and number of the α3 subunit mRNA-labeled cells were compared on adjacent sections of st45 retinas (Fig. 2H) to cells that were immunoreactive for TH or ChAT (Fig. 2I). The positive cells were calculated: 368 ± 21 (s.d.) α3 subunit-positive cells, <15 TH cells, and 899 ± 36 (s.d.) ChAT cells per retinal section.
Relative expression of GABAA receptor subunits in the retina
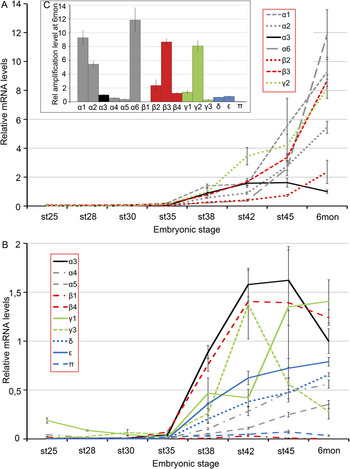
We wanted to know if the temporal change of mRNA levels of the α3 subunit was similar to that of other GABAA subunits. Therefore, the mRNA expression of 16 GABAA receptor subunits (α1-6, β1-4, γ1-3, δ, ε, and π) was analyzed and compared in the retina. The amplification levels for each subunit were related to the α3 subunit level in the 6-month retina (Fig. 3). The results from the 16 subunits were divided in two graphs: subunits with high amplification levels (Fig. 3A) and subunits with low amplification levels (Fig. 3B), relative to that of α3. The expression of the majority of the subunits followed a pattern with increased levels after st30–35, although to different extents. The mRNA levels of β1 and π subunits were very low. Similarly to the α3 subunit expression levels, β4 and γ3 subunit expression peaked late in development with a decrease by the age of 6 months. The amplification levels for each subunit at 6 months are shown in Fig. 3C, relative to the α3 levels. Individual line graphs with relative mRNA levels of all subunits can be found in Fig. S2. Noteworthy is that α4 and γ1 had slightly increased levels at the earliest stages of the analysis (Fig. S2D and S2K).
Relative messenger RNA (mRNA) expression of 16 GABAA receptor subunits during chick retinal development. Line graphs depicting the relative mRNA levels of GABAA receptor subunits in developing chick retina from st25 to 45 and in 6-month chick retina analyzed by using quantitative reverse transcription PCR. All levels were first normalized to β-actin and TATA box–binding protein and were then related to the 6-month α3 amplification level. Subunits with relative amplification levels (A) higher than α3 and (B) lower than α3. Black plotline for α3 in graph (A and B). Gray plotlines for α subunits; red lines for β subunits; green lines for γ subunits; and the blue lines δ, ε, and π subunits. For line graphs of each individual subunit see Fig. S2. Error bars ± s.d., n = 4. mon, months; st, Hamburger & Hamilton developmental stage.

Expression of chloride cotransporters NKCC1 and KCC2
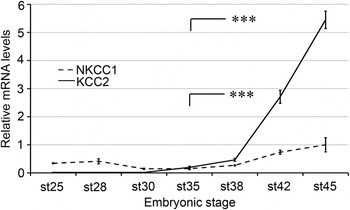
The shift from excitatory to inhibitory actions by the GABA system is in part a result of altered chloride ion transport and is regulated by the ubiquitous Na2+–K+–2Cl− cotransporter (NKCC1) and neuron-specific K+–Cl− cotransporter (KCC2). Increased expression of the KCC2 transporter during central nervous system development has been described as a key event in this shift (Rivera et al., Reference Rivera, Voipio, Payne, Ruusuvuori, Lahtinen, Lamsa, Pirvola, Saarma and Kaila1999; Ben-Ari, Reference Ben-Ari2002). We wanted to compare the timing of α3 subunit expression and the RNA editing with this shift during retinal development, and we therefore analyzed the temporal expression of NKCC1 and KCC2 mRNA in the retina. Both mRNAs were expressed in the retina. While the NKCC1 expression did not change notably during development, there was a clear increase in the levels of KCC2 after st38 (Fig. 4).
Relative messenger RNA (mRNA) levels of the chloride ion cotransporters NKCC1 and KCC2 during chick retinal development. Line graph depicting the relative mRNA levels of NKCC1 and KCC2 in developing chick retina from st25 to 45 and in 6-month chick retina analyzed by using quantitative reverse transcription PCR. All levels were normalized to β-actin and TATA box–binding protein and were then related to the levels of st45 NKCC1. Error bars ± s.d., n = 4, one-way ANOVA, Tukey’s multiple comparison test ***P < 0.001. st, Hamburger & Hamilton developmental stage.

Discussion
A-to-I editing has been ascribed to increase the functional complexity of several neural receptors. In this work, we have studied the editing of transcripts encoding the α3 subunit of the GABAA receptor and its expression in chicken retina during development. A-to-I editing of the α3 transcript occurred in the chick retina as shown by sequencing and the extent of editing was developmentally regulated. The frequency of editing increased from 15% at st30 (E6.5) retina to 90% at st45 and 95% in adult retina. Among 16 GABAA receptor subunits in chicken retina, all but the π and β1 subunits had expression elevated above background levels. The majority of the subunits had increased mRNA expression levels after stage 35 (E8–9) but with large variations and different profiles (Fig. 3A and 3B). This general increase in GABA receptor subunit expression occurred concomitantly with an increase of the chloride cotransporter KCC2, which is generally thought to contribute to the shift of the GABA system from excitation to inhibition.
The in situ hybridization result showed GABAA receptor α3 subunit expressing cells on the vitreal side of the inner nuclear layer (Fig. 2E, 2F, and 2H), which suggested that the cells may be amacrine cells or displaced ganglion cells. Staining was also seen over cells in the ganglion cell layer in st38–42 retinas, but this was below detection at the later stages. In rat and mouse, the α3 subunit has been shown to be expressed by dopaminergic amacrine cells (Greferath et al., Reference Greferath, Grunert, Fritschy, Stephenson, Mohler and Wassle1995; Gustincich et al., Reference Gustincich, Feigenspan, Sieghart and Raviola1999) and by alpha ganglion cells (Koulen et al., Reference Koulen, Sassoe-Pognetto, Grunert and Wassle1996). Comparison of the α3 subunit in situ hybridization pattern in the st45 retina to immunostaining for TH-positive chick dopaminergic amacrine cells (Gardino et al., Reference Gardino, dos Santos and Hokoc1993; da Silva et al., Reference da Silva, Hokoc, de Mello and Gardino2009) and cholinergic type 1 amacrine cells (Spira et al., Reference Spira, Millar, Ishimoto, Epstein, Johnson, Dahl and Morgan1987) showed that the laminar position of the cells was similar. The TH-positive cells were much fewer and the ChAT-positive cells more abundant than the α3 subunit expressing cells in the st45 retina. This showed that the α3 expressing cells are neither identical with the dopaminergic amacrine cells nor with the cholinergic ones, but it does not exclude that chick dopaminergic amacrine cells also express the α3 subunit, which is the case in rat and mouse (Greferath et al., Reference Greferath, Grunert, Fritschy, Stephenson, Mohler and Wassle1995). The α3 subunit–expressing cells in chick could not be further identified because the available and specific antibodies to GABAA receptor subtypes do not work on chick tissue in our hands, and double in situ hybridization protocols were not compatible with the weak labeling.
The transcript of chicken α3 subunit is subjected to increasing RNA editing during the period from st35–45. Editing at the I/M site of the α3 subunit mRNA in mice has been shown to alter the GABA sensitivity and generate receptors with slower activation and faster deactivation rates (Rula et al., Reference Rula, Lagrange, Jacobs, Hu, Macdonald and Emeson2008; Nimmich et al., Reference Nimmich, Heidelberg and Fisher2009). The position of the altered amino acid (I-to-M) in the third membrane-spanning domain of the α3(M) subunit is in the vicinity of a mutation found in the α1 subunit (A322D) that gives comparable effects on GABA sensitivity (Fisher, Reference Fisher2004), corroborating the data showing that the editing alters GABAA receptor properties. The nonedited α3(I) subunit confers a higher sensitivity to GABA, and this subunit is the dominating form early when GABA is depolarizing. Therefore, cells expressing unedited α3 containing receptors at st30–35 may contribute to and allow excitatory responses. Moreover, with the edited α3(M) subunit, the mature cells are better suited to the inhibitory functions of the GABA system (Rula et al., Reference Rula, Lagrange, Jacobs, Hu, Macdonald and Emeson2008; Nimmich et al., Reference Nimmich, Heidelberg and Fisher2009).
The expression of α1, α2, α6, β2, β3, and γ2 increased during late development and remained high in the adult retina (Fig. 3A). As expected, α1 and γ2 were among the highest expressed subunits in the retina, in agreement with that they are considered to be ubiquitous and take part in synaptic transmission (Farrant & Kaila, Reference Farrant and Kaila2007). The α6 transcript was also highly expressed in the retina, which was somewhat unexpected since it is thought to be confined to granule cells of the cerebellum and inferior colliculus in mammals (Lüddens et al., Reference Lüddens, Pritchett, Kohler, Killisch, Keinanen, Monyer, Sprengel and Seeburg1990). The expression of α6 together with α4 and δ subunits is also associated with the occurrence of tonic GABAA inhibition (Belelli et al., Reference Belelli, Harrison, Maguire, Macdonald, Walker and Cope2009). Both α4 and δ subunits were expressed in the retina but at an amplification level that was below that of α6. The π subunit is not expressed in nervous tissue (Farrant & Kaila, Reference Farrant and Kaila2007), and its expression was similar to background levels in the retina. The low β1 subunit expression was unexpected since it is expressed in the rat retina (Koulen, Reference Koulen1999). The chick β1 subunit (GABRB1) sequence is more divergent than that of its ortho- and paralogues (Table S1). This may suggest a relaxed evolutionary constraint that could also lead to altered expression of the chick β1 subunit. Furthermore, the annotation of the chick GABRB1 gene is therefore ambiguous and it has been annotated as chick GABRB4. However, conserved synteny and the phylogeny of the family members argue that chicken GABRB4 and GABRB1 are different genes (supporting data Table S1).
The mRNA levels of the chloride pump KCC2 increased after st30 from background levels with a major increase after st38 (Fig. 4). The expression of the chloride-accumulating pump NKCC1 had a different developmental profile with no significant changes from st25 to 45. The relation between the expression of the pumps was reversed by st35 with higher NKCC1 levels early compared to the background levels of KCC2 at time points before st35 (Fig. 4). This reverse relation between the pumps at early and late time points is in agreement with their role in the shift from excitatory GABA actions. The involvement of the NKCC1 pump in the accumulation of chloride ions in developing mouse retinal neurons has, however, been challenged (Zhang et al., Reference Zhang, Delpire and Vardi2007). The increase of the KCC2 was robust, and this suggests that the switch from depolarizing to hyperpolarizing receptor actions may be after st35. The GABAA receptors may exert inhibitory postsynaptic potentials in chicken retina first after embryonic day 8 or 9, and from this time, the degree of editing of the α3 receptor is increasing. This gives support to a hypothesis that the increased editing of α3 may contribute to the adjustment of the GABAA receptor properties in association with this switch. It has been suggested that editing of α3 affects the assembly and/or the intracellular transport to the cell membrane (Daniel & Öhman, Reference Daniel and Öhman2009). It is therefore possible that the editing event at later developmental stages contributes to a lower surface expression of α3-containing receptor in favor for receptors assembled with α1 that are more suitable for inhibitory signals.
The subunits α4 and γ1 had elevated levels early at st25 compared to st35 (Fig. 3B and Fig. S2), suggesting that these subunits participate in processes that precede synaptic signaling. GABAA receptor activation in neural crest stem cells regulates cell cycle progression (Represa & Ben-Ari, Reference Represa and Ben-Ari2005; Andäng et al., Reference Andäng, Hjerling-Leffler, Moliner, Lundgren, Castelo-Branco, Nanou, Pozas, Bryja, Halliez, Nishimaru, Wilbertz, Arenas, Koltzenburg, Charnay, El Manira, Ibanez and Ernfors2008), and those cells express the α4 and γ1 subunits. Such “early” retinal GABAA receptors may be involved in nonsynaptic regulatory events in retinal neurons in a similar way as GABAA receptor activation decreases the proliferation of cortical precursor cells (LoTurco et al., Reference LoTurco, Owens, Heath, Davis and Kriegstein1995; Nguyen et al., Reference Nguyen, Malgrange, Breuskin, Bettendorff, Moonen, Belachew and Rigo2003).
In conclusion, the transcript for the chick GABAA receptor α3 subunit is A-to-I edited. It is expressed in the retina during development, and the editing increases with age. The α3 subunit is expressed in relatively few cells in the inner nuclear and ganglion cell layer of the retina. The α3 subunit is the only subunit shown to be RNA edited among the 16 GABAA receptor subunits, and this suggests that GABA receptor RNA editing in the retina has an impact restricted to a limited number of retinal cells. The editing was shown to increase after st35 (E8–9) at the same time as the suggested switch from excitatory to inhibitory GABA actions in the developing retina.
Acknowledgments
We thank Alexandra Rundberg for assistance with the qRT-PCR analysis. The work was supported by the Swedish Research Council, Swedish Foundation for Strategic Research, Kronprinsessan Margaretas arbetsnämnd för synskadade, and Synfrämjandets forskningsfond.