I. INTRODUCTION
Million tons of pollutant water containing various dyes was released every year. Unfortunately, most pollutant dyes are quite stable in natural cycle. Due to bioconcentration effect, some of them will eventually come into human bodies, causing serious health issues. Therefore, the pollutant dyes in waste water should be reduced to a safe level before being released. In the past several years, semiconductor-based photocatalysis is widely investigated for dye degradation due to its effectiveness and low cost. Reference Wang, Zhang, Chen, Hu, Li, Wang, Liu and Wang1
Semiconductor was widely used as photocatalyst in water treatment. Many semiconductor catalysts like TiO2, ZnO, SnO2, WO3, SiO2, Fe2O3, CeO2, CdS, and SnS2 have been attempted for the photocatalytic degradation of a wide variety of environmental contaminants. Reference Uddin, Nicolas, Olivier, Toupance, Servant, Müller, Kleebe, Ziegler and Jaegermann2–Reference Li, Zhu and Li7 Among them, titanium dioxide (TiO2) has been most intensively studied. Reference Guo, Zhang, Lin and Wang8 TiO2 has a band gap of 3.2 eV, corresponding to photo energy with wave length of 400 nm and can thus only be excited by near ultraviolet (UV) radiation below wave length of 400 nm. As the UV light only accounts for approximately 5% of the total solar spectral, to enhance the overall energy conversion efficiency of solar energy for dye mineralization, development of visible light responsive photocatalyst has been highly desired.
Zhu and co-workers reported that ZnWO4 exhibited relatively high photocatalytic activity for the degradation of aqueous solutions containing rhodamine B (RhB) and methylene blue. Reference Lin, Lin and Zhu9,Reference Shi, Wang, Li, Xu and Zhu10 However, ZnWO4 is only active under UV light illumination due to its wide band gap. On the other hand, CuWO4 is a well-known n-type semiconductor that has been widely used as a laser host material, scintillation detectors, optical fibers, electrodes for photoelectrolysis, etc. Reference Butler11–Reference Pandey, Bhave and Kharat13 The band gap (E g) of CuWO4 has been experimentally measured to be approximately 2.3 eV (Ref. Reference Ruiz-Fuertes, Errandonea, Segura, Manjón, Zhu and Tu14) and approximately 2.06 eV, Reference Benko, MacLaurin and Koffyberg15 which are apparently suitable band gaps for photocatalytic reactions under visible light. It was also reported that CuWO4 is more stable against photocorrosion than WO3 in aqueous solution at neutral pH. Reference Yourey, Pyper, Kurtz and Bartlett16,Reference Hill and Choi17 CuWO4 is capable of degradation of methanol, chlorophenol, methylene blue, and methyl orange in aerated aqueous suspensions under visible light. However, the reported efficiencies are still low because of its high charge recombination rate both in bulk and at the surface of the material. Reference Montini, Gombac, Hameed, Felisari, Adami and Fornasiero18,Reference Chen, Leng and Xu19 It is therefore desirable to find effective method for the improvement of the photocatalytic activity of CuWO4. A general strategy is to retard recombination of the charge carriers through surface modification. Doping and surface modification with heterojunction could be a possible pathway to achieve high photocatalytic activity.
Herein, series CuWO4 based photocatalysts doped with a small amount of Zn were prepared by a facile one-pot precipitate–calcination method. We will demonstrate their high photocatalytic activity for efficient degradation of RhB under visible light. A low amount of Zn doping (0.1 wt%) into CuWO4 was found to be effective to significantly enhance its activity. The effect of the Zn doping on the photochemical properties, crystal structure, and photocatalytic performances of CuWO4 were discussed in detail in this study.
II. EXPERIMENTAL SECTION
A. Preparation of photocatalysts
The preparation of CuWO4/Cu1−x Zn x WO4/ZnWO4 photocatalyst was conducted by coprecipitation in aqueous solution. All chemicals were of analytical grade and used as purchased without further purification. An appropriate amount of Cu(NO3)2·6H2O and Zn(NO3)2·6H2O were dissolved in deionized water to give Cu2+ concentration of 0.1 mol/L and Zn2+ concentrations with different Zn/Cu ratios. Then aqueous solution of Na2WO4 (0.1 mol/L) was slowly added dropwise into the aqueous solution of nitrates, which was continuously stirring during the 30 min reaction. The obtained precipitate was then washed with deionized water for 3 times and dried in an oven at 75 °C for 5 h. At last, the photocatalysts were calcined at 500 °C for 5 h in air.
B. Characterization
The x-ray diffraction (XRD) patterns of catalysts were carried out on PANalytical X'pert Pro x-ray diffractometer equipped with Cu Kα irradiation. And all the samples were scanned with a step size of 0.033° by 2θ. The diffuse reflectance ultraviolet-visible (UV-vis) spectra of the photocatalysts were measured on a HITACHI UV4100 (Hitachi Corp., Tokyo, Japan) instrument used with a labsphere diffuse reflectance accessory. The nanometric structure and the morphology of the catalysts were determined on a field emission scanning electron microscope (SEM) JSM-6700F (JEOL Ltd., Tokyo, Japan) and a transmission electron microscope (TEM) JEM-3010 (JEOL Ltd.). For Mott–Schottky test, the catalyst was applied on an F-doped SnO2 conducting glass (FTO) substrate and dried in an oven at 60 °C to be used as a working electrode. The test was conducted using a CHI760D potentiostat (CH Instruments, Shanghai, China) with A Pt foil as counter electrode, an Ag/AgCl electrode as reference electrode and 0.5 M Na2SO4 aqueous solution as electrolyte.
C. Evaluation of photocatalytic activity
For photocatalytic degradation of RhB, 40 mg photocatalyst was dispersed in an aqueous solution containing RhB (2.5 mmol/L, 200 mL) with magnetic stirring. A 30 min dark reaction was needed before photocatalytic reaction to reach adsorption equilibrium. The photocatalytic reaction was performed under visible light from a 300 W Xe lamp with a 420 nm cutoff filter. 3 mL aliquots were sampled and centrifuged under 10,000 RPM every 60 min during photocatalytic reaction. The degradation rate was measured by the relative intensity of UV-vis spectra. It is believed that when absorption is lower than 1, concentration has first-order linear relationship with its light absorption.
III. RESULTS
A. XRD and Raman characterization
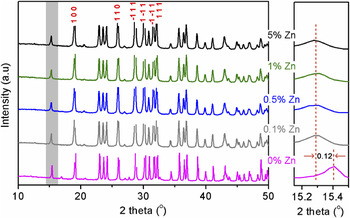
Figure 1 shows the XRD patterns of CuWO4 doped with different ratios of Zn ion. The diffractions can be ascribed to triclinic structure of CuWO4. Reference Ruiz-Fuertes, Errandonea, Segura, Manjón, Zhu and Tu14,Reference Benko, MacLaurin and Koffyberg15 Generally, no obvious difference can be found for these samples, suggesting their similar structures. However, a close investigation of the patterns around 15° clearly reveals some discrepancies. When doped with Zn ion, diffraction peak shifted to lower degree. Even a very small amount of Zn doping, i.e. 0.1 wt%, leads to significant shift of 0.12°. According to Bragg solution, shifting to lower degree indicates larger volume of unit cell. Considering larger size of Zn than Cu ion, the volume of photocatalyst is expected to be stretched when Cu ions are substituted by Zn. Our XRD results indicated that Zn ions were successfully doped into CuWO4 and even a small amount of Zn doping could have significant effects on the crystal structure of CuWO4. Interestingly, no further shift was observed even with 5 wt% Zn ions of further doping, indicating that saturated doping level of Zn ions in CuWO4 should be very small.
XRD patterns of CuWO4 doped with different ratios Zn ions.

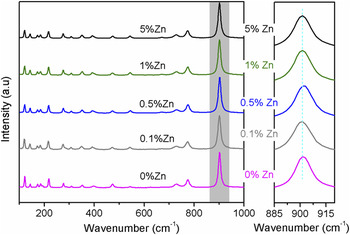
Figure 2 shows the Raman patterns of CuWO4 doped with different ratios of Zn ion. Again, the five samples have similar patterns. When samples were doped with Zn ion, there was no new peak emerged, and the peaks had slightly shifted to lower wave number as shown by the peak around 900 cm−1. Base on this phenomenon, we can infer that the force constant of CuWO4 doped with Zn ion should be decreased compared with that of pure CuWO4. It suggests the lengthening of chemical bond and the decreasing of electronegativity due to the Zn ion doping into the cell of CuWO4. Here the length of Zn–O and Cu–O was estimated to be approximately 2.1 and 1.98 Å, respectively, and the electronegativity of Cu and Zn was 1.9 and 1.6, respectively. Besides, the diffraction peaks of CuWO4 become weaker and the widths of the diffraction peaks become slightly wider with increasing Zn content, indicating a decrease in the crystallinity and the average crystallite size. Herein, Figs. 1 and 2 combined clearly indicateing that Zn ions was well doped into the cell of CuWO4 but would not destroy its crystal structure even with heavy doping of 5 wt%.
Raman patterns of CuWO4 doped with different ratios of Zn ions.

B. UV-visible diffuse reflection spectrum
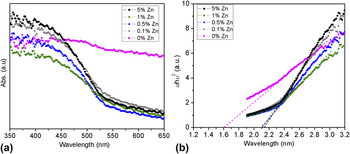
Figure 3(A) shows diffuse reflectance spectra of CuWO4. It can be seen from Fig. 2 that pure CuWO4 does not have distinct absorption edges and have a strong absorption throughout the whole visible light region tested, i.e., 400–600 nm. However, the other doped samples show evident absorption edges. Using the Kabelka–Munk function, Reference Kim, Atherton, Brigham and Mallouk20 the energy band gap can be estimated. As shown in Fig. 3(B), all the doped samples have nearly the same band gaps, about 2.10, 2.10, 2.09, and 2.13 eV, respectively, after doping 0.1, 0.5, 1, and 5% Zn2+. The band gap of CuWO4 has been calculated to be 1.6 eV. The enlarged band gap for the doped CuWO4 samples should originate from the Zn ions, which usually possesses elevated conduction band levels. Again, the independence of the band gap values with the doping amount implied that only a same and meanwhile small amount of Zn ions can be doped into the lattice matrix of CuWO4, leading to the formation of localized Zn1−x Cu x WO4 (x ≈ 1 and x < 1) solid solution. These results are consistent with our XRD and Raman analyses. On the other hand, the rest Zn ions should be combined with WO4 2−, resulting in the formation of ZnWO4.
(a) Diffuse reflectance Uv-vis spectra and (b) Tauc plot derived from Uv-vis spectra of CuWO4 doped with different ratios Zn ions.

C. Morphology characterization
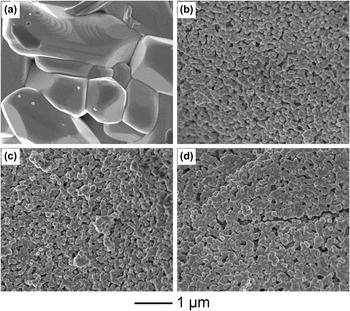
It is worthy pointing out that the solubility product constant (K sp) of CuWO4 is much higher than that of ZnWO4. Reference Dean21 Consequently, we believed that ZnWO4 particles will be localized at the surface of CuWO4 crystals. To this end, SEM and TEM were conducted to evaluate the surface morphologies and nanostructures of these samples. Figure 4 shows SEM images of various Zn ion doped CuWO4 crystals. It is obvious that pure CuWO4 has clearly different morphologies in comparison to those doped samples. Moreover, the crystal size of pure CuWO4 is more than 1 µm. On the contrary, Zn ion doped CuWO4 samples compose of well-crystallized small particles of around 100 nm in size. It has been reported that the existence of a foreign cation in the solid solution will significantly influence the crystal in terms of both size and morphology. Reference Zheng, Tao, Liu, Zeng, Yu, Ma, Moran, Wu, Zhu and Liu22,Reference Xia, Xiong, Lim and Skrabalak23 In this case, the excessive Zn2+ or ZnWO4 absorbed on the surface of the CuWO4 clusters will prevent further growth of substrate crystal. As a result, Zn ion doped CuWO4 samples showed decreased crystal size. Especially, the small particle size shall provide more surface reactive sites, hence contributing to improved photocatalytic activity.
SEM micrographs of CuWO4 doped with different ratios Zn ions: (a) 0%, (b) 0.1%, (c) 1%, (d) 5%. All images with same scale bar (1 µm).

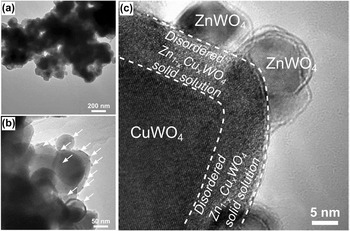
Figure 5 shows TEM images of 0.1% Zn2+ doped CuWO4 samples. The sample is the aggregation of spherical particles of size 100 nm, which is consistent with our SEM observations. More importantly, some smaller clusters covered on surface of these spherical substrates can be observed. These spherical substrates and clusters are demonstrated to be Zn1−x Cu x WO4/CuWO4 and ZnWO4 by high-resolution TEM characterization as shown in Fig. 5(c). The formation of such heterostructure and thereby junction is considered important for the improvement of photocatalytic activity, which has been proved in many semiconductor-based photocatalysts. Reference Zong, Yan, Wu, Ma, Wen, Wang and Li24,Reference Wang, Xu, Li, Shen, Wang, Wang, Feng, Shi, Han and Li25 In our study we establish the surface structure model of the doped nanocrystals as the formation of CuWO4/Cu1−x Zn x WO4/ZnWO4 sandwiched heterojunction, which is expected to be preferable for charge separation enhancement, compared to traditional heterojunctions, as will be shown later by our photocatalytic test.
TEM micrographs of CuWO4 doped with 0.1% Zn ion at (a) low magnification, (b) higher magnification, and (c) high-resolution images.

D. Photocatalytic activity
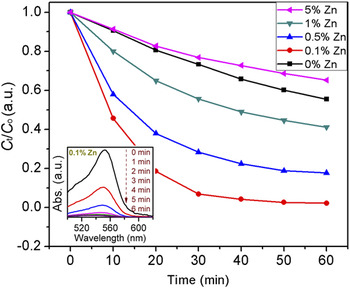
Visible-light-driven (300 W Xenon light with a 420 nm cutoff filter) photocatalytic degradation of RhB reaction was performed over our CuWO4 based photocatalysts using a 10 mL sealed cuvette-made reactor. The results are shown in Fig. 6. Clearly, most doped samples showed enhanced activity. The high photocatalytic activity of these photocatalysts exhibited a nonsensitized visible photocatalysis mechanism that is significantly different from that of other metal oxide semiconductors such as TiO2. Reference Chen, Zhao, Lei, Zhao and Serpone26 Among them, CuWO4 doped with 0.1% Zn2+ showed the highest activity toward RhB degradation. About 80% degradation was achieved within 20 min. Higher doping level resulted in slight decrement of the degradation rate. Our results indicated that the content of Zn2+ initially introduced should be less than 1%. Otherwise, the activity of would drop to be even lower than the nondoped sample, as shown for 5% Zn2+ sample. As aforementioned, ZnWO4 showed no activity under visible light irradiation. Excessive ZnWO4 nanoparticles formed at the surface of the CuWO4/Zn1−x Cu x WO4 solid solution therefore will block photons from reaching the underlying CuWO4/Zn1−x Cu x WO4 regions. On the other hand, excessive ZnWO4 nanoparticles will inevitably cover the active sites of CuWO4/Zn1−x Cu x WO4 and preventing the organic dyes from being absorbed to these sites. Moreover, a proper amount of ZnWO4 clusters should be crucial for the optimized surface heterojunction effect. Taken together, Zn2+ introduced in the synthesis should be restricted at a very low level, i.e., 0.1%, to achieve higher reactivity.
The performance of photocatalytic degradation under visible light irradiation. Inset: the UV-vis spectra pattern of RhB solution during degradation with 0.1% Zn2+ doped CuWO4 sample.

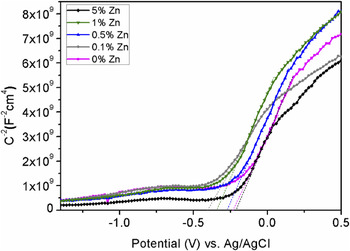
To better understand the mechanism of charge transfer, Mott–Schottky analysis on the as prepared samples were conducted. The positive slope of the Mott–schottky plots in Fig. 7 indicates n-type behavior of all samples. The energetic position of conduction band edge for a semiconductor can be estimated by the flat band potential, V fb. The Mott–schottky plot is a plot of the capacitance of the space charge region to the applied potential as shown by the following equation, Reference Cardon and Gomes27
 $${1 \over {{C^2}}} = \left( {{2 \over {e{N_{\rm{d}}}{\varepsilon _0}\varepsilon }}} \right)\left| {V - {V_{{\rm{fb}}}}} \right|,$$
where N d is the bulk concentration of donors, e is the electronic charge unit, ε0 and ε are the permittivity of vacuum and the dielectric constant of the semiconductor, respectively. The x-intercept of reciprocal capacity against the applied voltage gives the flat band potential V fb, and carrier concentration N d can be calculated from the slope of the linear region.
Mott–Schottky plots of CuWO4 doped with different ratio Zn ions.

The results of Mott–Schottky analysis demonstrated that the E fb of CuWO4 doped with 0, 0.1, 0.5, 1, 5% Zn ion are −0.21, −0.41, −0.27, −0.34, −0.23 V (vs. Ag/AgCl), respectively. Herein, the E fb of CuWO4 can be adjusted through doping with Zn ion and more negative one show favorable activity of degradation under visible light radiation. Again, CuWO4 doped with 0.1% Zn ion shows the most negative E fb, which also gives the best photocatalytic performance.
Our results indicated that pure CuWO4 has a low activity for photocatalytic degradation of RhB under visible light. As mentioned before, CuWO4 has not been utilized for photocatalytic degradation due to its low conduction band than that required for proton reduction. Figure 6 indicates that the conduction band of CuWO4 could be elevated by Zn doping to a value high enough to drive redox reaction. It has been reported by Cheng et al. Reference Cheng, Leng, Liu, Zhang and Cao28 that the valence band of the WO3 electrode will shift to a more positive value due to Zn doping. Additionally, we found that existence of Zn ions could stabilize the crystal structure of CuWO4 especially its stability in strong redox environment as in our photocatalytic process.
IV. CONCLUSION
Zn doped CuWO4 was prepared by a facile precipitate–calcination method. It was found that CuWO4 doped with only 0.1% Zn showed the highest activity for degradation of RhB under irradiation of visible light. For pure CuWO4, the activity is very low and with more Zn doping, the activity of CuWO4 significantly decreased. It was assumed that Zn doping could modify the band structure of the CuWO4 and consequently make it active for photocatalytic degradation. Our result indicated the formation of tandem CuWO4/Cu1−x Zn x WO4/ZnWO4 sandwiched heterojunction, which has been demonstrated an enhanced photoactivity. The current work indicates that the heterojunction of CuWO4/Cu1−x Zn x WO4/ZnWO4 has great potential applications in the field of photocatalytic devices and photocatalysis for water treatment. Our finding is also expected to be valuable for the exploration of CuWO4-material as a new group of efficient photocatalysts.
ACKNOWLEDGMENTS
This work was supported by the National Natural Science Foundation of China (No. 51236007).