


INTRODUCTION
On July 20, 2013, Mohamed al-Arefe, a popular Saudi religious leader affiliated with the Sahwa movement, was imprisoned without formal charges. His imprisonment came after he circulated comments and videos to his millions of Twitter and Facebook followers supporting the Muslim Brotherhood, an organization the Saudi regime views as an existential threat (Lacroix Reference Lacroix2014). Hundreds of thousands of Saudis identify with the ideas of the Sahwa movement, even though its formal organizations have been repressed and co-opted by the state (Lacroix Reference Lacroix2011). Following al-Arefe’s arrest, his online supporters were outraged, and the hashtag #FreeMohamadalArefe quickly went viral.
On November 30, 2014, Loujain al-Hathloul live-tweeted her attempt to drive into Saudi Arabia from the United Arab Emirates as part of the #Women2Drive movement. Beginning in 2011, the #Women2Drive social media campaign generated a tide of videos of women defying the Saudi ban on women driving, increasing the domestic and international visibility of protest against these Saudi policies. Al-Hathloul was stopped at the Saudi border, and as we know from her continued tweets, her passport was confiscated and she was kept in her car without water overnight. In the morning, al-Hathloul was told to drive into Saudi Arabia, where she was immediately taken into police custody (Mackey Reference Mackey2014). Al-Hathloul’s tweets and the hashtag #FreeLoujain spread rapidly online.
Saudi Arabia is an absolute monarchy and theocracy with great oil wealth. It is also one of the least free and most repressive countries in the world.Footnote 1 As a Saudi activist wrote in 2014:
Saudis live under repression, in fact we breathe repression with the air; it haunts us in our dreams. It is our hell before we encounter hell. Even our appearance, streets, and houses are designed by repression. Repression has shaped the media, religion, security services, universities, and institutions (Al-Rasheed Reference Al-Rasheed2016, 119).
In Saudi Arabia, traditional media is tightly controlled. Political dissent is criminalized. Political parties, trade unions, political demonstrations, and strikes are banned. All types of organized opposition are suppressed. Formal social movement organizations are largely absent or short-lived.Footnote 2 When a rare on-the-ground protest occurs, it is violently quashed (Ménoret Reference Ménoret2016). In the past decade, many activists and reformers have turned to online platforms to sustain their social movements. They use social media to distribute information about their causes, to organize and facilitate offline protests, to disseminate online petitions, and to organize online campaigns such as the #Women2Drive movement.
The Saudi regime has reacted to this online mobilization by stepping up online censorship—for example, blocking websites promoting Shia rights and those affiliated with the Muslim Brotherhood (Ibahrine Reference Ibahrine2016; Noman, Faris, and Kelly Reference Noman, Faris and Kelly2015).Footnote 3 But increasingly, the regime has turned to physical repression, which we define following Cingranelli and Richards (Reference Cingranelli and Richards2010) as violations of physical integrity rights. Dozens of high-profile individuals connected to diverse social movements in Saudi Arabia have been imprisoned, publicly flogged, and tortured for using social media to criticize the regime and to mobilize support for political and social reforms (Alabaster Reference Alabaster2018; Calamur Reference Calamur2018; ESHR 2017; Human Rights Watch 2018a).
Repression of individuals for their online speech is not limited to Saudi Arabia. In 2017, more than thirty countries—including authoritarian regimes such as China, Russia, and Iran, and democracies such as India, Mexico, and Lebanon—used repression to rein in online expression. The most frequent targets were prominent figures with large online followings—who we refer to as “online opinion leaders”—including journalists and dissidents. Political imprisonment and torture were the most common forms of repression, but people in eight countries were executed in 2017 for speaking out about sensitive subjects online (Freedom House 2017).
Despite governments’ increased use of repression to control online expression and mobilization, we know very little about what happens when physical repression is used to suppress online dissent. There is a substantial literature on offline repression and its effects on offline mobilization.Footnote 4 There is also a great deal of research on how online mobilization reinforces offline mobilization and generates new pathways for dissent.Footnote 5 However, research on efforts by governments to quash online mobilization has focused mainly on online censorship and online disinformation campaigns.Footnote 6
We provide the first large-scale, systematic study of the effects of offline repression on online dissent. The form of offline repression we focus on is political imprisonment, and the type of online dissent we study are criticisms of the Saudi regime and calls for political and social reform.Footnote 7
We build on the repression, online mobilization, and censorship literatures to test three mechanisms by which repression might deter dissent: direct deterrence, indirect deterrence, and downstream effects. Direct deterrence occurs when individuals who experience repression rein in their behavior for fear that they will be punished again in the future (Jenkins and Perrow Reference Jenkins and Perrow1977; Oberschall Reference Oberschall1973; Tilly Reference Tilly1978). Indirect deterrence occurs when observers of repression—those who see it but are not directly targeted—change their behavior for fear that they too will be subjected to repression (Durkheim Reference Durkheim1984; Walter Reference Walter1969). Repression might also affect those who do not experience or even observe repression through the downstream effects resulting from changes in the behavior of those who are directly repressed. For example, if an online opinion leader becomes supportive rather than critical of the government following repression, this change in sentiment may trickle down and be repeated by their followers. Finally, instead of acting as a deterrent, repression could cause backlash and intensify dissent among those targeted or among supporters or bystanders who are mobilized by observing repression (Sullivan and Davenport Reference Sullivan and Davenport2017; Young Reference Young2017).
We identify well-known individuals imprisoned by the Saudi regime for online dissent between 2010 and 2017.Footnote 8 We collect and analyze over 300 million tweets, as well as daily and weekly Google search data for the same time period. First, these data allow us to disaggregate the effects of repression on different actors and online behaviors. We analyze tweets by imprisoned online opinion leaders, tweets by non-imprisoned online opinion leaders, as well as tweets by individuals who retweeted, mentioned, or replied to the imprisoned leaders on Twitter prior to their arrests, who we refer to as “engaged followers.” We also analyze online search behavior of the general public. Second, these data enable us to measure changes in both the volume and substance of online activity. Third, our data allow us to assess changes in both public expression (tweets) and private interest (Google searches). Finally, our data enable us to examine the immediate consequences of repression as well as its effects up to one year later. We focus on content produced on Twitter because Saudi Arabia has one of the highest levels of Twitter penetration in the world,Footnote 9 Saudis frequently discuss politics on Twitter (Noman, Faris, and Kelly Reference Noman, Faris and Kelly2015), and Twitter’s networked structure enables us to examine the behavior of diverse actors on the same platform.
We find that Saudi online opinion leaders who were imprisoned were deterred from dissent. They decreased their online activity, reined in their criticisms of the state, and halted calls for reform after they were released. The altered content of their tweets also had downstream effects on the content of retweets, replies to their tweets, and mentions. However, when we examine the overall Twitter activity of engaged followers of imprisoned leaders, we find that these public cases of political imprisonment generated backlash. Among followers, repression increased criticisms of the Saudi monarchy, its religious authority, its institutions, and its policies. Repression also increased calls for political and social change, including calls to change the regime from an absolute monarchy to a constitutional monarchy or a democracy. Among other online opinion leaders who were not imprisoned but who had also expressed dissent on social media, repression did not have a deterrent effect. Despite observing the arrests of their peers, these actors continued to tweet and publicly voice support for political and social reform.
By showing the varied effects of repression on online dissent, these results tie into the broader literature on the dissent–repression or conflict–repression nexus (Davenport Reference Davenport2005; Lichbach Reference Lichbach1987; Moore Reference Moore1998).Footnote 10 Our findings also reinforce research on the backlash thesis, showing how repression mobilizes dissent,Footnote 11 as well as the literature on how censorship can backfire.Footnote 12
Given that we observe backlash in Saudi Arabia, one of the most repressive countries in the world, we expect these findings may extend to other authoritarian contexts. In particular, we think the patterns we observe may be most likely to occur in countries where social movement organizations are largely absent, where repression is public and overt, where the repression leveled at online opinion leaders does not alter observers’ calculation about their own risk of repression, and where the state lacks fine-grained control over the online sphere.
DATA AND EMPIRICAL STRATEGY
Since the 1950s, three broad and sometimes overlapping social movements have been present in the Saudi Kingdom: (1) the Sahwa or “Awakening” Sunni Islamist movement with historical ties to the Muslim Brotherhood, (2) a Shia-rights movement calling for rights, protections, and at times secession for the Shia minority in the oil rich Eastern province, and (3) networks of human rights, women’s rights, and anti-corruption activists calling for social and political reform.Footnote 13 Many of the imprisoned online opinion leaders that we study—and similar non-imprisoned opinion leaders—are broadly part of the same informal networks, connected by family members, friends, and colleagues.Footnote 14 All three movements have used social media for mobilization, and from 2010 to 2017, leaders of all three movements—Sahwa clerics, Shia clerics and activists, women’s rights activists, anti-corruption activists, judicial reformers, and human rights activists—were imprisoned and sometimes subsequently tortured.
Twitter and Google search data from this period offers detailed digital footprints of the online activity of these arrested individuals, similar non-arrested individuals, the arrested individuals’ followers, and the Saudi public, allowing us to test the effects of repression on these diverse actors. These rich and temporally granular data sources are described in detail below.
Data
We gathered five datasets to assess how repression affects online dissent through direct, indirect, and downstream effects:
Tweets by Imprisoned Opinion Leaders
In order to measure the direct effects of physical repression, we began by identifying Saudi opinion leaders who had been imprisoned and were active on Twitter between January 1, 2010 and January 31, 2017.Footnote 15 We attempted to identify all well-known Saudi individuals who were imprisoned in connection with their online activity and who still had active Twitter accounts at the time of our data collection in January 2017 by conducting automated and manual searches of news and human rights reports in Arabic and English. This yielded a list of 49 individuals whose political arrests were widely reported in the Saudi, other Arabic language, or international press. Thirty-six of them had active Twitter accounts at the time of data collection. Online Appendix A lists all imprisoned opinion leaders, including a brief description of their backgrounds, the official justification for their imprisonment, as well as the unofficial reasons for arrest provided by human rights organizations.Footnote 16 After identifying these 36 opinion leaders, we then collected all of their tweets produced between January 2010 and January 2017 using Twitter’s Historical PowerTrack API. This API provides access to the entire historical archive of public Twitter data—dating back to the first tweet—using a rule-based-filtering system to deliver complete coverage of historical Twitter data. This gave us a dataset of 408,511 tweets.
Tweets Engaging with Imprisoned Opinion Leaders
To measure the downstream effects of imprisonment on the content of tweets—how changes in the behavior of imprisoned opinion leaders are spread through the Saudi Twittersphere—we used the Historical PowerTrack API to download all public tweets engaging with the imprisoned opinion leaders using the @ sign (for example, @LoujainHathloul). We then filtered this dataset to only include tweets by individuals who were either geolocated in Saudi Arabia or contained location metadata in the location or time zone fields of their profiles indicating that they were located in Saudi Arabia, resulting in a dataset of 32,504,397 tweets produced by 8,506,400 unique users.
We use this dataset to measure the downstream effects of arrests on engagement—retweets, mentions, or replies—with imprisoned opinion leaders.Footnote 17 We think of these engaged followers as being similar to supporters in the social movements literature (Davenport, Armstrong, and Zeitzoff Reference Davenport, Armstrong and Zeitzoff2019).Footnote 18 The majority of these users (58.2%) engaged both before and after the arrests of the online opinion leaders. Slightly over 10% (13.3%) only engaged with arrested opinion leaders prior to their arrests, and slightly less than a third (28.4%) only engaged after the arrests. Our primary analyses of tweet volume includes all engaged followers.Footnote 19
Tweets of Engaged Followers
We measure indirect deterrence by selecting a random sample of about 30,000 of the users who retweeted, mentioned, or replied to the imprisoned opinion leaders at least once preceding and once following their arrests,Footnote 20 stratified by imprisoned opinion leader. We then used Twitter’s API to scrape up to 3,200 of each of their most recent tweets for a total of 47,886,355 tweets.Footnote 21
Tweets by Non-Imprisoned Opinion Leaders
Collecting tweets of Saudi opinion leaders who are similar to those imprisoned but were not themselves subjected to repression during our period of study enables us to test the indirect effects of arrest on individuals who might have been most likely to be deterred by seeing their peers imprisoned.
To identify these individuals, we first used the Historical PowerTrack API to download all tweets sent by Twitter users who had over 10,000 followers located in Saudi Arabia, based on their geo-location and location metadata, between 2013 and 2014, which is approximately the middle of the data collection period for the imprisoned opinion leaders. This resulted in 235,215,314 tweets sent by 1,048,568 unique accounts. We then measured the average cosine similarity between tweets produced by these accounts and our imprisoned opinion leader accounts to find matches for each opinion leader.Footnote 22 Our matching method matched Sunni clerics with Sunni clerics, Shia clerics with Shia clerics or Shia-rights activists, women’s right activists with women’s rights activists, etc., giving us confidence in the validity of the approach.Footnote 23 We then used the Historical PowerTrack API to download all of the public tweets of matched non-imprisoned opinion leaders from 2010 to 2017, resulting in a dataset of 365,337 tweets.
Google Search Data
To measure private interest in the imprisoned opinion leaders among the general public, we downloaded daily and weekly Saudi Google Search data for the Arabic namesFootnote 24 of each imprisoned opinion leader in the month and year preceding and following their arrests. This enabled us to see how often Saudi Google users privately searched for these individuals.Footnote 25 This real-time behavioral measure of how much attention everyday Saudis—who the social movements literature refer to as bystanders (Davenport, Armstrong, and Zeitzoff Reference Davenport, Armstrong and Zeitzoff2019)—were privately paying to imprisoned opinion leaders allows us to assess indirect and downstream effects. Because individuals conducting Google searches are generally alone, and there is no obvious record of their activity, they are more likely to express socially and politically taboo thoughts in their searches than they might in more public forums (Conti and Sobiesk Reference Conti and Sobiesk2007; Stephens-Davidowitz Reference Stephens-Davidowitz2014, Reference Stephens-Davidowitz2017). By contrasting this data to public tweets, we can therefore capture preference falsification (Kuran Reference Kuran1997).
Empirical Strategy
Analyses of Tweet and Search Volume
We first calculate the average change for all imprisoned opinion leaders combined in the volume of both tweets and Google searches from the pre-arrest to the post-arrest (or post-release) period. We then conduct placebo tests to generate a null distribution of changes in tweet and search volume by choosing a placebo intervention date at random, and repeating this procedure 10,000 times. The resulting null distribution of change in volume allows us to conduct a non-parametric test of our hypotheses. We determine whether or not the combined change in volume we observe using the actual dates of imprisonment falls outside the mass of the distribution of changes in volume generated by choosing placebo dates at random. Specifically, we compute a one-sided p-value representing the proportion of simulated differences in volume that are at least the size of the actual observed difference in volume. We also use interrupted time series analysis (ITSA) and event count models (negative binomial autoregressive models) to test the robustness of these results (See Online Appendix B.1 and B.2, respectively, for details).
Changes in the volume of tweets give us our first measure of direct, indirect, and downstream effects. If we find evidence of a direct deterrent effect of repression we should see a lower volume of tweets from the imprisoned opinion leaders post-release compared to pre-arrest. If we observe an indirect deterrent effect we should see less engagement with imprisoned opinion leaders from their followers and fewer tweets from similar non-imprisoned opinion leaders post-arrest compared to pre-arrest. If we observe direct or indirect backlash effects, we should see the opposite results.
Examining private behavior, if we see a decrease in Google Search volume, this might be evidence of a downstream effect whereby people lose interest in the imprisoned opinion leaders and their causes following imprisonment. If we see an increase in Google Search volume, this might be evidence of an indirect backlash effect, whereby the arrest draws greater attention to the imprisoned opinion leaders and their causes.
Crowdsourced Evaluation of Tweet Content
Moving beyond changes in the volume of activity, we also evaluate how the content of tweets produced by imprisoned opinion leaders, their engaged followers, and non-imprisoned opinion leaders changed in the aftermath of repression. In particular, we are interested in the effect of imprisonment on four categories of content: (1) criticism or praise of the regime, (2) criticism or praise of government policies, (3) criticism or praise of Saudi society, and (4) discussion of collective action.Footnote 26
With regard to criticisms, the first category focuses on tweets that express dissatisfaction with or criticize the Saudi monarchy including specific royal family members, members of the religious establishment such as state-sanctioned clerics, or religious doctrine associated with the monarchy. It also includes tweets calling for democracy, constitutional monarchy, and other changes to the political regime, including rights for the marginalized Shia minority. This category focuses on content that challenges the legitimacy of the religious monarchy, and as such likely represents the most intolerable form of online expression for the Saudi regime.
The second category includes tweets that express dissatisfaction with or are critical of Saudi bureaucracy including the judiciary, government ministries, or the religious police. It also include tweets criticizing or expressing dissatisfaction with policies and policy outcomes such as the state of the economy, corruption, foreign policy, and infrastructure. This category is perhaps less problematic for the regime as it challenges its policies but not its underlying legitimacy.
The third category identifies tweets criticizing Saudi society for being too liberal or too conservative, as well as tweets criticizing the role of women in society. Because these tweets focus on Saudi society in general, they may be more likely to be tolerated. The final category includes tweets discussing protest or organized crowd formation on the ground. While rare, these tweets represent a particularly threatening form of dissent for the monarchy in the post-Arab Spring period because they facilitate and spread awareness of offline mobilization.
To classify tweets into these categories, we crowdsourced large-scale human coding of tweets via Figure Eight (formerly Crowdflower), a platform similar to Mechanical Turk but with more native Arabic speakers. This content analysis gives us a second measure of direct, indirect, and downstream deterrent or backlash effects. If there is a direct deterrent effect then we should see less critical and more supportive content in the tweets of imprisoned opinion leaders post-release. There might also be a downstream deterrent effect if tweets directly mentioning or retweeting imprisoned opinion leaders become more supportive and less critical as a consequence of the direct deterrent effect of repression on the arrested individuals. If there is an indirect deterrent effect we should see content that is less critical or more supportive of the regime in the tweets produced by engaged followers and tweets produced by similar non-imprisoned opinion leaders post-arrest. Backlash would produce the opposite results.
RESULTS
We first present evidence of direct deterrence of repressed public opinion leaders and its downstream effects, before moving to evidence of indirect backlash effects—increased dissent by engaged online followers of the imprisoned opinion leaders and increased attention from everyday Saudis. We then show a lack of indirect deterrence among non-imprisoned opinion leaders.
Direct Deterrent Effects on Arrested Opinion Leaders
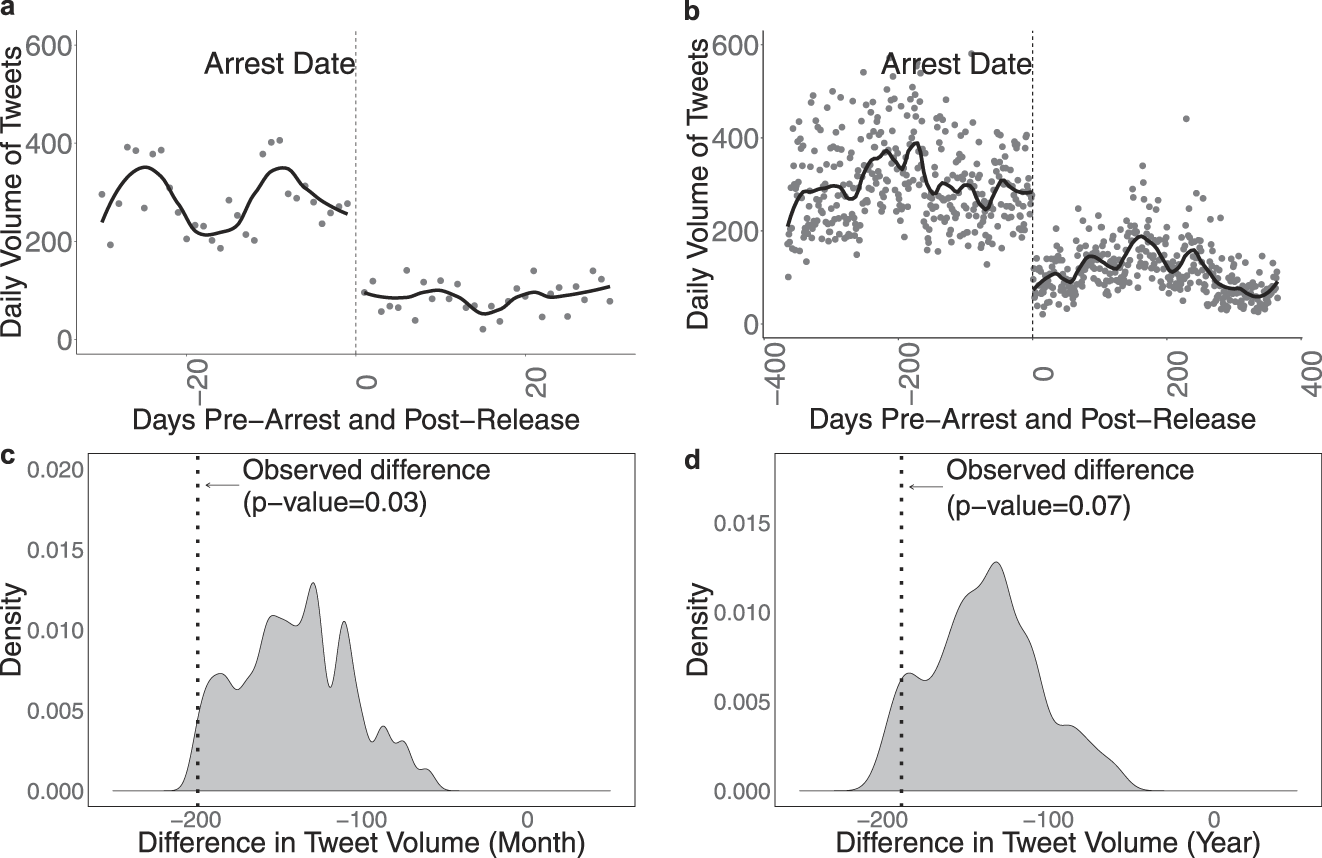
Opinion leaders who were imprisoned were deterred from dissent following their releases. First, their volume of tweets decreased. This can be seen in Figure 1, which presents the pre-arrest and post-release volume of tweets produced by imprisoned opinion leaders with a loess smoothed trend line for the month before arrest and the month after release (panel a), and for the year before arrest and the year after release (panel b).
Volume of Tweets by Imprisoned Opinion Leaders
Note: Daily volume of tweets by imprisoned opinion leaders in month before arrest and after release (panel a), in year before arrest and after release (panel b) with loess smoothed line. Non-parametric placebo tests comparing observed difference in volume pre-arrest to post-release (dotted line) to a null distribution of placebo dates in month (panel c) and year (panel d) periods.

Our placebo tests show that imprisoned opinion leaders collectively tweeted significantly less in the post-release period relative to the pre-arrest period. The lower panels (c and d) of Figure 1 present the results of non-parametric placebo tests, which compare the actual difference in tweet volume associated with the arrest to the difference in volume generated by placebo intervention dates chosen at random at the month (panel c) and year (panel d) time frames. The doted vertical line shows the actual average daily difference in tweet volume between the pre-arrest and post-release month (panel c) and year (panel d). Imprisoned opinion leaders tweeted less when comparing the month before arrest to the month after release. Importantly, they also tweeted less when comparing the year before arrest to the year after release, which suggests that the deterrent effect was not a temporary phenomenon that only lasts for a few days or weeks. These results are consistent with the results of our interrupted time series analysis and event count models reported in Online Appendix B.1 and B.2, which both show statistically significant decreases in tweet volume among imprisoned opinion leaders at the 0.05 level one month and one year after release.
These direct deterrent effects were not simply driven by the change of behavior of a specific subgroup of public opinion leaders. When we disaggregate these effects by the type of opinion leader (Sunni clerics, liberal reformers and activists, and Shia clerics and activists), by the length of the arrests, by whether or not the individual was explicitly arrested for their online dissent,Footnote 27 by the time period in which he or she was arrested, and by his or her number of followers, we see decreased volume of activity across all of these subgroups (See Online Appendix C for details).
The content of what imprisoned public opinion leaders tweeted also changed. For example, prior to his arrest, one liberal activist in our dataset tweeted his support for Islamists (opposed by the Saudi regime) who gained power after the Arab Spring:
They told me: Why support the Arab spring revolutions if the Islamists have benefited from them? I said: the Arab Spring revolutions have restored dignity and trust to the peoples.

By contrast, after he was released, some of his tweets expressed support for the Saudi regime and its leaders:
I followed the al-Arabiya interview with Prince Mohammed bin Salman. The man truly impressed me: fluent in his speech, transparent and practical, knows what he is talking about, his vision is clear, the future is his focus.

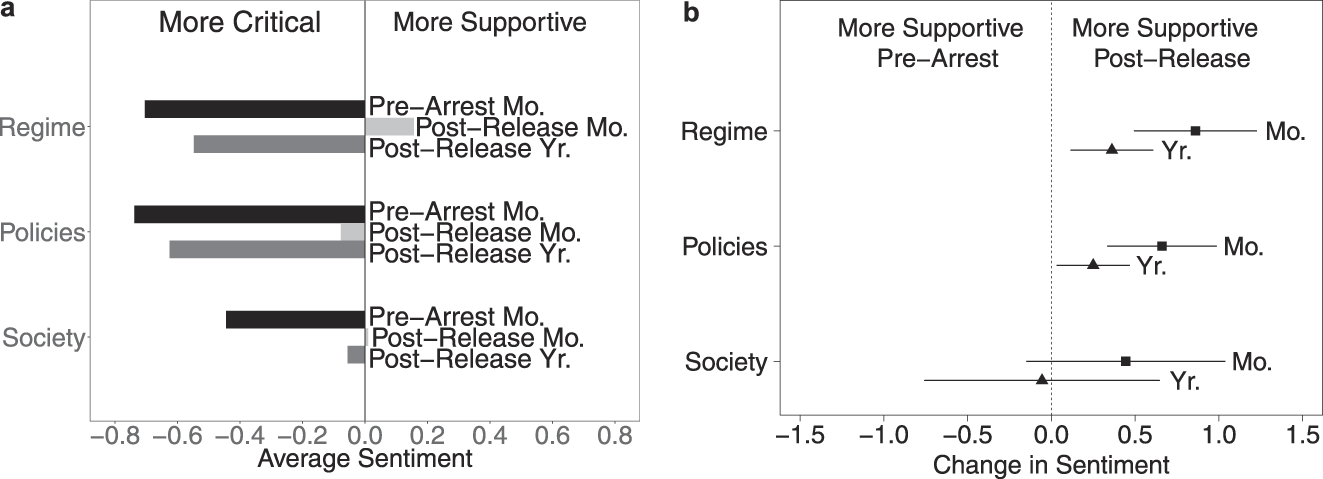
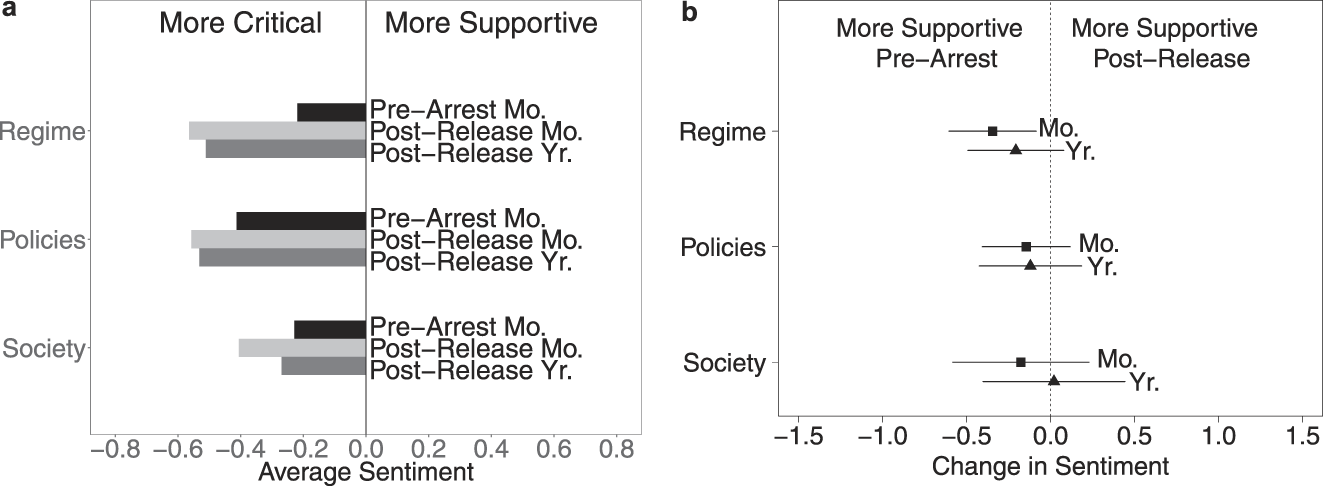
More systematic analysis demonstrates that opinion leaders who were very critical of the regime, its policies, and Saudi society, who called for political and social reforms before their imprisonment, changed their tune after their release. As we described above, Arabic speakers coded the content of tweets as expressing either support (positive sentiment), criticism (negative sentiment), or neutral attitudes toward the Saudi regime, policies, or society.Footnote 28 The bar plots in Figure 2 (panel a) show the average sentiment of these three types of tweets one month pre-arrest (black bar), one month post-release (light gray bar), and one year post-release (dark gray bar).
Sentiment of Tweets by Imprisoned Opinion Leaders
Note: Average sentiment of tweets by imprisoned opinion leaders in each time period (panel a). Change in average tweet sentiment from pre-arrest to post-release with 95% CI (panel b).

In the month before imprisonment, the average sentiment of their tweets about the Saudi regime was quite negative (−0.7 on a scale ranging from −1 to 1). In the month after their release, the average sentiment became positive (+0.15), echoing what we saw in the example tweets. In aggregate, instead of criticizing the regime and calling for change, immediately after their releases from prison, the opinion leaders tweeted more supportive content about the regime.
In the year following their releases, average sentiment again became negative, but less negative than it had been in the pre-arrest period. A similar pattern is evident when examining their tweets about Saudi policies and Saudi society, both of which became less negative after release. These pre-arrest and post-release changes in the content of public opinion leaders’ tweets about the regime and policies are statistically significant, as pictured in the coefficient plot displaying the results of t-tests with 95% confidence intervals in Figure 2 (panel b). Although tweets calling for collective action were very rare in the Saudi Twittersphere in this period (around 1.5% of arrested opinion leader tweets prior to arrest), they disappeared almost entirely post-release (See Online Appendix E for details). Together, these results suggest that arrests had a direct deterrent effect on the online dissent of imprisoned opinion leaders. Imprisoned opinion leaders reined in their criticisms of the regime, its policies, and Saudi society, and their already rare online posts about offline mobilization essentially ceased.
Downstream Deterrent Effects on Engaged Followers
As a consequence of the direct deterrent effect on arrested opinion leaders tweet content, we also see a downstream deterrent effect in which tweets directly mentioning, retweeting, or replying to them become less critical. Less than 2% of tweets produced by engaged followers of imprisoned opinion leaders were mentions, replies, or retweets of the imprisoned opinion leaders. However, largely because these tweets often contain the text of tweets produced by the imprisoned opinion leaders—which are less critical post-release—this 2% of tweets is also less critical of the regime.
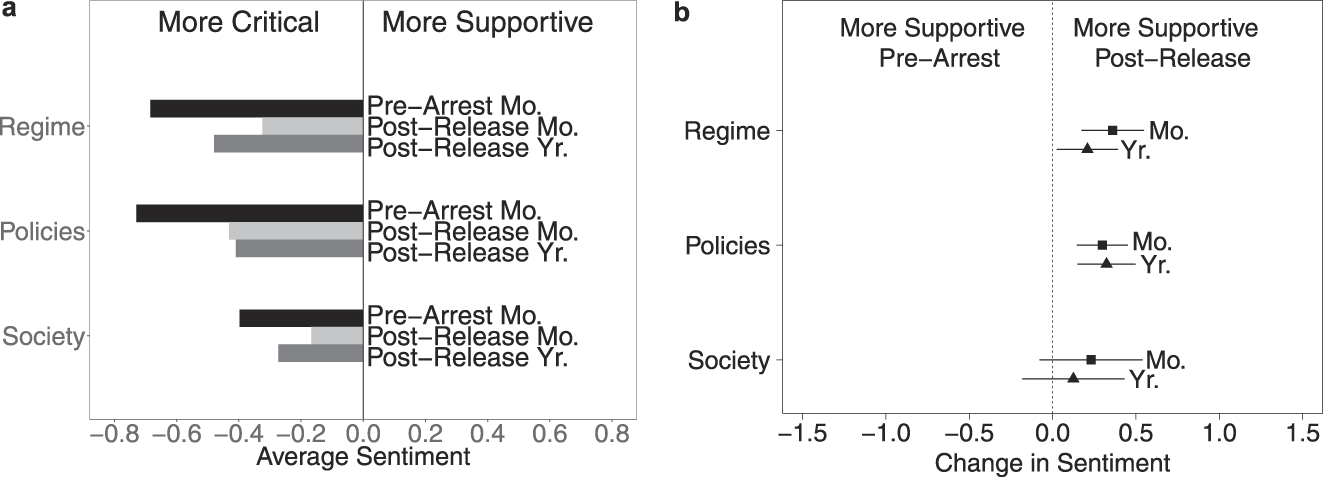
Panel a of Figure 3 shows this—the sentiment of retweets, mentions, and replies are very critical in the month pre-arrest (black bar), and become less critical in the month (light gray bar) as well as year (dark gray bar) post-release. The results of t-tests with 95% confidence intervals displayed in panel b of Figure 3 show that retweets, replies, and mentions became more supportive of the regime, policies, and Saudi society, and the results are statistically significant for tweets about the regime and policies.Footnote 29
Sentiment of Tweets Mentioning, Retweeting, or Replying to Imprisoned Opinion Leaders
Note: Average sentiment of tweets mentioning, retweeting, or replying to imprisoned opinion leaders in each time period (panel a). Change in average tweet sentiment from pre-arrest to post-release with 95% CI (panel b).

Indirect Backlash Effects on Engaged Followers
Despite evidence of downstream deterrent effects of repression in the content of the small subset of tweets directly engaging with the imprisoned opinion leaders, when we look at overall levels of engagement with arrested opinion leaders we see no evidence of deterrence. Moreover, when we examine changes in the content of engaged followers’ tweets overall—rather than just those tweets that retweet, reply, or mention imprisoned opinion leaders—we see evidence of an indirect backlash effect.
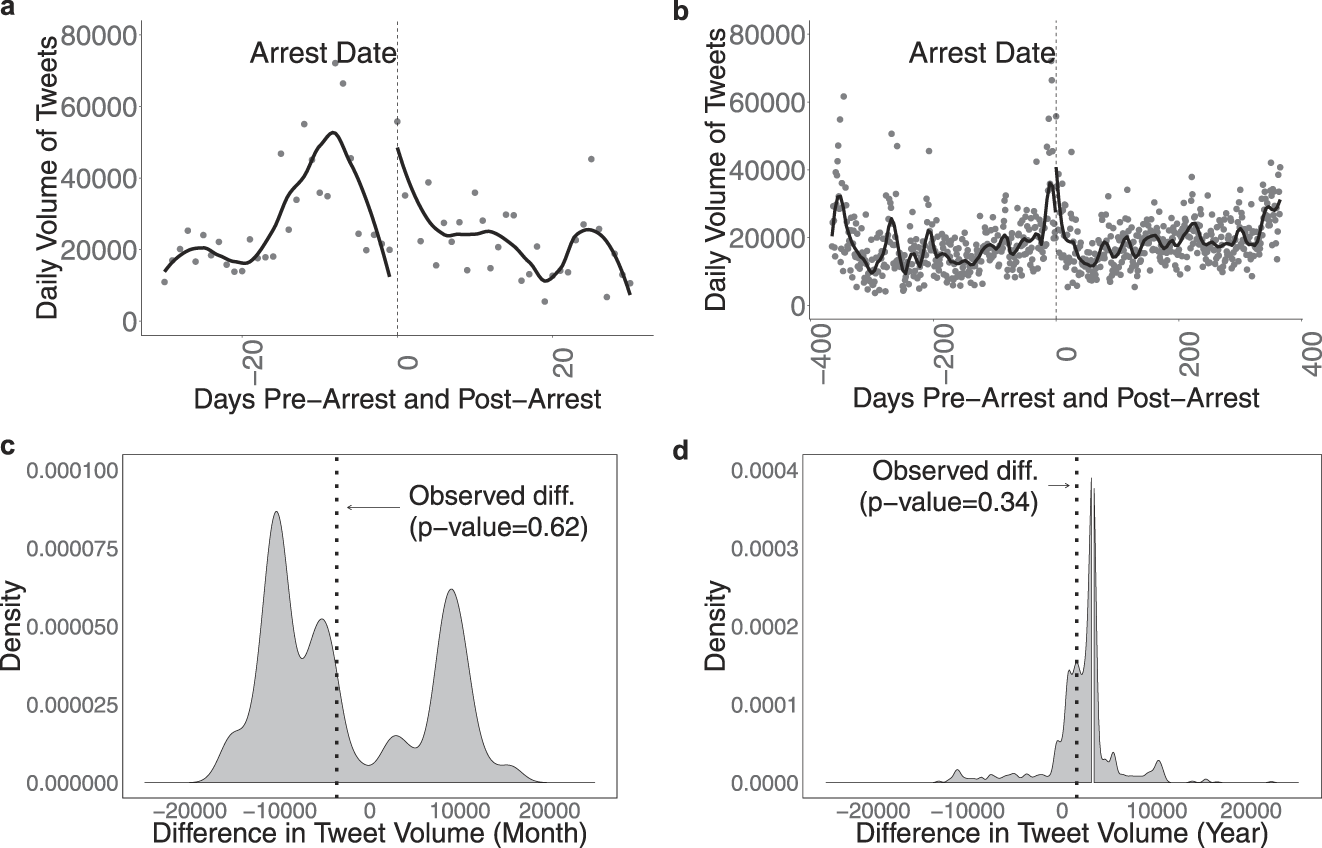
First, examining the volume of retweets, mentions, and replies by engaged followers we find that the arrests did not deter them from interacting with the arrested opinion leaders on Twitter. This can be seen panels a and b of Figure 4, which plots pre- and post-arrest trends in the volume of tweets by engaged followers of imprisoned opinion leaders as local regression lines with loess smoothing for the month before and after arrests (panel a), and for the year before and after arrests (panel b).Footnote 30 Panels c and d of Figure 4 show the results of placebo tests, which demonstrate that our observed difference falls right in the middle of the null distribution of volume differences generated by using placebo intervention dates. This suggests that the arrests did not have a deterrent effects on engagement with imprisoned opinion leaders either a month or a year following the arrest. When we analyze these data in other ways—using interrupted time series regressions and event count models—we also do not find any statistically significant declines in volume (See Online Appendix B.1 and B.2).
Volume of Tweets by Engaged Followers of Imprisoned Opinion Leaders
Note: Daily volume of mentions, retweets, and replies of imprisoned opinion leaders in pre and post-arrest month (panel a) and year (panel b) with a loess smoothed line. Non-parametric placebo tests comparing observed difference in volume pre- and post-arrest (dotted line) to a null distribution of placebo dates in the month (panel c) and year (panel d) periods.

We also disaggregate users by when they began engaging with the imprisoned opinion leaders. The subset of tweets produced by engaged followers who only engaged with the imprisoned opinion leader pre-arrest contains a spike in volume immediately post-arrest. Similarly, the subset of tweets produced by those who engaged both pre- and post-arrest also shows a spike in volume immediately post-arrest. This suggests that individuals who actively followed imprisoned opinion leaders were not deterred by their imprisonment. We also find that the spike in tweets by engaged followers who followed the leader prior to arrest is slightly smaller than what we observe in Figure 4. This indicates that the arrest also led to activity from newly engaged followers who had not engaged previously (See Online Appendix B.3).
When we disaggregate this analysis by different characteristics of imprisoned opinion leaders, we do not see statistically significant differences in volume between any subgroup of followers—engaged followers of different types of opinion leaders, engaged followers of opinion leaders who have more or fewer followers, engaged followers of opinion leader arrested in different time periods or for different lengths of time, or engaged followers of opinion leaders who were explicitly arrested for the content of their tweets (See Online Appendix C for details).
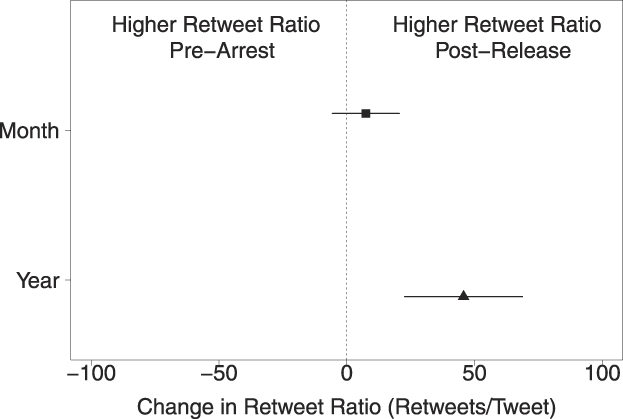
Additionally, engaged followers of the imprisoned online opinion leaders retweeted the tweets of imprisoned leaders at higher rates post-release. As Figure 5 demonstrates, on average, tweets produced by imprisoned opinion leaders garnered more retweets per tweet when comparing the month before the arrests and after the releases, and in the year before the arrests and after the releases, though these results are only statistically significant in the year period (p-value = 0.001). The average number of retweets per tweet in the pre-arrest year was 13 and the average number of retweets per tweet in the year post-release was 60. This suggests that physical repression did not scare away ordinary Twitter users from engaging with imprisoned opinion leaders or their causes.
RTs of Imprisoned Opinion Leaders
Note: Change in the average number of retweets per tweet of tweets by imprisoned opinion leaders from the pre-arrest to post-release periods with 95% CI.

Not only did repression not decrease engagement with imprisoned opinion leaders, we also observe a backlash in the content of tweets produced by engaged followers of the imprisoned opinion leaders. Engaged followers stepped up their dissent by criticizing the regime and calling for reform. Although the liberal activist quoted above tweeted in support of Saudi leaders following his release from prison, his online followers continued to criticize the regime. For example, one follower tweeted in the post-arrest period:
A society that denies and condemns and calls for the killing of all who do not agree with its ideology, religion and beliefs, is a society that is intellectually sick and the people suffer.

When we systematically examine tweets by engaged followers of imprisoned opinion leaders, we observe the same pattern of increased criticism and dissent. Panel a of Figure 6 displays a bar plot of the average sentiment of political tweets produced by Saudi Twitter users who engaged with imprisoned opinion leaders. The average sentiment is always negative, but in the month (light gray bar) and year (dark gray bar) after the releases, online sentiment was more critical toward the regime, policies, and society than before the arrests. Panel b of Figure 6 presents results of t-tests of differences in online sentiment before the arrests and after the releases and shows that online followers were more critical of the regime, its policies, and Saudi society, though these results are not consistently statistically significant.
Sentiment of Tweets by Engaged Followers of Imprisoned Opinion Leaders
Note: Average sentiment of tweets by engaged followers of imprisoned opinion leaders in each time period (panel a). Change in average tweet sentiment from pre-arrest to post-release with 95% CI (panel b).

Indirect Backlash Effects on the Saudi Public
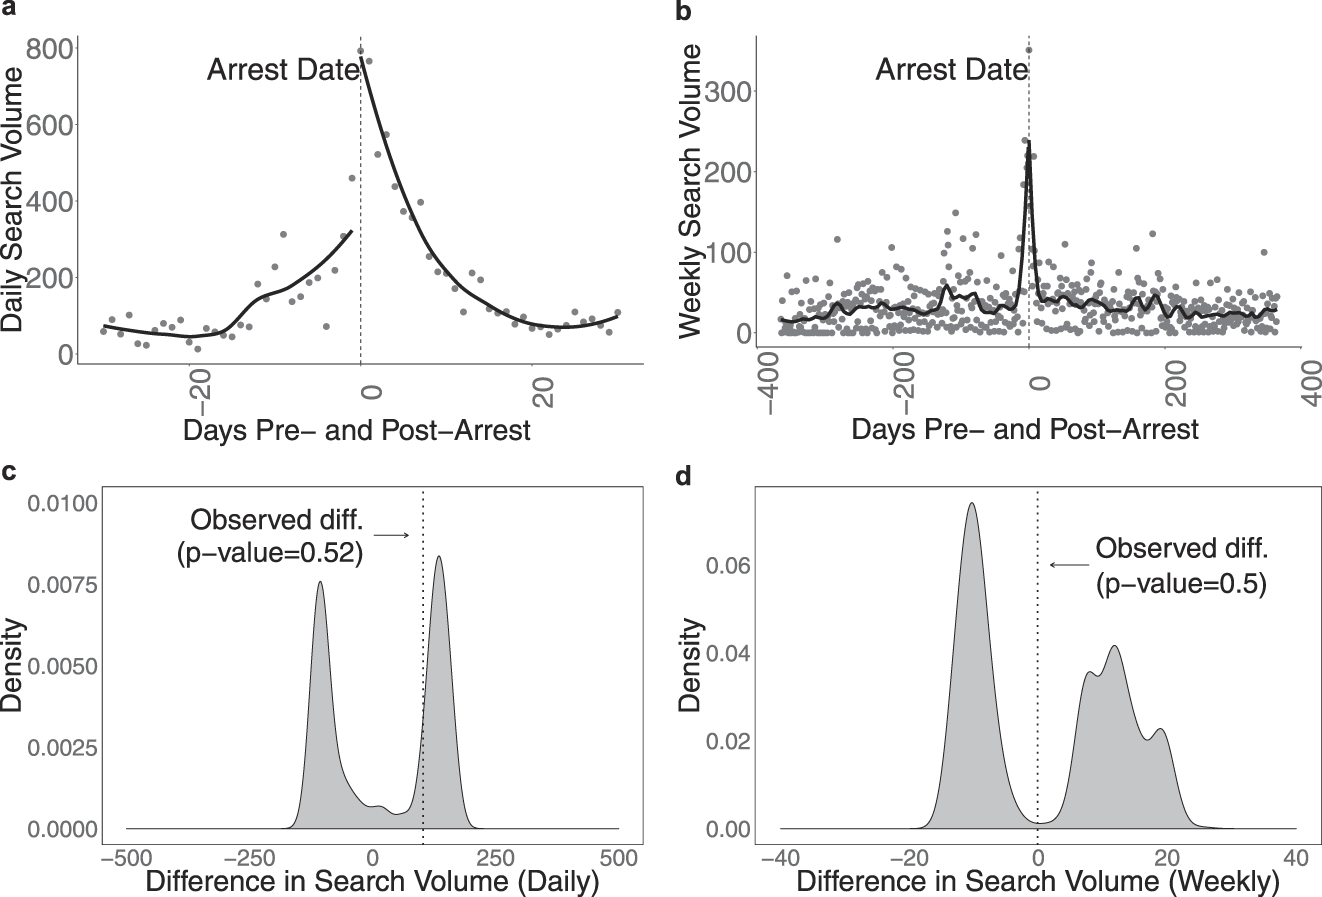
Private interest in the imprisoned opinion leaders by the Saudi public also spiked. Panels a and b of Figure 7 show a very large increase in the popularity of Saudi Google searches for imprisoned opinion leaders in the immediate aftermath of the arrests. The top of Figure 7 plots the pre-arrest and post-arrest trends in our data with loess smoothed trend lines, based on daily search volume for the month prior to and post-arrest (panel a) and based on weekly search volume for the year prior to and post-arrest (panel b).Footnote 31 Searches increased significantly in the immediate aftermath of arrest and returned to pre-arrest levels soon after. Furthermore, the similar results we observe across the tweets engaging with imprisoned opinion leaders and the Google search data suggest that there is no evidence of preference falsification (Kuran Reference Kuran1997) or self-censorship that we might have observed if individuals had been afraid to publicly engage on Twitter but nonetheless continued to search on Google in private. While the uptick in Google searches quickly returns to normal and therefore is not captured by our placebo analysis, our interrupted time series analysis shows a statistically significant level change in the immediate aftermath of the arrest.Footnote 32
Relative Volume of Saudi Google Searches for Imprisoned Opinion Leaders
Note: Daily relative volume of Google searches for the Arabic names of imprisoned opinion leaders in the month before and after arrest (panel a) and weekly relative volume in the year before and after arrest (panel b) with loess smoothed lines. Non-parametric placebo tests comparing the observed change in relative volume pre-arrest to post-arrest (dotted line) to a null distribution of changes generated by choosing placebo dates at random the in month (panel c) and year (panel d) time periods.

No Indirect Deterrent Effect on Similar Opinion Leaders
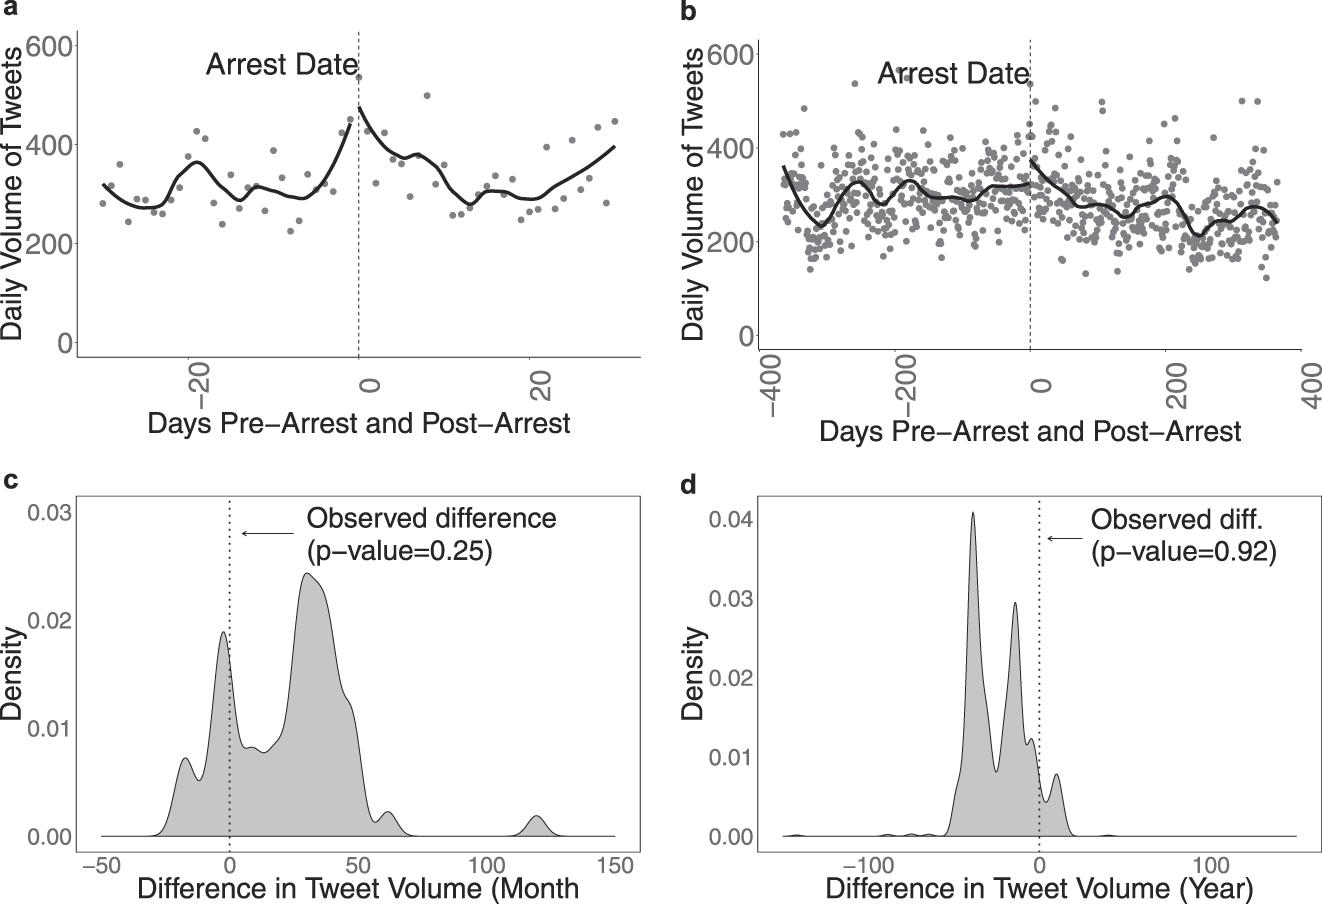
Turning to individuals who were perhaps most at risk of repression—those who had engaged in similar dissent and also had large online followings—we find no evidence that they were deterred. Figure 8 shows that unlike the imprisoned opinion leaders, similar opinion leaders did not decrease their volume of tweets after the arrests of their peers. There was little change in the daily volume of tweets produced by the non-imprisoned opinion leaders in the month before and month after the arrests, or in the year before and year after arrests. When we disaggregate this analysis by different characteristics of imprisoned opinion leaders, we do not see statistically significant declines in volume among any subgroup of matched individuals. If anything, in some subgroups (non-imprisoned opinion leaders matched to imprisoned leaders with long arrest periods and imprisoned leaders with fewer followers), we see an increase in the volume of non-imprisoned opinion leader tweets. The results of interrupted time series analysis and event count models are similar and are displayed in Online Appendix B along with the subgroup analysis reported in Online Appendix C.
Volume of Tweets by Non-Imprisoned Opinion Leaders
Note: Daily volume of tweets by non-imprisoned opinion leaders in the month before and after arrest (panel a) and in the year before and after arrest (panel b) with loess smoothed lines. Non-parametric placebo tests comparing the observed change in volume pre-arrest to post-arrest (dotted line) to a null distribution of changes generated by choosing placebo dates at random the in month (panel c) and year (panel d) time periods.

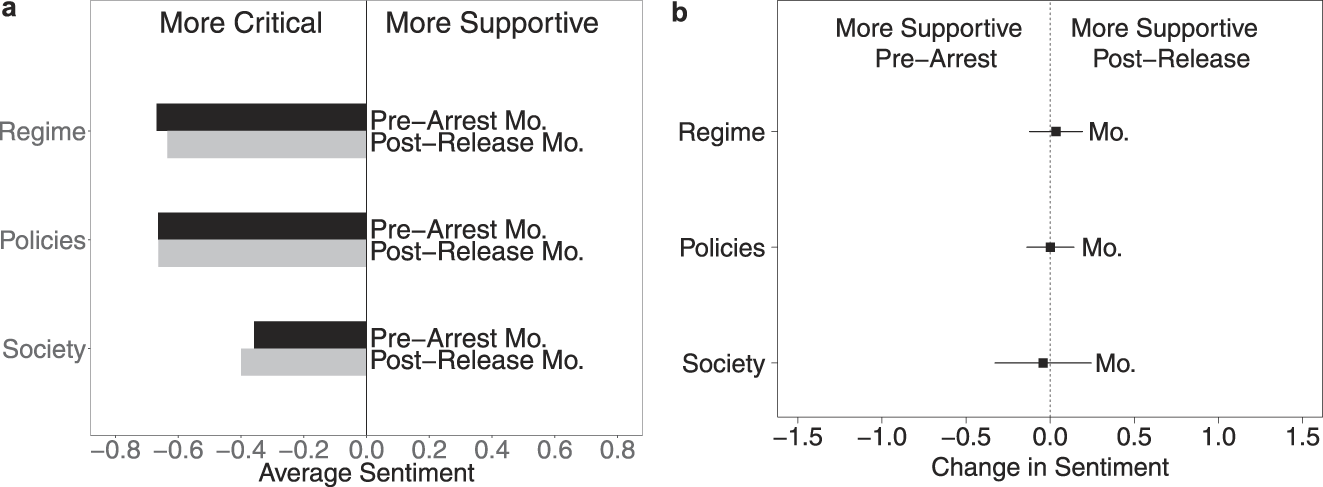
Similarly, non-imprisoned opinion leaders did not change the content of their tweets. For example, the non-arrested liberal activist matched to the activist quoted above tweeted equally negative content in the pre-arrest period, and did not reign in his dissent after the first activist’s arrest. Following the arrest, the non-imprisoned activist called for freedom, referencing that Arabs have fought for freedom since pre-Islamic times:
Freedom is an innate state inherent in the primitive existence of man. And therefore Arabs believe in it and have fought for it since the Sa’lek (pre-Islamic) rebellion of the Arabs.

Our systematic content analysis reveals the same lack of deterrence. Figure 9 shows that non-imprisoned opinion leaders continued to express negative sentiment toward the regime, and there were no statistically significant changes in the content of their tweets about the Saudi regime, policies, or society. Discussion of offline collective action by these other opinion leaders also remained unchanged.Footnote 33
Sentiment of Tweets by Non-Imprisoned Opinion Leaders
Note: Average sentiment of tweets by non-imprisoned opinion leaders in each time period (panel a). Change in average tweet sentiment from pre-arrest to post-release with 95% CI (panel b).

Our results also align with what we know anecdotally from this period—that activists and clerics frequently denounced the arrests of their friends and colleagues and did not appear deterred. For example, non-imprisoned women’s rights activist Hala al-Dosari spoke out against the arrests of Loujain al-Hathloul and Mayasa al-Amoudi in 2014 (BBC News 2014). Non-imprisoned clerics denounced the arrests of Mohamad al-Arefe and Mohsen al-Awaji in 2013 and non-imprisoned human rights activists protested the arrests of members of the Saudi Civil and Political Rights Association in 2011 (The Daily Star 2011).
Discussion
Why did repression deter imprisoned opinion leaders but create backlash among their followers? And why did it fail to deter similar non-arrested individuals from dissent? Interpreting our results through the lens of the repression, online mobilization, and censorship literatures provides key insights into their generalizability as well as important scope conditions of our study.
Our finding of a direct deterrent effect contrasts with research in democratic contexts showing that repression can generate backlash among its targets, especially leaders of social movement organizations (Davenport Reference Davenport2015; Sullivan and Davenport Reference Sullivan and Davenport2017). This may be a consequence of the high level of repression in Saudi Arabia, which is virtually unconstrained by social norms, cultural practices, or law, as well as the absence of formal social mobilization organizations to offer a modicum of protection for dissenters. The future risk of repression is high (likely much higher than in any democratic context), not only for individuals who have been repressed but also for their family members and associates. This direct deterrence may be more likely to occur in contexts like Saudi Arabia where social movement organizations are largely absent. In regimes where social movement organizations exist and where offline mobilization is more prevalent, we may see backlash instead of deterrence among repressed individuals in line with Sullivan and Davenport (Reference Sullivan and Davenport2017).
The lack of indirect deterrence and the backlash we observe among followers of arrested opinion leaders aligns with the large repression literature on backlashFootnote 34 and echoes research on how censorship can backfire. There are two components to the backlash we observe. One is increased engagement and higher levels of criticism by individuals who had already been actively engaging with imprisoned opinion leaders online prior to their arrests. The second is new engaged followers who began interacting with the imprisoned opinion leaders or privately searching for them after their arrests. Backlash in both instances was likely related to the fact that online dissent and mobilization are extremely low cost, allowing large numbers of people to participate. As a result, the risk of repression for any one supporter is very low. This means that publicly visible repression may generate interest without incentivizing individuals to self-censor or to stop supporting a movement online (Earl and Kimport Reference Earl and Kimport2011).
Given that we observe backlash among engaged followers in this extremely repressive context—and that we find no evidence of preference falsification—we expect these results to generalize to other contexts where social media is used to sustain social movements online. We also expect these backlash results to extend to regimes that are less repressive and those that have freer media. We have no reason to believe these results are unique to absolute monarchies, theocracies, or resource-rich dictatorships.
There are, however, important scope conditions with regard to these indirect backlash effects. First, the repression we analyze in the Saudi context is publicly visible. Just as censorship is more likely to generate backlash when it is obvious than when it is hidden, when repression of online dissent is more covert, we might not observe backlash. We should therefore expect to see indirect backlash when those targeted by repression are prominent figures. In other contexts, where there have been high-profile cases of repression targeting ordinary social media users,Footnote 35 backlash might be less likely if online supporters learn new information about their own level of risk by observing the arrest. More generally, we would expect to see similar results in contexts where repression does not alter observers’ calculation about their own risk of repression. In regimes where repression of online activity is rarer, or makes an example of ordinary citizens, repression might be more likely to change peoples’ perceived level of risk and constrain their behavior.
Indirect backlash effects of repression may also be limited to regimes that lack fine-grained control over the online sphere. The backlash we observe is likely accelerated by the fact that the Saudi regime cannot quickly, reliably, and selectively censor tweets. Unlike in China, for example, where Chinese social media platforms carry out the censorship requests of the Chinese government to prevent certain online movements from going viral (King, Pan, and Roberts Reference King, Pan and Roberts2014), Twitter does not necessarily comply with Saudi government censorship requests. Indeed, the Minister of Information admitted in February 2013 that monitoring Twitter was difficult due to the large volume of users (Al-Rasheed Reference Al-Rasheed2013). The increased criticisms and calls for reform we observe suggest that in the time period of our study, online disinformation campaigns by the Saudi government (including large-scale fabrication of pro-government content) also did not stifle critical voices.Footnote 36 If a regime exercised a high degree of control over social media, it could censor dissent after the arrests. However most authoritarian regimes lack high degrees of control, with the exception of China and perhaps Russia.
The lack of indirect deterrence we observe among online opinion leaders who were not imprisoned is perhaps our most surprising result. First, it differs from the results of Sullivan and Davenport (Reference Sullivan and Davenport2017), which show that repression demobilized movement members who did not experience repression. We believe this difference is due to the fact that the dissent we describe in this paper is taking place online instead of offline, and occurring within social movements but not in social movement organizations. In Sullivan and Davenport (Reference Sullivan and Davenport2017), repression was applied to individuals who participated in an offline protest. Members of this organization who were not present at the protest were not repressed and later withdrew from the organization perhaps because they were perceived by protest participants as lacking commitment and socially stigmatized. Our context differs dramatically. Because of the large and diffuse nature of online mobilization, the Saudi regime could not and did not arrest everyone who participated in online dissent. In contrast to Sullivan and Davenport (Reference Sullivan and Davenport2017), other leaders who were not repressed did not lack commitment—they also took risks and spoke out.
What else might explain why these non-arrested opinion leaders were not deterred by observing repression despite the seemingly high levels of risk they faced relative to ordinary Saudi social media users? Perhaps these non-imprisoned opinion leaders differed in some way from those who were imprisoned, and did not actually face as high a level of risk. However, our results suggest that non-imprisoned opinion leaders tweeted at a similar rate in general and produced a similar proportion of tweets expressing negative sentiment toward the regime, policies, and society in the pre-arrest period. It therefore seems unlikely that non-imprisoned opinion leaders believed they were immune from state repression because their online activity differed from that of their arrested peers. But there may be other characteristics of non-imprisoned opinion leaders we do not observe—such as the nature of their offline dissent, political connections, or their ability to leave Saudi Arabia—that alter their perceived level of risk and enable them to continue dissenting.Footnote 37
A final reason we do not observe an indirect deterrent effect on non-imprisoned opinion leaders may be that—like ordinary social media users—observing arrests did not alter their calculus about the risk they faced. Because well-known opinion leaders in Saudi Arabia are at risk of arbitrary imprisonment at all times, the political imprisonment of other opinion leaders may not provide any new information to constrain their behavior any more than the daily reality of living under such repressive conditions. This may stand in contrast to other contexts where the repression of a small number of actors might be sufficient to alert others to acceptable norms and deter dissent (Link Reference Link2002; Stern and Hassid Reference Stern and Hassid2012).
CONCLUSION
Analyzing over 300 million tweets and Google search data between 2010 and 2017, this paper offers new temporally granular measures of the direct, indirect, and downstream effects of repression on online dissent. Furthermore, by allowing us to capture both the volume and content of mass and opinion leader messages on the same platform, Twitter data provides novel perspectives on how diverse actors behave in the aftermath of physical repression. Together, our results suggest that while physical repression had a direct deterrent effect on the individuals who were imprisoned, it had an indirect backlash effect on their engaged followers and the public, and did not deter similar opinion leaders who were not imprisoned.
Given these results, why would the Saudi regime—or other regimes around the world—use physical repression in response to online dissent? Governments may go through a learning process in how to suppress online mobilization, and perhaps these targeted arrests were one phase in that process. Governments may also default to a particular style of repression depending on their institutional history or who is in power. Indeed Saudi Arabia’s use of physical repression has shifted since our period of analysis. Since 2017, the Saudi Kingdom has moved away from targeted arrests to more indiscriminate forms of physical repression. Examples include larger-scale political imprisonment, such as the late 2017 purge of about 500 business people, princes, government ministers, and activists; an increase in death sentences such as that of popular cleric Salman al-Oudah; and even the targeting of opponents living abroad such as the recent murder of influential journalist Jamal Kashoggi (Rauhala Reference Rauhala2018; Freedom House 2018; Human Rights Watch 2018b). Our work suggests that—as of 2017—despite the threat of repression, many opinion leaders and everyday Saudis continued to take advantage of Twitter as one of the few avenues of political expression available in the Saudi Kingdom. Future research should examine the extent to which this pattern persists under more recent conditions of intensified repression in Saudi Arabia.
In general, more research is needed to capture how physical repression is being used by authoritarian and democratic regimes in response to online opposition worldwide. We hope the analytical leverage gained by disaggregating the effect of repression on online dissent by type, actor, behavior, and time will be used in future studies examining other regions, regime types, forms of physical repression, and forms of online dissent.
SUPPLEMENTARY MATERIAL
To view supplementary material for this article, please visit https://doi.org/10.1017/S0003055419000650.
Replication materials can be found on Dataverse at: https://doi.org/10.7910/DVN/9AMKHL.




Comments
No Comments have been published for this article.