I. INTRODUCTION
Since the recognition of semiconductor behavior of low molecular weight anthracene in 1963 by Pope, Reference Pope and Kallman1 numerous researchers have been engaged in probing the potential organic semiconductor (OSCs) materials intended for the progress of next generation ultrathin organic field-effect transistors (OFETs). Reference Wurthner2 Charge carrier mobility (μ) is an important factor which governs the performance of the OFETs. Normally, higher mobilities offer more potential for faster switching of OFETs. As a whole, the charge carrier mobility in OSCs critically depends on the molecular packing, disorder, size/molecular weight, charge density, electric field, temperature and pressure. Reference Coropceanu, Cornil, da Silva Filho, Olivier, Silbey and Bredas3
Previous studies reported that the intermolecular separation between adjacent molecules in organic crystals is affected by both the electric field and hydrostatic pressure. Reference Coropceanu, Cornil, da Silva Filho, Olivier, Silbey and Bredas3 On the other hand, within an organic crystal, the amount of orbital overlap and rate of charge transfer between adjacent molecules is governed by the intermolecular separation. In ultrapure single crystals, charge mobility is mostly independent of electric field at room temperature, whereas at low temperature, the mobility is seen to decrease with an increase in the electric field. Reference Coropceanu, Cornil, da Silva Filho, Olivier, Silbey and Bredas3–Reference Takeya, Kato, Hara, Yamagishi, Hirahara, Yamada, Nakazawa, Ikehata, Tsukagoshi, Aoyagi, Takenobu and Iwasa10 Apart from experimental studies, a theoretical approach has recently been developed, which is useful to distinguish the influence of the external electric field on the charge transport parameters, such as, the transfer integrals (t) and the reorganization energy (λ). Reference Sancho-Garcia, Horowitz, Brédas and Cornil11,Reference Olivier, Lemaur, Brédas and Cornil12 Sancho-Garcia et al. have stated that the application of an external electric field in the range 106–108 V/cm along the long molecular axis of a pentacene molecule almost unaffected the inner λ. Reference Sancho-Garcia, Horowitz, Brédas and Cornil11 Olivier et al. performed the Monte Carlo simulations and observed that the value of t remained unchanged when the magnitude of the electric field was changed. Reference Olivier, Lemaur, Brédas and Cornil12 In 2006, Hultell and Stafström stated that in the presence of an external electric field the electron–phonon (e–p) interaction in highly ordered pentacene single crystal is no longer stable and transport become band like when the charge transfer integrals exceeding ∼120 meV. Reference Hultell and Stafström13
On the other hand, the application of hydrostatic pressure, which makes the packing of SC-OSCs to become tighter and the orbital overlap between the nearby molecules to increase, modifies the band structure of the material and increases the mobility. For instance, in 1967 Kajiwara et al. investigated the charge transport properties of an anthracene crystal under high pressure and found that electron mobilities along the a and b crystallographic directions increased as the applied pressure increased up to 7.4 kbar, whereas the electron mobilities were nearly constant along the c* direction. Reference Kajiwara, Inokuchi and Minomura14 Under hydrostatic compression, the electrical conductivity of aromatic compounds was reported by Harada et al. Reference Harada, Maruyama, Shirotani and Inokuchi15 and Shirotani et al. Reference Shirotani, Inokuchi and Minomura16 Their studies indicated that the band gaps of the aromatic compounds decreased only one fifth of their ordinary values, consequently, the conductivity increases to 105–107 times more than the value at ambient pressure. Similarly, the changes in electrical conductivity of organic single crystals up to approximately 0.6 GPa was reported by Rang et al. Reference Rang, Haraldsson, Kim, Ruden, Nathan, Chesterfield and Frisbie17–Reference Rang, Nathan, Ruden, Chesterfield and Frisbie19 They concluded that an increase in photoconductivity of pentacene, tetracene and rubrene single crystals is due to an increase in molecular overlap between adjacent molecules under compression.
Using density-functional theory together with the Holstein–Peierls model, Wang et al. investigated the effect of temperature (5–296 K) and pressure (0–2.1 GPa) on the charge carrier mobilities in a naphthalene single crystal. Reference Wang, Li and Shuai20 They observed that the pressure decreases the electron–phonon interactions and increases the mobility. In 2011 and 2013, Takeya and co-workers have further studied the deformation of OSCs under hydrostatic pressure and the effects on the electronic properties of crystals. Reference Sakai, Okada, Kitaoka, Tsurumi, Ohishi, Fujiwara, Takimiya and Takeya21,Reference Okada, Sakai, Uemura, Nakazawa and Takeya22 Lately, Bauman et al. investigated the electron and hole mobilities of (2-fluoro-3-pyridyl)(4-iodophenyl)borinic 8-oxyquinolinate single crystal at room temperature in the pressure range (0–4.9 GPa). By employing Marcus theory, they found that an increase in pressure increases the electron and hole transport properties. Reference Bauman, Parsons, Serwatowski and Woźniak23
In the past decades, various π-conjugated materials, such as oligoacenes, oligothiophenes, triphenylamines, perylenes, tetrathiafulvalenes, and fullerenes have been investigated as organic semiconductors attaining charge mobilities between 0.1 and 20 cm2/V∙s at room temperature for crystalline organic semiconductors, Reference Warta and Karl5,Reference Karl24,Reference Podzorov, Pudalov and Gershenson25 but the mobility had fallen below 0.1 cm2/V∙s in amorphous materials. Reference Shirota26,Reference Kreouzis, Poplavskyy, Tuladhar, Campoy-Quiles, Nelson, Campbell and Bradley27 Several review articles have summarized the properties of these new OSCs. Reference Coropceanu, Cornil, da Silva Filho, Olivier, Silbey and Bredas3,Reference Guo, Facchetti and Marks28,Reference Cinar and Ozturk29 Amongst all these materials, oligoacenes are considered as efficient active semiconducting layer for OFETs applications, because they are well known to form highly ordered molecular crystals. In recent years, the anthracene moiety has attracted many researchers due to its superior crystallinity and oxidative stability than higher oligoacenes. A literature survey shows that an enormous number of experimental Reference Meng, Sun, Goldfinger, Jaycox, Li, Marshall and Blackman30 and theoretical studies Reference Kukhta, Kukhta, Kukhta, Neyra and Meza31–Reference Jiang, Hu and Wei35 have been dedicated to design new anthracene derivatives with respect to charge mobility and to understand their structure–property relationships. In addition, it was also found that the anthracene moiety can be easily modified by substituting small aromatic units at the 2,6-positions. The small aromatic substituents at the 2,6-positions lead to a rigid configuration of the anthracene moiety. This enables extended intramolecular π-conjugation as well as intermolecular π-overlap, resulting in higher charge mobility. In 2015, Liu et al. found that 2,6-diphenylanthracene (2,6-DPA) is a strong high performing semiconductor with thin film device mobility over 10 cm2/V s. Reference Liu, Dong, Wang, Ji, Cheng, Geng, Zhang, Zhen, Jiang, Fu, Bo, Chen, Shuai and Hu36 Liu et al. finally concluded that the enhanced charge mobility of the 2,6-DPA is due to its closely packed crystal structure. A literature survey clearly demonstrated that there are no studies pertaining to influence of external parameters, such as hydrostatic pressure and electric field, on the charge transport properties of 2,6-DPA. Most recently, Liu et al. demonstrated that the 2,6-DPA single crystal exhibits a strong emissive characteristic with mobility as high as 34 cm2/V s. Reference Liu, Zhang, Dong, Meng, Jiang, Jiang, Wang, Yu, Sun, Hu and Heeger37
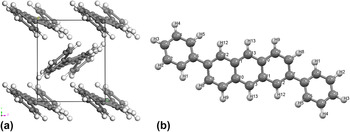
Our preliminary results indicated that the crystal structural of 2,6-DPA was unchanged by the application of external electric field (0–8.017 V/nm) and is anisotropic owing to the different crystal packing along three crystallographic directions under hydrostatic pressure (0–10 GPa) (see Table S1). Therefore, in this paper we have highlighted results pertaining to the influence of hydrostatic pressure on charge transport properties of the 2,6-DPA single crystal at room temperature. The molecular and crystal structure of 2,6-DPA is presented in Fig. 1. The calculated results at ambient pressure shown that the reorganization energy (∼0.2 eV) and transfer integrals (0.2–0.3 eV) are close in magnitude. This suggests that the charge transport of this material behaviors somewhat intermediately as simple hopping and band transport. The charge mobility calculated at the ambient pressure using hopping model predicted two orders lower than the experimental value, whereas, band model computed charge mobility slightly higher than the experimental value. Therefore, we have adopted tight binding model to compute the charge mobility at different pressures. The results obtained in this study will be a useful reference to understanding the roles of hydrostatic pressure on charge transports as well as to the further optimisation of 2,6-DPA for OSCs applications.
(a) The experimental crystalline structure and (b) molecular structure along with atomic labeling of 2,6-DPA.

II. THEORY AND COMPUTATIONAL DETAILS
According to the Drude model based on band theory, the drift mobility is given by Reference Coropceanu, Cornil, da Silva Filho, Olivier, Silbey and Bredas3
 $$\mu = {{e\tau } \over {{m^*}(k)}}\quad ,$$
where
 ${m^ * }\left( k \right)$
is the effective mass of the charge carriers, τ is the mean relaxation time of the band states, and k is the wave vector.
The effective mass is calculated according to
 $$\left[ {{1 \over {{m^*}(k)}}} \right] = \pm {1 \over {{\hbar ^2}}}\left[ {{{{\partial ^2}{E_0}(k)} \over {\partial {k^2}}}} \right]\quad .$$
In the 1D-tight binding model, Reference Ueno, Brütting and Adachi38 when electron correlations (coulomb repulsion integrals) are absent, the energy of the band electron depends on the transfer integrals (t) [which also are known as electron coupling or hopping integrals] of the electrons and is written as
 $${E_0}(k) = - 2|{t_{ij}}|\cos \,ka\quad ,$$
where a is the lattice parameter.
It follows then from Eq. (3) that
 $${{{\partial ^2}{E_0}(k)} \over {\partial {k^2}}} = 2{a^2}|{t_{ij}}|\cos \,ka\quad .$$
In semiconductors the conduction band minimum and valence band maximum occur at k = 0. Hence
 $${{{\partial ^2}{E_0}(k)} \over {\partial {k^2}}} = 2{a^2}|{t_{ij}}|\quad .$$
Comparing Eqs. (2) and (5), we get
 $$\left[ {{1 \over {{m^*}(k)}}} \right] = \pm {1 \over {{\hbar ^2}}}\left[ {2{a^2}|{t_{ij}}|} \right]\quad .$$
Therefore, the charge carrier mobility is
 $$\mu = {{2e{a^2}|{t_{ij}}|} \over {{\hbar ^2}}}\tau \quad ,$$
where the mean relaxation time τ for anthracene Reference Elnahwy, El Hamamsy and Damask39 and other oligoacenes Reference Marciniak, Despré, Barillot, Rouzée, Galbraith, Klei, Yang, Smeenk, Loriot, Nagaprasad Reddy, Tielens, Mahapatra, Kuleff, Vrakking and Lépine40 is reported to be of the order ∼3.0 × 10⁻¹⁴ s. In the direct coupling approach, the transfer integral or electron coupling has the form Reference Coropceanu, Cornil, da Silva Filho, Olivier, Silbey and Bredas3
 $${t_{ij}} = {{{J_{ij}} - {1 \over 2}\left( {{e_i} + {e_j}} \right){S_{ij}}} \over {1 - {S_{ij}}^2}}\quad ,$$
where the site energies (e i , e j ), the spatial overlap (S ij ), and the charge-transfer integrals (J ij ) are calculated according to Eqs. (9)–(11)
 $${e_{i\left( j \right)}} = \left\langle {{\phi _{i\left( j \right)}}|{h_{{\rm{KS}}}}|{\phi _{j\left( i \right)}}} \right\rangle$$
 $${S_{ij}} = \left\langle {{\phi _i}|{\phi _j}} \right\rangle {\rm{\ }}$$
 $${J_{ij}} = \left\langle {{\phi _i}|{h_{{\rm{KS}}}}|{\phi _j}} \right\rangle$$
in which h
KS is the Kohn–Sham Hamiltonian of the dimer system and
 ${\phi _{i\left( j \right)}}$
is the HOMO (for hole transport) of the monomer with Löwdin's symmetric transformation,
Reference Coropceanu, Cornil, da Silva Filho, Olivier, Silbey and Bredas3
which can be used as the orthogonal basis set in the calculations.
The optimization of the crystal structure of 2,6-DPA w.r.t. increasing pressure with a 1 GPa step in the pressure range 0–10 GPa was done with the DFT method using a plane-wave expansion of the wave functions and Vanderbilt-type ultrasoft pseudopotentials Reference Vanderbilt41 as incorporated in the CASTEP Reference Clark, Segall, Pickard, Hasnip, Probert, Refson and Payne42 module of Materials Studio package. 43 In the self-consistent field (SCF) calculations, the Pulay density-mixing scheme Reference Kresse and Furthmuller44 was utilized and the structures were fully relaxed by the Broyden–Fletcher–Goldfarb–Shanno (BFGS) method. Reference Fischer and Almlof45 Dispersion-corrected density functional theory (DFT-D) using the generalized gradient approximation (GGA) with the Perdew–Burke–Ernzerhof (PBE) exchange-correlation potential was used. Reference Perdew, Burke and Ernzerhof46 Generally, the dispersion energy (-D) is commonly used to define the solid-state packing of organic molecules. Reference Sancho-Garcia, Perez-Jimenez, Olivier and Cornil47 The plane wave cut-off energy was set to 380.0 eV and Brillouin zone sampling was executed by using the Monkhost−Pack scheme with a k-point grid of 3 × 3× 3. The values of the k-point grid and the kinetic energy cut-off were determined to confirm the convergence of total energies. The original crystal structure of 2,6-DPA has been retrieved from the Cambridge Crystallographic Database (CCDC NO. 1044209). The 2,6-DPA belongs to the P2(1)/c space group with crystal parameters a = 17.973(8) Å, b = 7.352(3) Å, c = 6.245(3) Å, β = 90.646(9)° and V cell = 825.146 Å3. The periodic environment of the crystal was measured by using periodic boundary conditions in all three crystallographic directions. The geometry optimization of the crystal structure was smeared to permit the atomic configurations, cell shape, and volume to change. In the geometry optimization, the total energy of the system was consider to have converged when it was less than 5.0 × 10⁻⁶ eV, when the displacement of atoms was less than 5.0 × 10⁻⁴ Å, and the residual bulk stress was less than 0.02 GPa. In 2003, W.F. Perger Reference Perger48 suggested that B3LYP hybrid functional can produce a band gap of anthracene in reasonable agreement with experiment. Therefore, we have adopted the B3LYP functional implemented in CASTEP module to estimate the band structure and band gap.
The transfer integral was computed using the PW91PW91 functional with the 6-31G(d,p) basis set by the site-energy corrected method, which has been shown to provide a decent descriptions for the transfer integral at the DFT level. Reference Troisi and Orlandi49,Reference Nan and Li50 These calculations were done with the Gaussian 09 package. Reference Frisch, Trucks, Schlegel, Scuseria, Robb, Cheeseman, Scalmani, Barone, Mennucci, Petersson, Nakatsuji, Caricato, Li, Hratchian, Izmaylov, Bloino, Zheng, Sonnenberg, Hada, Ehara, Toyota, Fukuda, Hasegawa, Ishida, Nakajima, Honda, Kitao, Nakai, Vreven, Montgomery, Peralta, Ogliaro, Bearpark, Heyd, Brothers, Kudin, Staroverov, Kobayashi, Normand, Raghavachari, Rendell, Burant, Iyengar, Tomasi, Cossi, Rega, Millam, Klene, Knox, Cross, Bakken, Adamo, Jaramillo, Gomperts, Stratmann, Yazyev, Austin, Cammi, Pomelli, Ochterski, Martin, Morokuma, Zakrzewski, Voth, Salvador, Dannenberg, Dapprich, Daniels, Farkas, Foresman, Ortiz, Cioslowski and Fox51 Finally, the charge mobility of 2,6-DPA at different hydrostatic pressures was calculated with the tight binding model.
III. RESULTS AND DISCUSSION
To find a suitable computational method, we used two different functionals, LDA and GGA, to the single crystal 2,6-DPA as a test. To optimize the crystal structure of the 2,6-DPA at ambient pressure without any constraint we have adopted LDA in the CA-PZ scheme and GGA in the PW91 (Perdew−Wang-91) Reference Perdew and Wang52 and PBE (Perdew−Burke−Ernzerhof) Reference Perdew, Burke and Ernzerhof46 schemes. The calculated lattice constants together with experimental data were presented in Table I. From Table I we can observe that the mean errors of the LDA results are higher than those of the GGA results. Comparing these three methods, the results obtained with the GGA method are in contrast with the experimental values; for example, the mean relative errors of lattice parameters for the three methods are 9.46%, 5.17%, and 1.17%, respectively. This indicates that the precision of GGA is better than that of the LDA functional. The bond lengths and bond angles obtained with the three methods along with the experimental data were presented in Table S2 (see Supplementary Material). Examination of the results showed that the calculated structural parameters are well match with experimental values, demonstrating that the GGA can well predict the structure and properties of the 2,6-DPA crystal. This endorses that the calculated results are rational. Therefore, GGA method is adopted for following calculations.
Comparison of the lattice constants, volume and density obtained with LDA/CA-PZ, GGA/PW91, GGA/PBE, and the experimental data for 2,6-DPA at ambient pressure.

a The mean error of the lattice parameters indicates the average absolute relative error.
A. Compressibility of 2,6-DPA at 0–10 GPa
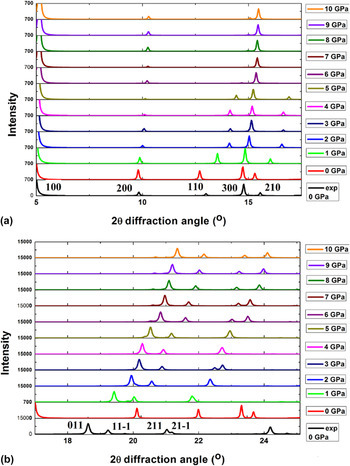
Compressibility is an important feature of the response of a structure to pressure. Reference Goodwin53 For crystals, compressibility can be calculated from x-ray diffraction data on the changes in cell parameters versus pressure. The simulated diffraction pattern at ambient pressure agrees well with the experimentally determined pattern. The 2θ angles of the simulated XRD pattern ranges from 5 to 25° and are presented in Fig. 2. The shifts due to pressure for the peak of 110 around 12.5°, for the double peak 300 and 210 around 15°, and peak 011 at 18°, can be seen in Fig. 2. The shifting of the Bragg peaks to higher values of the diffraction angle with pressure governs the shrinkage of lattice parameters.
Computed powder XRD patterns in the range (a) 5–17° and (b) 17–25° of 2,6-DPA under hydrostatic compression.

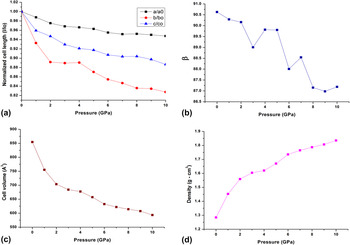
To show the effect of applied pressure on the 2,6-DPA single crystal, Fig. 3 shows the normalized cell lengths (a, b, c), unit cell volume (V), and density (ρ) in the 0–10 GPa pressure range. The computed lattice parameters well compare with the experimental data at ambient conditions. As expected, the lattice parameters decrease with an increasing pressure. In this pressure interval the variations of the unit-cell angles are modest: the monoclinic angle β shows abrupt changes between 0 and 10 GPa and is reduced by 3.8% of its original value, whereas the α and γ angles are unaffected by the pressure. It is notable that under hydrostatic compression the lattice constant b is changed about two times as high as the change of the two other lattice constants a and c. Up to a pressure of 10 GPa the lattice constant b is decreased by 1.3 Å, whereas, a and c only change by 0.9 and 0.7 Å, respectively. The degree of lattice distortion (DLD) measured by the STRAIN program Reference Aroyo, Kirov, Capillas, Perez-Mato and Wondratschek54 is 0.02577 at 1 GPa, and then rises with increasing pressure and reaches 0.06676 at 10 GPa. The crystal packing of 2,6-DPA contains a herringbone motif, which is governed by C–H⋯π interactions. This motif is well-maintained throughout compression to 10 GPa.
The normalized cell lengths (a, b, c), the herringbone angle, the unit cell volume and the density of 2,6-DPA under compression.

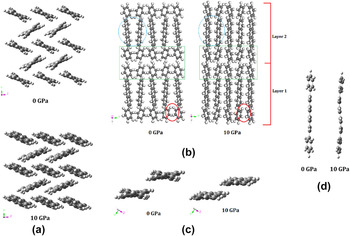
It is interesting to observe that, under hydrostatic compression, the directional character of the intermolecular interactions in 2,6-DPA prompt a substantial anisotropy [Fig. 3(a)]. Using lattice parameters, it is probable to give an equation of state (EOS) in response to pressure. This parametric EOS is a standard feature for aromatic molecular crystals. Generally, for aromatic molecular crystals the Birch–Murnaghan equation of state EOS was used to acquire the bulk modules. Reference Huang, Zhang, Berlie, Qin, Zhao, Zhang, Tang, Liu, Zhang, Zhong, Lin and Chen55 Figure 3 shows the variation of the unit-cell volume in response to pressure. Within the pressure range 0–10 GPa the volume drops by 30.5%. The bulk modulus B 0 and its derivative B′ for 2,6-DPA at ambient pressure and temperature are 4.64(3) and 14.62(5), respectively, which are somewhat comparable with the data presented in the literature for anthracene [8.4(6) and 6.3(4)]. The crystal packing shows large differences under pressure, since the herringbone layer thickness decreases with increasing pressure. As a result, 2,6-DPA shows a decreasing trend of the herringbone angle with pressure. Within this pressure range (0–10 GPa) the density of 2,6-DPA is increased by 43%, i.e., from 1.28 g/mL to 1.83 g/mL, which is similar with that found in anthracene. Reference Oehzelt, Heimel, Resel, Puschnig, Hummer, Draxl, Takemura and Nakayama56 The overall consistency of pressure observed up to 10 GPa endorses a notable change/shift in stacking patterns and molecular structure with increasing pressure is observed (see Fig. 4).
(a) molecular rearrangement along the bc plane (b) molecular rearrangement along the ab plane (c) the stacking arrangement and (d) molecular structure of 2,6-DPA at 0 and 10 GPa. Red circles shows the change between interrelating hydrogens; green boxes highlight the shift between interlocking hydrogens between herringbone layers; blue circles show the shift between the anthracene cores in the herringbone layer.

B. Examination of molecular structure under hydrostatic compression
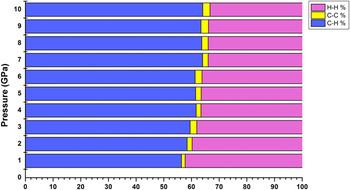
Apart from the bending of the anthracene core and divergence of the torsion angle between phenyl ring and anthracene moiety, the optimized crystal structures of the 2,6-DPA at ambient and high pressure show no significant deviation from the initial molecular structure. The calculated C–C–H angles in the 2,6-DPA molecule are changed from 120° by no more than 2.6°, whereas, the C–C–C angles are 120°. The average C–H and C–C distances remain reasonably close to 1.09 and 1.408 Å and both gradually decrease by about 1% when the pressure is increased to 10 GPa (see Table II). It is interesting to note that the intermolecular C–H and C–C distances in and among the herringbone layers decrease by 16–24% and 16–19%, respectively, in the pressure range of 0–10 GPa. According to the data reported by Oehzelt et al., Reference Oehzelt and Resel57 the nearby intermolecular separation in anthracene reduced by 22% at 10.2 GPa, which is 6% larger than the decrease of C⋯C intermolecular separation in the herringbone layer of the 2,6-DPA. The alignment of the 2,6-DPA molecules in the crystal is defined by the herringbone angle θ, which is linked to the largest change of the lattice constant b. The variation of the lattice constant b under pressure is nearly two times as large as the lattice constant a. As a result, the herringbone angle (θ) is decreased by 16.4% in the overall range of the pressure, the molecules will rearrange in the direction of b by making the molecular planes of two neighboring molecules more and more parallel within the herringbone pattern. But, the minor modifications of the unit cell parameters at higher pressure results in a weaker rearrangement of the molecules. The results also indicate that in the investigated pressure range, a 7° smaller θ was observed for 2,6-DPA at 5 GPa related to that at zero pressure (38.7°), see Table II. Therefore, the molecule itself is forced to reduce the torsion angle (φ) between the anthracene moiety and each phenyl group to provide the more number of intermolecular interactions. The torsion angle undergoes a drastic change in the investigated pressure range from the ambient pressure value 20.54°–6.52°. This structural change is related with an energy change of approximately 60 kJ/mol, as obtained from a single-point B3LYP/6-31G(d,p) energy calculation. Apart from structural modification, the additional entity that was influenced by the hydrostatic compression was the intermolecular interactions. The variations in the intermolecular interactions can be simply examined by evaluating the Hirshfeld surface analysis at each pressure step. Reference McKinnon, Jayatilaka and Spackman58 In Fig. 5, we present the relative contributions to the Hirshfeld surface for nearby intermolecular interactions. For example, under hydrostatic compression, the displacement of the opposing anthracene moieties and π−π stacking distance decreases, and the C⋯C contacts increases; at the same time, the rearrangement of the phenyl groups moderates the aggregation of H⋯H contacts, in favor of a more proportion of C⋯H contacts (see Fig. S1 of the Supplementary Material for an interpretation of the Hirshfeld surfaces and the resulting fingerprint plots). The red zones on the surface which signifies interactions present at ambient pressure become more prominent after compression. When the pressure is increased to 10 GPa, each of the phenyl groups go through a significant twist, reducing individually the torsion angle with the anthracene moiety, which is imposed to slightly bend and lose its planarity: this bending is properly well-suited with the direction of maximum compressibility (see Fig. 4).
Selected intra- and intermolecular distances (Å), bond angles (°), herringbone angle (°) and torsion angle (°) for 2,6-DPA at high pressure (GPa).

Contributions of H–H, C–C and C–H intermolecular interactions within the crystal structure of 2,6-DPA to the Hirshfeld surface at every pressure step.

The Hirshfeld surface analysis also shows that a drastic reduction of the percentage of H⋯H contacts during structural modification is composed by an increase of the C⋯C and C⋯H interactions. This indicates the formation of a denser structure by increasing the percentage of C⋯H and C⋯C (π⋯π stacking) interactions and minimizing the aggregation of H⋯H neighboring interactions. Considering a approximately 1.3% growth in the amount of C⋯C interactions as underlined by the Hirshfeld surface analysis, combined with the approximately 12% reduction in the stacking distance of the 2,6-DPA units, an improvement in the charge transport properties of the 2,6-DPA should be expected when the pressure is increased from 0 to 10 GPa.
C. Effect of hydrostatic pressure on charge transport properties
The fundamental factors that characterize the charge transport property in OSCs are the charge carrier mobility and electron-vibration (phonon) interactions. These features can be normally explained on the origin of either coherent band transport or incoherent hopping transport. Reference Coropceanu, Cornil, da Silva Filho, Olivier, Silbey and Bredas3 One of the major drawbacks in the OFETs experiments is to understand the polaronic transport on the organic surface. Reference Gershenson, Podzorov and Morpurgo59 In SC-OSCs, a number of regimes of polaronic transport are expected, between the limiting cases of the coherent band model at low temperatures and the incoherent hopping model at high temperatures. Reference Gershenson, Podzorov and Morpurgo59 Indeed, simple electronic bandwidths of SC-OSCs can reach more than 600 meV, Reference Koller, Berkebile, Oehzelt, Puschnig, Draxl, Netzer and Ramsey60,Reference Ortmann, Hannewald and Bechstedt61 however, they are intensely abridged by scattering Reference Troisi and Orlandi62 and polaronic effects, Reference Hannewald, Stojanovic, Schellekens, Bobbert, Kresse and Hafner63 thus suggesting that both the transport models are essential. Reference Cheng and Silbey64 Excitingly, band transport at room temperature has been observed in very few organic single crystals, such as pentacene and rubrene. Therefore, we have adopted the tight binding model to calculate the charge carrier mobility of a 2,6-DPA single crystal at different hydrostatic pressures.
Generally, in ultrapure single crystals, the electronic bands are created due to the delocalization of the charge carriers over a more number of molecules. Reference Coropceanu, Cornil, da Silva Filho, Olivier, Silbey and Bredas3 But, the inherent disorders in the site energies due to intermolecular interactions lead to a significant change in charge transfer integral. This change causes significant dispersion in the band structure and consequently affects the charge carrier mobility. Equation (7) clearly indicates that the electron and hole mobilites are mainly governed by the transfer integral (t). On the other hand, transfer integrals are strongly influenced by the arrangement of the adjacent molecules in the crystal. Normally, among different directions in OSCs crystals, face-to-edge packing and face-to-face packing (π–π stacking) can yield solid intermolecular interactions to stimulate charge transport. Reference Coropceanu, Cornil, da Silva Filho, Olivier, Silbey and Bredas3 Thus, greater the transfer integral for a particular type of charge carriers are, the better the direction for charge transport for such a contact is. Recent studies indicate that reliable values for the transfer integrals can be obtained with the direct coupling approach if we consider the spatial overlap between two monomers. Reference Valeev, Coropceanu, da Silva Filho, Salman and Bredas65
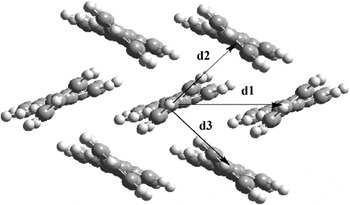
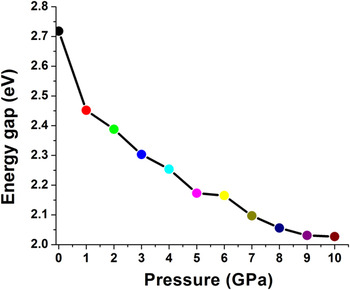
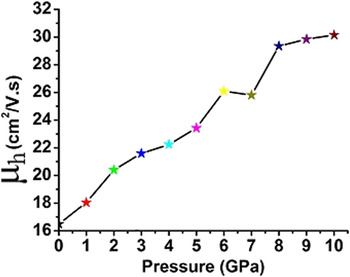
For the title compound, the intermolecular interactions along the long axis (a-axis) are negligibly small. Hence, the discussion for this system will be restricted to the contacts within the bc plane (see Fig. 6); the calculated transfer integral of each direction are listed in Table III. It is noticed that the hole transfer integral in various directions are remarkably different. The center of mass distances of the dimers in the d 2 and d 3 (face to edge stacking) directions along the short axis are equal and fall beneath the π–π stacking dimer in the direction d 1. As a result the transfer integrals along the d 2 and d 3 (t 2 and t 3) directions are approximately three times greater than that of the dimer in the d 1 direction (t 1). The results also show that under applied pressure, the intermolecular charge transfer integrals increase in all the directions due to the decrease of the intermolecular distances and the increase of the overlap of the charge distributions linked with the nearby molecules. Table III clearly indicates, that as the pressure increased from 0 to 10 GPa the dimer distance along the d 1 and d 2 directions decreased by 11.15% and 14.68%, respectively. This suggests that the magnitude of the hole transfer integrals along the d 2 and d 3 directions are higher than the other directions. Furthermore, to well understand the strength of the charge transfer integral between neighboring molecules in different directions of crystal, we have calculated the electronic spectra of an isolated molecule and dimer pairs in different directions using the CAM-B3LYP/6-31G(d,p) level Reference Yanai, Tew and Handy66 which are presented in Fig. S2. The calculated results indicate that for an isolated molecule two peaks at 326 and 370 nm appeared in electronic spectrum. The peak with low oscillator strength observed at 326 nm has contributions from HOMO−1 → LUMO (49%) and HOMO → LUMO+1 (41%). On the other hand, the intense peak observed at 370 nm is connected with the charge transfer character within the molecule and has a dominating contribution from HOMO → LUMO (96%). The calculated electronic spectrum of the dimer in the d 1 direction is similar to that of the isolated molecule; however, the absorption spectrum of the dimer in the d 2 direction contains three peaks at 327, 350, and 378 nm. In comparison with the dimer in the d 1 direction, the additional peak observed at 350 nm in d 2 dimer is related to the charge transfer character and has a dominating contribution from HOMO → LUMO (55%). These results simply designate that the charge transfer peak of the dimer in the electronic spectrum is seen only when there is sufficient coupling between the molecules. We have also investigated the charge transfer character of the dimer in the d 2 direction obtained from the optimized crystal structure of 2,6-DPA under hydrostatic pressure 1–10 GPa (see Fig. S4) and found that the charge transfer peak was red shifted with increasing pressure. This is mainly due to the enhancement of the transfer integral under hydrostatic pressure. To support this, the pictorial representation of the HOMO orbitals of the dimers in the d 1 and d 2 directions at 0 and 10 GPa is given in Fig. 7. From Fig. 7, one can notice that the contribution of the HOMO orbitals to monomers in the dimers in the d 1 direction does not change under pressure. However, a notable change in the HOMO contribution to monomers in the dimers in the d 2 direction has taken place. The HOMO contribution to monomer 1 and monomer 2 in the dimers in the d 2 direction is decreased and increased by 5% upon increasing pressure from 0 to 10 GPa. As a result the hole transfer integral along the d 2 direction is doubled (increased from 62.4 meV to 146.46 meV) under pressure. This endorses that under pressure the charge mobility of the 2,6-DPA single crystal may be increased due to the enhancement of the orbital overlap between neighboring molecules in the diagonal direction. Furthermore, the electronic band structure of SC-OSCs has a significant connection between its crystal structure and charge transport properties. Generally, the total bandwidth for valence and conduction band of an infinite one-dimensional crystalline stack is equal to four times the transfer integral (t). Reference Haddon, Siegrist, Fleming, Bridenbaugh and Laudise67,Reference Huang and Kertesz68 Therefore, for full understanding of the influence of the transfer integrals in the b–c plane (i.e., the herringbone plane), we have also studied the three-dimensional band structure of 2,6-DPA up to 10 GPa using the B3LYP functional, and the results for three different pressures 0, 1 and 10 GPa are shown in Fig. 8 (the band structure in the pressure range 2–9 GPa is available in the Supplementary Material, Fig. S3). For simplicity, only the bands between −2.0 and 4.0 eV are accessible. Both the conduction and the valence bands contain of two sub-bands arising typically from the contacts of the molecular orbitals of the two transnationally nonequivalent molecules presented in the unit cell. The observed splitting of valence and conduction bands into two sub-bands explains the main intermolecular interactions within the herringbone plane are not only followed along the short crystalline axes, but also along the diagonal directions. The presence of dispersive bands together with flat bands in the band structure reveals the anisotropy in the charge transport properties of the crystal. Reference Duan, Li, Geng, Wu, Wang and Su69 And the larger the dispersion of the band is, the higher the charge mobility is. It is apparent as the pressure increases the energy bands together with valence and conduction bands fluctuate ever more. At ambient pressure, the largest valence band dispersion occurs along G–Y and B–D, which correspond to the c* and b* axes, respectively. These results agree well with the computed transfer integrals (see Table III), where dominating values of t are found from the π-stacked dimer (in the d 1 direction) and from the diagonal dimers (in the d 2 and d 3 directions). The flat valence- and conduction-bands occurring along the Y–A direction corresponds to the very small values of the transfer integrals for holes (∼5 meV) along the a*. The conduction and valence band shares most of their relevant features, with relative dispersion along the G–Y and B–D directions. Under pressure the dispersion of valence and conduction bands are increasing along the G–Y and B–D directions. This indicates the enhancement of the transfer integrals along the b and c-axis under pressure. To confirm this we have also presented the calculated density of states (DOS) in Fig. 8, which shows that for both valence and conduction bands there are no significant contributions from other molecular states. At ambient pressure, the calculated bandwidths of HOMO and LUMO are about 614 and 492 meV, respectively. It is interesting to observe that the HOMO band width of 2,6-DPA is somewhat higher than that of the pentacene crystal (600 meV); however, the LUMO bandwidth for the 2,6-DPA crystal is less than that of the pentacene crystal. Reference de Wijs, Mattheus, de Groot and Palstra70 From Fig. 8 we can also notice that the widths of the HOMO and LUMO bands were increased and broaden with increased pressure. The increasing width of the HOMO and LUMO level further assists the increase in hole and electron mobility of 2,6-DPA under hydrostatic pressure, respectively. Because, hydrostatic compression increase the frontier orbital (for instant, HOMO) overlap of adjacent molecules, leading to a wider valence band. It is well known that the band gap (ΔE g) obtained from the band structure calculations plays a key role in determining charge transport properties of SC-OSCs. Even though there is no direct relationship between band gap and charge mobility, the intrinsic hole density in the valence band depends on the band gap and temperature. So, to enhance the charge carrier mobility of SC-OSCs it is essential to control its band gap. Studies on the anthracene crystal indicate that the band gap will decrease with increasing pressure due the fluctuations of the conduction and valence band energy levels. Reference Oehzelt, Heimel, Resel, Puschnig, Hummer, Draxl, Takemura and Nakayama56 The band structure of the crystalline 2,6-DPA at ambient pressure calculated with the B3LYP functional in vacuum yields a direct band gap of 2.718 eV at the gamma point (G), this is slightly lower than the energy gap (3.0 eV) obtained from the experimental absorption spectrum in chloroform. Figure 9 shows the calculated band gaps of 2,6-DPA single crystal in response to the pressure. The energy gap (ΔE g) within this pressure range (0–10 GPa) decreases steadily. Apart from slight changes in the band structure, our results indicate that there is no obvious change in molecular structure. The tendency of the band gap reduction is associated with the decrease of void spacing between molecules that leads to an improvement in the electron coupling between molecules in the system under compression. This also suggests that the rate of electron transitions from the valence to conduction bands increases. The computed transfer integral is used to evaluate the hole mobility of the 2,6-DPA at different pressures using Eq. (7). The calculated hole mobilities at different pressures are depicted in Fig. 10. The calculated results indicate that hole mobility obtained at 0 GPa is 16.491 cm2/V·s, which is larger than the experimental thin film device mobility (10 cm2/V·s). The discrepancy between the experimental and theoretical value is due to modeling the charge transport properties by assuming ideal crystal at room temperature. In spite of the inconsistency between experiment and theory, the calculated results can offer an upper limit of charge mobility and some clues of understanding the charge transport behaviors of OSCs. Figure 10 shows the exciting result that the charge mobility of 2,6-DPA increases under hydrostatic pressure.
Molecular arrangement along the bc plane of the single crystal of 2,6-DPA. Labels 1 and 2 (3) denote the two unlike molecules within the layer; axes d 1 and d 2 (d 3) are those that associate with the unlike molecules.

The transfer integrals for different molecular pairs in the 2,6-DPA crystal in the pressure range 0–10 GPa calculated at the PW91PW91/6-31G(d,p) level.

a r 1, r 2 and t 1, t 2 are intermolecular separations (Å) and charge transfer integrals (meV) between the neighboring molecules in the d 1 and d 2 directions.
Orbital interaction and HOMO contribution to monomers of the dimers P1 (left), P2 (middle) and P7 (right) in the 2,6-DPA crystal.

The self-consistent band structures of 2,6-DPA crystal at different pressures. The horizontal dashed line indicates the Fermi energy level.

Graphical representation of band gap verse pressure for the 2,6-DPA crystal.

The charge mobility of 2,6-DPA under hydrostatic pressure (0–10 GPa).

IV. CONCLUSIONS
This paper presents the quantum chemical investigation of the effect of varying hydrostatic pressure (0–10 GPa) on the charge transport properties of 2,6-DPA single crystal. The calculated XRD pattern is well match with the experimental data at ambient pressure conditions. Significant shifts under pressure were shown for the peak 110 at 12.5°, for the double peak 300, 210 at 15° and for the peak 011 at 18°. The shifting of the Bragg peaks to higher values of the diffraction angle with respect to pressure indicates the decrease in the lattice parameter values. The lattice constants a, b, and c decrease by 0.948 Å (5.23%), 1.30 Å (17.26%), and 0.711 Å (11.34%), respectively, while the monoclinic angle β increases by 3.4° at 10 GPa. Using EOS, the values of the bulk modulus B 0 and its derivative B′ for 2,6-DPA at ambient pressure are calculated to be 4.64(3) and 14.62(5), respectively. The herringbone layer thickness decreases and shows different crystal packing under pressure. The unit-cell volume at the highest compression of 10 GPa decreases by 30.5% and density increases by 43% from 1.28 g/mL to 1.83 g/mL. In this pressure range (0–10 GPa), the intermolecular C–C and C–H distances within and between the herringbone layers decrease by 16–19% and 16–24%, respectively. The nearest intermolecular distance decreases from 4.90 Å at ambient pressure to 4.18 Å (by 14.68%) at 10 GPa. A detailed study indicate that under high pressure, the molecular planes of the crystal become more and more parallel to each other due to molecular rearrangement in the 2,6-DPA crystal. The band structure calculations indicate that the width of the HOMO and LUMO bands increase and decrease, respectively, with increasing pressure. Furthermore, the band gap of the 2,6-DPA decreases with increasing pressure. This indicates a further improvement of hole mobility of 2,6-DPA single crystal under hydrostatic pressure.
Supplementary Material
To view supplementary material for this article, please visit https://doi.org/10.1557/jmr.2016.435.
ACKNOWLEDGMENTS
We are grateful for the financial support from the National Science Foundation of China (No. 21372116) and the Project Funded by China Postdoctoral Science Foundation (No. 2015M581802) for supporting this work.