I. INTRODUCTION
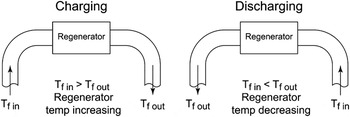
In thermal engineering, a regenerator is a temporary heat store for applications where it is required to intermittently remove and return the thermal energy contained within a fluid. It will commonly aid in increasing efficiency where the fluid is required to flow in both directions between a heated and a cooled area, as it helps to limit the transfer of thermal energy that occurs in this process. A simple diagram of a regenerator in operation is shown in Fig. 1. As such, it is distinct from a heat exchanger, where the role is, typically, to transfer thermal energy in a single direction between a solid and a moving fluid. On the level of the interaction with the fluid phase, the regenerator and the heat exchanger are identical; the performance is related to the local transfer of thermal energy from solid to fluid and is largely determined by the conformation of the material making up the regenerator.Reference Timoumi, Tlili and Nasrallah1 However, in a heat exchanger, this effect and the overall performance will be seriously degraded if the thermal energy is not transported through the solid. A regenerator, by contrast, has to return the thermal energy to the fluid at a later stage in the cycle (which may be temporally very close); therefore, the transport of energy through the structure should be limited, as it will diminish the local temperature differences driving heat transfer and facilitate the loss of energy from the system. Although the desirable topology of solid and open spaces in a porous material for heat exchange and regenerator use may be very similar (affected by the precise balance of pressure drop across the porous body and heat transfer coefficient required for optimal overall behavior), the material requirements will be very different. A heat exchanger will prioritize high thermal conductivity materials, whereas for a regenerator low conductivity will be favored, while high heat capacity would be expected to be important.
Schematic diagram of the operation of a regenerator in a thermal system. The switch between the charging and discharging phases may happen at several Hertz or a fraction of a Hertz, depending on the application.

One example of a system that uses a regenerator is a Stirling engine; this is an external heat engine in which a working fluid circulates in a closed regenerative cycle. The ability of the engine to be operated by a wide range of heat sources and its potential high efficiency compared with internal combustion engines makes it an attractive prime mover for the future.Reference Thombare and Verma2 In a Stirling engine, the regenerator normally consists of a metallic material with a high surface area, and its role is to store heat from one part of the cycle for use during another.Reference Organ3
The effectiveness of a regenerator in terms of its thermal performance relies upon the regenerator’s matrix material; although many different materials are used, for regenerators in Stirling engines, such as PHILIPS MP1002CA (Eindhoven, Netherlands), General Motors GPU3 (Warren, MI) and CLAPHAM,Reference Organ3 using combustion as a heat source in steel alloys, particularly stainless steels, are commonly considered the appropriate choices, based on their relatively high heat capacity and low thermal conductivity.Reference Organ3 Other materials, such as brass, copper, and aluminum have been tested in some forms but their performance is lower.Reference Timoumi, Tlili and Nasrallah1 In addition, in an application such as the Stirling engine, the overall efficiency of the engine will be affected by the power required to move the working fluid through the regenerator; this can be characterized by the pressure drops across it or the permeability of the material used. Clearly, the requirements of high heat transfer and low resistance to flow are in conflict, as in a simple picture, more material will allow more thermal energy to be stored while at the same time increasing the resistance to flow. Therefore, there is the need for optimization of the material to be used to achieve a good balance between these criteria.
Regenerators in applications such as the Stirling engine will use a porous metal structure of some type, such as a collection of particles, a coiled wire, or a wire mesh screens (although it should be noted that this latter type of regenerator has a drawback, as the working fluid leaks through the inner perimeter of the tube).Reference Chen, Chang and Huang4 Open cell metal foams have the potential advantage over these structures in that their form can be tailored by changing the density, pore size, etc., and, provided the processing method used offers a sufficient degree of control, this may allow good thermal performance to be achieved with reduced pressure drop.
Researchers have conducted tests to measure the pressure drop and heat transfer coefficient in aluminum foams processed by an investment casting route and reported lower pressure drops compared with wire mesh screens.Reference Tanaka, Yanashita and Chisaka5 However, this type of metal foam has high porosity (90–95%) which results in excessive dead volume (space within the heat engine or thermal system i.e., not part of the hot or cold chamber; i.e., not able to contribute to the cycle). Their high porosity also (or low density) means foams of this type have lower thermal capacity, resulting in reduced effectiveness in comparison with wire mesh screens.
In contrast, metal foams produced by the “replication” process can have lower porosity (the range of 65–75% is easily achieved) resulting in lower dead volume and higher thermal capacity. They thus have the potential to be designed to provide a better performance as a regenerator. Moreover, the manufacturing method is somewhat simpler and cheaper than investment casting and offers great flexibility for the design of the foam structure.Reference Conde, Despois, Goodall, Marmottant, Salvo, San Marchi and Mortensen6
In this paper, the potential of replicated aluminum foams, and by extension, foams of other metals, to serve as regenerators is examined. Aluminum foams with pore sizes from 2 to 2.36 mm were manufactured and the pressure drop and thermal performance were measured. The performance of the foams was compared with that of a bed of 2 mm stainless steel ball bearings, which are a structure that has been widely tested as regenerators, in particular for chemical reactors,Reference Tong and London7 and allow us to benchmark the performance of the metal foams.
II. EXPERIMENTAL AND ANALYSIS METHODS
A. Foam processing method
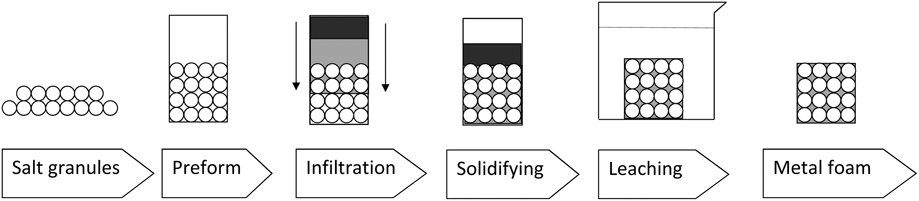
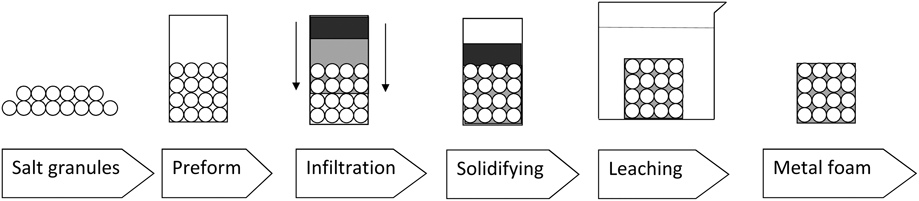
In this work, aluminum foam was produced by casting commercially pure (99.87%) aluminum at 740 °C around soluble NaCl granules packed in a mold (which form the preform and define the shape of the pores); this process is known as replication.Reference Conde, Despois, Goodall, Marmottant, Salvo, San Marchi and Mortensen6 After the molten aluminum has solidified, the salt granules are removed by dissolving with water. Figure 2 shows a flow diagram of the main steps in the replication process.
Flow diagram of the principal steps in the replication process.
The preform preparation and infiltration steps are key to the manufacturing process, as in these stages, the structure and density of the foam can be tailored. The preform is the negative shape of the required foam (it fills all the space that will become pores) and the material used must fulfill three main conditions: have a higher melting point than the metal being cast; be chemically stable in contact with the molten metal; and be easy to remove once the metal has solidified.Reference Conde, Despois, Goodall, Marmottant, Salvo, San Marchi and Mortensen6 Sodium chloride achieves all of these requirements, for which reason it was used here. Its melting point is 801 °C,Reference Ebbing and Gammon8 and it is chemically inert in contact with aluminum during the infiltration and leaching steps. Moreover, removing it from the foam does not create toxic or hazardous by-products,Reference Goodall and Mortensen9 increasing the ease of foam processing. To produce the preform NaCl, water softening salt tablets (Hydrosoft tablet salt) were obtained in the form of lozenges with a largest diameter of 20 mm and they were crushed and sieved to obtain grains in the size range of 2–2.36 mm; this size was chosen because of its closeness to the 2 mm stainless steel ball bearings that were used in the comparison. Although free space is of a different form in the two structures, the porosity will be different, and this ensures that feature size is comparable.
The next step is infiltration of the preform with liquid metal. Unlike in many cases of the replication process, as relatively high density foams were required, the salt particles were not compacted to make the preform but simply poured into a crucible. In this case, the infiltration stage is particularly critical, as this directly influences the density of the foam. Liquid aluminum has a high surface tension and does not easily wet the salt, so infiltration needs an external pressure (in this case provided by argon gas), but if too high a pressure is used, the salt grains may become almost completely enclosed by aluminum and cannot then be easily dissolved by water. In this experiment, molten aluminum was infiltrated under 4 bar argon gas. An excess of metal was used, and the crucible was cooled such that solidification was directional from the bottom of the mold, so that solidification shrinkage occurred outside the foam portion.
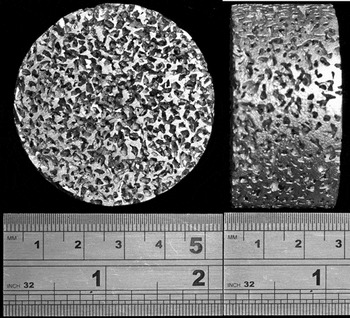
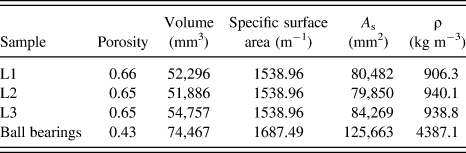
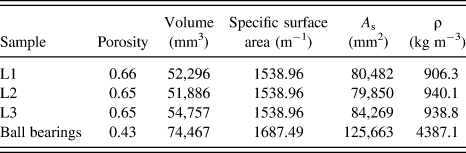
Samples were machined to cylinders of 50.8 mm diameter and approximately 25.4 mm height, an example is shown in Fig. 3. This size was selected to ensure that an adequate number of pores would be expected across the smallest specimen dimension (>10) for the tests to be less susceptible to minor variations in the foam structure (for mechanical properties, 6 or more pores have been recommended for consistent results).Reference Andrews, Gioux, Onck and Gibson10 The foams were also found to have slightly higher densities when machined from the bottom of a casting (typically a difference in porosity of 2% or less). This may be due to differences in the packing efficiency of the salt particles poured into the mold or due to a small degree of solidification shrinkage in the metal if the extraction of heat from the bottom of the chamber was not sufficiently high. As can be seen from Table I, the samples had different length and consequently different volume. In the investigation, the density (and hence the porosity) of each individual sample was determined, and the characteristics are shown in Table I.
An example image of a sample of replicated aluminum foam used in this work (2–2.36 mm pore size).

Summary of sample characteristics used in this work.
B. Thermal and pressure drop apparatus
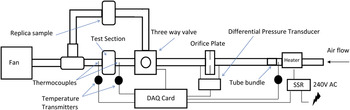
A test rig was built to conduct the pressure drop and thermal measurements. A diagram of the test rig is shown in Fig. 4. The rig consisted of 52 mm (2 inch) plastic pipe down which air is flowed. Porous matrix samples were placed in line and the pressure drop and temperature response measured.
A schematic diagram of the test rig used for the thermal and pressure drop measurements.

A steady air flow was provided by two high speed centrifugal fans controlled by adjusting the input current using an 8 Amp Variac variable transformer. Air passed through an inline heater (AHF-14240 Omega, Stamford, CT) reaching a temperature of 20 °C over ambient (in the case of thermal measurements) and then passed through a tube bundle flow conditioner (Type C-BS EN ISO 5167-1:1997)11 to straighten the flow. The flow then passed through a length of pipe equal to 30 D (tube diameters), so that it is fully developed before reaching a calibrated flanged-type orifice plate that was used to measure the flow rate. The pressure tappings and their position were compatible with BS EN ISO 5167-1:19979. The pressure drop was measured by a differential pressure transmitter (Furness Controls–Model 332-4W) with an accuracy of ±0.25% (reading). To calculate the flow rate, the air density was calculated from the atmospheric pressure, temperature, and humidity.
All fittings and pipes were made out of ABS plastic for its low thermal conductivity. The rig was tested for leaks by pressurizing it to 0.3 bar, which it held for 30 min. The sample was held in place between two flanges. The circumference of the sample was wrapped in PTFE tape to seal the gaps between the sample and pipe wall and reduce the heat loss from the sample again to the pipe wall.
C. Pressure measurements
The pressure drop across the samples was measured with a differential pressure transmitter (Omega DPGM409DIFF-350HDWU, 0.08% combined linearity, hysteresis and repeatability). The pressure loss of each sample was measured at 7 different flow rates and at each flow rate, the measurement was repeated 20 times to ensure repeatability. Pressure measurements were performed at room temperature.
D. Thermal measurements
To examine the thermal performance of the foam measurements of the amount of heat extracted from a flowing fluid under transient conditions needs to be identified. The samples were placed into the rig described above and subjected to a step change in the incoming temperature and the temperature downstream of the sample monitored. A three-way ABS valve was installed to direct the incoming air either through the test section or bypassing it through a dummy sample. This was another foam of similar structure and permeability used to give a comparable pressure drop to the test sample and ensure that the air velocity and temperature going through the test sample did not fluctuate while switching. The valve was operated by a rotary pneumatic actuator and controlled by a solenoid valve, which could redirect the incoming air in less than 0.15 s. To achieve a constant inlet temperature, following the step change, the input power of the heater was switched using On/Off control by a solid state zero crossing relay (SSR) at 7 Hz. A PID LabView code sent the signal from the DAQ card to the relay and controlled the temperature by adjusting the duty cycle of the signal. A 0.5 mm K-type thermocouple, positioned after the flow straightener, provided the feedback loop to the PID code.
The temperature before and after the sample was found using two K-type Butt-welded unsheathed 0.25 mm thermocouples that were positioned at the center of the pipe. Fine thermocouples were used to ensure that the transient thermal response of the thermocouple did not influence the results and the time constant of the test thermocouples was found to be 0.003 s at an air velocity of 20 m/s. Two 2-wire temperature transmitters (Farnell 300TX, Leeds, UK, with ±0.2% accuracy of the thermocouple range) were used to amplify and linearize the signals.
A 16-bit PCI-6221 National Instrument (NI) data acquisition card (DAQ) was used to receive and send the signals. A NI LabView code monitored and logged the data, and a PID LabView code controlled the On/Off switching of the heater. Experiments were performed at five different air velocities and for each velocity, four tests were conducted.
E. Thermal analysis
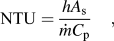
In regenerators, the heat transfer occurs by transient convection as the flow rate is cyclical, and thus, transient methods were adopted to investigate the samples. The heat transfer performance of the samples under these conditions can be characterized using two related parameters; the NTU and convective heat transfer coefficient, h. The NTU is a dimensionless parameter that measures the effectiveness of the whole heat transfer systemReference Cengel and Boles12:
 $${\rm{NTU}} = {{hA_{\rm{s}} } \over {\dot mC_{\rm{p}} }}\quad ,$$
where h is the convective heat transfer coefficient, A s is heat transfer surface area of the sample,  $\dot m$ is the fluid mass flow rate, and C p is the specific heat capacity of the fluid. Thus, the NTU of a system depends on the both the matrix and flow. Equation (1) shows that NTU is also related to the size of the sample. By calculating h the thermal performance of the sample can be evaluated regardless of the sample size. The primary heat transfer mechanism within the metal matrix is forced convection, and it is represented using Newton’s Law of Cooling
 $$Q = hA_{\rm{s}} \left( {T_{\rm{f}} - T_{\rm{s}} } \right)\quad ,$$
where T f is the temperature of the fluid and T s is the surface temperature of the solid. The coefficient h can be thought of as the rate of heat transfer between a solid surface and a fluid per unit surface area per unit temperature difference and has units of W/m2K.Reference Cengel and Boles12
The single-blow method for investigating the transient thermal performance of a heat exchanger (essentially what we want to probe to determine the effectiveness of a material for a regenerator application) has been one of the principal techniques for experimental investigations since it was developed by Schumann.Reference Schumann13 Schumann derived the solutions for the fluid and solid temperatures as functions of time and position when a porous prism, initially at a uniform temperature, is subjected to a step change due to a flowing fluid at a different uniform temperature. The theory was applied to a practical scenario the following year when FurnasReference Furnas14 used the solutions in a study on heat transfer from a gas stream to a bed of iron balls. Furnas compared the experimental output curve from the single-blow rig to the theoretical curve generated from Schumann’s work to determine the practical heat transfer coefficients and derive empirical solutions. Since then there have been many different data reduction methodsReference Locke15–Reference Kohlmayr18, Reference Heggs and Burns19–Reference Baclic, Gvozdenac, Sekulic and Becic21 developed for obtaining the heat transfer coefficient, which are widely considered to be more accurate than the original curve matching technique.Reference Locke15
The technique used here for obtaining the heat transfer coefficient is the maximum slope method, which works by analyzing the breakthrough temperature response curve of a fluid flow at a uniform constant temperature that has been passed through a heat exchanger at a lower temperature. LockeReference Locke15 demonstrated that the experimental heat transfer coefficient was obtainable using a unique relationship between the maximum slope of the output temperature response curve and the NTU value of the fluid flow at the inlet of the heat exchanger, providing that the input can be assumed to be a step function.
More recently, Chen et al.Reference Chen, Chang and Huang4 proposed an improved model that includes the heat flow from the boundary of the test sample into the external tube. They also added the Joule–Thomson expansion effect on data. Chen and ChangReference Chen and Chang22 improved the previous model by adding the effects of axial conduction and heat flux into the tube wall. The Joule–Thomson expansion effect is negligible for the pressure drop of the samples tested for this experiment and therefore is not included in the model used for this experiment. The effects of heat flux from the sample to the sample holder and arbitrary inlet flow temperature are included in the model.
A theoretical prediction of the temperature–time history of the fluid leaving the sample was obtained by numerically solving the energy equation. The assumptions for solving this model are:
(i) The elements (a metal ball or a small section of the metal foam) which constitute the sample are at a uniform temperature at any given time.
(ii) The axial conduction in the fluid is negligible.
(iii) There is a uniform convection heat transfer coefficient.
(iv) The side wall is not adiabatic.
(v) Radial conduction along both the tube wall and the sample is negligible.
(vi) The fluid velocity is constant along the sample.
The following energy equations of the single-blow system were presented by Chen and ChangReference Chen and Chang22:
For the fluid,
 $${{\partial T_{\rm{f}} } \over {\partial x}} + {\rm{NTU}}\left( {T_{\rm{f}} - T_{\rm{s}} } \right) + {\rm{NTU}}_{\rm{w}} \left( {T_{\rm{f}} - T_{\rm{w}} } \right) = 0\quad .$$
For the regenerator,
 $${{\partial T_{\rm{f}} } \over {\partial t}} + {\rm{\lambda }}{{\partial ^2 T_{\rm{s}} } \over {\partial x^2 }} + {\rm{NTU}}\left( {T_{\rm{s}} - T_{\rm{f}} } \right) = 0\quad .$$
For the side wall,
 $${{\partial T_{\rm{w}} } \over {\partial t}} - R_{{\rm{tc}}} {\rm{\lambda }}_{\rm{w}} {{\partial ^2 T_{\rm{w}} } \over {\partial x^2 }} + R_{{\rm{tc}}} {\rm{NTU}}_{\rm{w}} \left( {T_{\rm{w}} - T_{\rm{f}} } \right) = 0\quad ,$$
where T f, T s, and T w are the nondimensional fluid, matrix, and tube wall temperature, respectively, t is the nondimensional time, R tc is the capacitance ratio of the sample to the tube wall, λ and λw are the nondimensional effective thermal conductivity of the matrix and the tube wall, and NTUw is the NTU of the tube wall.
Numerical predictions of T f, T s, and T w were calculated by solving Eqs. (3), (4), and (5) using a finite-difference method, and the time accuracy of the solution was further corrected by a Crank–Nicolson scheme.Reference Chang, Hung, Ding and Chen23
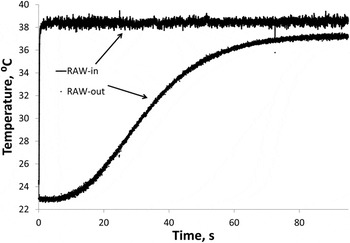
Shown in Fig. 5 are typical results from the thermal tests. The temperature history before (in) and after (out) the sample is shown. The sharp step change in the incoming temperature can be observed; in this case, it took around 1 min for the temperature behind the sample to reach values similar to that of the incoming flow. The output temperature never achieved the higher step temperature as a result of heat transfer from the sample to the pipe walls demonstrating the importance of modeling this effect. Both thermocouples were subjected to low amplitude high frequency noise, and this was removed by applying a moving average.
Typical response of the inlet and outlet temperature measurements.

The maximum gradient is the maximum value of the first derivative of the outlet temperature. The first derivative of the data was numerically differentiated by the centered finite-divided difference formula. However, to differentiate the data, a curve should be fitted to the data. A cubic spline algorithm was used to fit the curve to the data. This nonparametric fitting creates a smooth curve that goes through the data. The best fit was obtained by comparison of the least squares of residuals of the fit for different values of span.
The measured maximum gradient was then matched with the maximum gradient of the predicted curve in an iterative method. First, an arbitrary NTU and NTUw were guessed and with other specifications of the sample were added into the model and the maximum gradient was calculated. If the predicted maximum gradient and the final exit temperature matched the experimental value, then the guessed NTU and NTUw were correct.
III. RESULTS AND DISCUSSION
A. Thermal
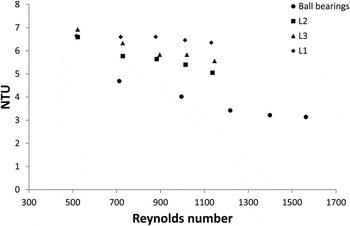
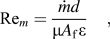
Four experiments were performed at each flow rate; the results were averaged and matched to obtain the NTU as detailed above. The NTU plotted against the Reynolds number (Rem) is shown in Fig. 6. The Reynolds number is calculated for the flow within the sample. The diameters of the ball bearings and salt particles were assumed as the characteristic length of the sample, d, to calculate the Reynolds number:
 $${\rm{Re}}_m = {{\dot md} \over {{\rm{\mu }}A_{\rm{f}} {\rm{\varepsilon }}}}\quad ,$$
where A f is the cross-sectional area of the sample, µ is the dynamic viscosity of the air, and ε is the sample porosity. The NTU for all three metal foams tested are higher than for the ball bearings. The NTU decreased as the Rem increased as the residence time of the fluid (represented by the mass flow rate) decreased. Some variation in the three metal foam samples can be observed as a result of manufacturing differences.
NTU of the samples plotted against Reynolds number.

The heat transfer coefficient, h, is found from NTU; however, as can be seen from Eq. (1), the heat transfer surface area of the sample must be known. For the case of the ball bearing sample, it was calculated by assuming that the steel balls were impenetrable spheres and the pack was statistically homogeneous. The heat transfer area A s can be obtained by the flowing equationReference Elsner, Wagner, Aste, Hermann and Stoyan24:
 $$A_{\rm{s}} = 4{\rm{\pi }}R^2 \varphi \quad ,$$
where ϕ is the number of spheres and R is the radius. The number of spheres was calculated knowing the mass of 2000 spheres and weighing the whole sample to estimate the total number. Ten thousand ball bearings were estimated in the sample following this method. For the foam samples, a simple estimate of the surface area was obtained by assuming that all the salt particles, and hence the pores formed, were spheres with a diameter of 2.18 mm (the mid-value of the range within which the NaCl particles were sieved). This is essentially the same method as for the packed steel spheres sample, except that the solid and gas phases are inverted (a change that does not, in the first approximation, affect the surface area). This will be an overestimate of the surface area, as it counts a full sphere for each pore, whereas for each one, there will be a certain amount removed due to the interparticle contacts. As can be seen from the equation above linking NTU and h, the value of h estimated in this way will therefore be lower than is actually the case.
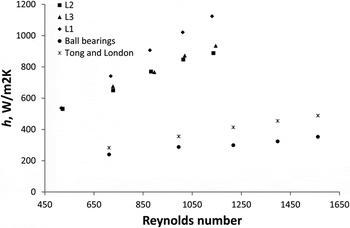
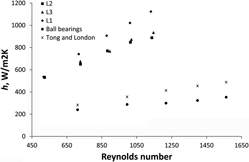
Shown in Fig. 7 is the thermal performance of the samples with increasing Reynolds number (calculated for the flow within the sample). It can be seen from this graph that h increased with the Reynolds number. The foam samples had a significantly larger value of h and were also more sensitive to changes in the flow than the ball bearings. There was some variation in the 3 foam samples, which is likely to arise from the stochastic nature of the structure and the dependence of the behavior of the finer details of these samples. It is clear that there will be some variation between samples of foam processed in the same way (the data in Table I indicate the degree of variation in the porosity, even for foams of nominally the same condition), and this will have some impact on the performance obtained. Here, samples that are large compared with the pore size have been used to reduce this effect (pore diameter/sample size ratio < 0.1); it would be anticipated that the variation would be reduced further as larger samples or smaller pore sizes were used.
Heat transfer coefficient of the samples against Reynolds number and linear fits through the data are shown.

Also shown in Fig. 7 are calculated values of h obtained from the experimental correlation of Tong and London.Reference Tong and London7 While the differences between the two studies are significant, they are much smaller than between the two types of matrix. The ball bearing packing will result in variations in h and could account for some of the variation observed here. Moreover, Tong and LondonReference Tong and London7 used Schumann’s analytical solution, which did not include the effects of heat loss from the tube wall and arbitrary inlet flow temperature, to estimate the NTU. This could be the other reason of the differences.
B. Pressure drop
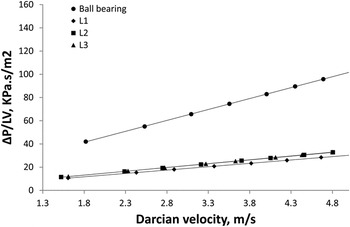
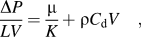
The thermal performance of the regenerator cannot be analyzed in isolation from its pressure loss. To characterize pressure drop, hydraulic parameters such as permeability and drag coefficient must be known. According to Boomsma et al.Reference Boomsma, Poulikakos and Zwick25 for low flow velocity (>0.1), the fluid inertial forces become important, and the Darcy–Forchheimer equation should be used to describe the pressure drop in terms of the second power of the velocityReference Dukhan and Chen26:
 $${{\Delta P} \over {LV}} = {{\rm{\mu }} \over K} + {\rm{\rho }}C_{\rm{d}} V\quad ,$$
where C d is a form drag coefficient, K is the permeability, ρ is fluid density, and L is the length of the porous medium in the flow direction. V is the Darcian velocity that was calculated by dividing the volumetric flow rate by the cross-sectional area. The first term of Eq. (8) represents viscous energy losses defined by the permeability (K) and the second term represents the kinetic energy losses represented by the drag coefficient (C d).
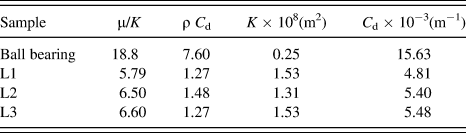
The coefficients K and C d were obtained from calculated linear fits to the data. The permeability and form drag coefficient of the samples are tabulated in Table II. It can be seen that the ball bearings had the highest values of drag coefficient.
Curve fitting constant and permeability and form drag coefficient.
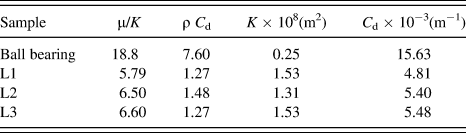
The data for foam permeability in Fig. 8 show relatively little difference in permeability, especially noting that one of the samples has a porosity of 0.66 compared with 0.65 for the other samples. This may reflect some underlying variability in the foam structure. The packing of the salt grains will be random, and small differences in location of pores and size of the interconnecting windows could have a large effect on the permeability. It has been attempted to make samples that are representative of the material by having a large number of pores, but the effect may be compounded by the fact that the pressures required to infiltrate larger grains of salt are low, and thus, the pressure differences between the top and bottom of the casting could affect the structure locally.
Pressure drop versus Darcian velocity.

C. Suitability of foams as regenerators
The results above show that, compared with a packed ball bearing material, a replicated aluminum foam has a higher heat transfer (whether measured by NTU or h) and a lower pressure drop, both of which are characteristics that would be suitable for improving the regenerator performance. This is despite the fact that the material the foam is made from would not be expected to be as optimal for regenerator performance as that of the ball bearings. The foam structure, which allows good heat transfer by ensuring mixing of the fluid as it flows through, and reduced barrier to fluid passage, is an improved structure for these properties. Aluminum foams could therefore compete with packed ball bearings for regenerators for some chemical processes, for example (provided there are no issues with chemical interaction between the gas and the regenerator matrix material).
Of course, packed ball bearings are not the only type of regenerator available. Other forms, such as wire meshes, are known to have good performance for certain applications such as cryocooler regenerators. Existing regenerators achieve much larger surface areas and use stainless steel which is a more favorable material due to its higher specific heat capacity and lower longitudinal thermal conductivity than the aluminum foams. Nevertheless, the foams tested here have not been optimized for this application (either from the point of view of matrix material or structure), and it may reasonably be expected that their performance could be increased, perhaps sufficiently to make them competitive across a wide range of regenerator applications.
Thus, there are strong indications that foams offer the flexibility in design for different properties that could be attractive for use in regenerators. The properties shown by the example of foam tested here are more suitable than the packed ball bearings, but will not reach that of other possible regenerator materials. As a guide to further development, which may allow metal foams to surpass these other materials, the type of foam structure that could provide the performance sought can be estimated.
An example of an existing regenerator is that used in the General Motors Stirling engine GPU3 (8.95 kW output power). This consists of 308 layers of stainless steel mesh (Number 200) made of a wire of 0.04 mm diameter, filling space such that the effective porosity is 0.75. The surface area per unit volume can be calculated by the equation provided by Tong and LondonReference Tong and London7:
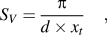 $$S_V = {{\rm{\pi }} \over {d \times x_t }}\quad ,$$
where d is the wire diameter and  $x_t$ is the ratio of the distance between wires to the diameter of the wire. The specific surface area for this regenerator is 24 (mm−1).
If the surface area available for heat transfer is assumed to be a key property of the structure, we can seek a foam that would give us the same characteristics. Using a similar approach to obtain the surface area for the calculation of the h values of the foams examined here, we can estimate that a foam with spherical pores of radius r and porosity ε will have a surface area per unit volume,Reference Despois and Mortensen27S V, given by:
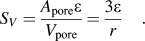 $$S_V = {{A_{{\rm{pore}}} {\rm{\varepsilon }}} \over {V_{{\rm{pore}}} }} = {{3{\rm{\varepsilon }}} \over r}\quad .$$
This is of course a simple estimate that will break down for low ε (pores no longer interconnected) or high ε (the neglecting of the area lost for interpore windows being no longer a reasonable assumption). The equation indicates that there are of course a range of different pore size and porosity values that will produce the required porosity, but a desirable structure can be further defined by estimating the permeability. To do this, the approach of Despois and MortensenReference Despois and Mortensen27 will be used. These workers derive an equation for the permeability of foams and validate their equation over a range of structures for several foam types, including those processed by replication. Their equation for permeability, K, is:
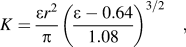 $$K = {{{\rm{\varepsilon }}r^2 } \over {\rm{\pi }}}\left( {{{{\rm{\varepsilon }} - 0.64} \over {1.08}}} \right)^{3/2} \quad ,$$
where terms are as defined previously. This shows that the permeability will be highest (and therefore the resistance to fluid flow will be lowest) for structures with high porosity and large pore size. The dependence on the pore size is to the power 2, but on the porosity it is 2.5, so the optimal choice to keep the permeability as high as possible will be to prioritize the increase of porosity. Therefore, setting a porosity value of 0.8, which can be achieved easily with replication, indicates that the pore size should be 0.2 mm.
Increasing the porosity would decrease the thermal mass of the regenerator but this would also decrease the pressure drop through the foam. The effect of increasing the pressure drop is more significant than reducing the regenerator mass. Increasing the porosity reduces the amount of energy that can be stored in the sample by the first power of the mass. However, the velocity inside the sample decreases by increasing the porosity and this reduces the pressure drop by as much as the square of the velocity.Reference Tong and London7 Therefore, lower pressure drop is more favorable than increasing the mass by decreasing the porosity.
Making such a foam from stainless steel is a challenge for processing, as higher melting point metals and smaller pore sizes are in many cases more difficult to create. Nevertheless, similar structures (with pore sizes of the same order of magnitude) have been created from high melting point metals (>1300 °C) by replication previously,Reference Boonyongmaneerat and Dunand28,Reference DeFouw and Dunand29 using alternative materials such as NaAlO2 or SrF2 for the preform, and would also be possible to make through other foam processing routes, such as those based on powder technologies.Reference Goodall, Chang and Zhao30
IV. CONCLUSIONS
An experimental investigation has been performed on the use of aluminum metal foams as thermal regenerators. The regenerator removes and releases heat from a fluid which is typically cycled across the matrix and must therefore both effectively store and transfer energy.
Matrices were manufactured using the replication technique with salt (NaCl) grains of 2–2.36 mm. Samples of 50.8 mm diameter, 25.4 mm thick with a porosity of 65% were achieved. The pressure drop and thermal performance were tested by passing air through the samples. The thermal response was determined by subjecting the porous matrices to a step change in temperature and monitoring it downstream of the sample, from the resulting temperature gradient, the heat transfer can be quantified in terms of the NTU and the convective heat transfer coefficient, h. The performance of porous matrixes was compared with the matrix made up of 2 mm-diameter steel ball bearings.
(i) The pressure drop across the matrices increased with the velocity though the values for the metal foams were much lower than that of the ball bearings. For both samples, the flow was primarily drag influenced.
(ii) The NTU values of the foams and ball bearings reduced with increasing Reynolds number (flow velocity).
(iii) The heat transfer coefficient of the metallic foams were calculated to be significantly higher and much more responsive to Reynolds number than the steel ball bearings. The underlying heat transfer is superior in metal foams as compared with the space between the ball bearings.
Metal foams have potential as regenerators, where the ability to transfer and store heat with low pressure drops is essential and foams offer flexible design (e.g., the potential to cast into complex shapes) and robustness. However, the foams will require smaller pore sizes and more suitable metals. An example of a foam that could possibly achieve these requirements is proposed.
ACKNOWLEDGMENTS
We would like to thank the technicians Mr. Malcolm Nettleship and Mr. Chris Grigson for their guidance and advice. One of the authors, E.M. Elizondo Luna, would like to thank the Mexican Government’s National Council of Science and Technology CONACYT for provision of a scholarship.