Introduction
The gradual decrease in fresh-water resources on the global scale was confirmed during the world summit on sustainable development, held in Johannesburg in 2002. Drinking-water supply in difficult environments, such as in a developing country, is the greatest challenge for the population (Tan et al. Reference Tan, Ooi and Leo2020). Often, in such cases, neither the quality nor quantity of water needed is available. Consequently, populations are exposed to water-born diseases such as cholera and typhoid fever. In order to prevent these diseases, imported ceramic membrane filters are sometime used to decontaminate water for small groups of people (Mouafon et al. Reference Mouafon, Njoya, Hajjaji, Njoya, Lecomte-Nana and Njopwouo2020). The development of new, low-cost, ceramic membranes for water filtration is required urgently.
Ceramic membrane is known as an inorganic separation medium, used to remove solid particles, microorganisms, and colloidal material from organic, oily wastewater and aqueous solvents (Dong et al. Reference Dong, Hampshire, Zhou, Lin and Ji2010; Eom et al. Reference Eom, Yeom, Kim and Song2015; Gao et al. Reference Gao, Fan, Quan, Cai and Zhou2016; Liu et al. Reference Liu, Zhang, Zhang, Jiang and He2016; Xavier et al. Reference Xavier, Valadares De Oliveira, Klitzke, Bellin Mariano, Eiras and Bruno Vieira2019). These inorganic membranes are more attractive than organic or polymeric membranes because of their greater pore-volume fraction, permeability, mechanical strength, thermal and chemical stability, long lifetime, and good anti-fouling properties (Ashaghi et al. Reference Ashaghi, Ebrahimi and Czermak2007; Abbasi et al. Reference Abbasi, Mirfendereski, Nikbakht, Golshenas and Mohammadi2010; Kitiwan and Atong Reference Kitiwan and Atong2010; Dong et al. Reference Dong, Lin, Zhou, Zhang, Ling, Liu, Meng and Hampshire2011; Vida-simiti et al. Reference Vida-simiti, Jumate, Moldovan, Thalmaier and Sechel2012; Barrouk et al. Reference Barrouk, Alami, Kabbabi, Persin, Albizane and Tahiri2015; Amin et al. Reference Amin, Abdallah, Roushdy and El-Sherbiny2016; Rekik et al. Reference Rekik, Bouaziz, Deratani and Baklouti2016; Gao et al. Reference Gao, Fan, Quan, Cai and Zhou2016; Misrar et al. Reference Misrar, Loutou, Saadi, Mansori, Waqif and Favotto2017; Arzani et al. Reference Arzani, Reza, Sheikhi, Mohammadi and Bakhtiari2018; Ali et al. Reference Ali, Hamdi, Rodriguez, Mahmoudi and Srasra2018). Ceramic membranes are also characterized by low bulk density, low thermal conductivity, heat resistance, large porosity, and large surface area (Barea et al. Reference Barea, Osendi, Ferreira and Miranzo2005; Gong et al. Reference Gong, Wang, Cheng, Zhang and Zhang2014). When used in tropical areas, the thermal conductivity of the membranes becomes a key property. Many recent studies have established the thermal conductivities of porous ceramics: e.g. porous ceramics with conductivities of between 1.10 and 0.91 Wm–1K–1 (Barea et al. Reference Barea, Osendi, Ferreira and Miranzo2005), 1.64–18 Wm–1K–1 (He et al. Reference He, Qu and Cheng2016), and 1.00–0.65 Wm–1K–1 (Nigay et al. Reference Nigay, Cutard and Nzihou2017) have been obtained. To achieve a low thermal conductivity, ceramic membranes should contain a large pore-volume fraction, i.e. have significant porosity (Gong et al. Reference Gong, Wang, Cheng, Zhang and Zhang2014). Thermal conductivity is a basic and vital property determining the heat-transfer capacity of porous materials such as ceramic membranes (Xu et al. Reference Xu, Jia and Gong2018). It depends on the components’ structure, porosity, pore geometries, and microstructural configurations of porous networks including its connectivity (percolation) and tortuosity (Xu et al. Reference Xu, Jia and Gong2018). Ceramic membranes are used widely, in both industrial and domestic contexts, for water and wastewater treatment through microfiltration, ultrafiltration, and nanofiltration (Saffaj et al. Reference Saffaj, Persin, Younssi, Albizane, Bouhria, Loukili, Dach and Larbot2005; Baraka et al. Reference Baraka, Saffaj, Mamouni, Laknifli, Younssi, Albizane and El Haddad2012; Sarkar et al. Reference Sarkar, Bandyopadhyay, Larbot and Cerneaux2012; Amin et al. Reference Amin, Abdallah, Roushdy and El-Sherbiny2016; Arzani et al. Reference Arzani, Reza, Sheikhi, Mohammadi and Bakhtiari2018). In some locations, drinking water supply is made possible through the use of alumina or zirconia membranes which are generally very expensive. In order to reduce the fabrication cost, cheaper raw materials and economic preparation methods should be pursued. In tropical areas, the production of membranes, with low thermal conductivity and efficient filtration properties, using local materials, for wide use by the population, is the challenge for science and industry (Werner et al. Reference Werner, Besser, Brandes, Kroll and Rezwan2014; Nivedita and Joseph Reference Nivedita and Joseph2018; Kumar et al. Reference Kumar, Roshni and Vasanth2019; Xavier et al. Reference Xavier, Valadares De Oliveira, Klitzke, Bellin Mariano, Eiras and Bruno Vieira2019). Many scientists have produced novel membranes by using both organic and inorganic materials. Inorganic materials are generally dolomite, kaolin (Nandi et al. Reference Nandi, Uppaluri and Purkait2008; Harabi et al. Reference Harabi, Guechi and Condom2012; Belibi et al. Reference Belibi, Nguemtchouin, Rivallin, Ndi Nsami, Sieliechi, Cerneaux, Ngassoum and Cretin2015; Hubadillah et al. Reference Hubadillah, Othman, Matsuura, Rahman, Harun, Jaafar and Nomura2018), phosphate (Palacio et al. Reference Palacio, Bouzerdi, Ouammou, Albizane and Bennazha2009; Barrouk et al. Reference Barrouk, Alami, Kabbabi, Persin, Albizane and Tahiri2015), zirconia, spinel, cordierite, alumina, mullite (Levänen and Mäntylä Reference Levänen and Mäntylä2002; Almandoz et al. Reference Almandoz, Marchese, Prádanos, Palacio and Hernández2004; Dong et al. Reference Dong, Feng, Dong, Wang, Yang, Gao, Liu and Meng2007; Abbasi et al. Reference Abbasi, Mirfendereski, Nikbakht, Golshenas and Mohammadi2010; Zhou et al. Reference Zhou, Dong, Hampshire and Meng2011; Bouzerara et al. Reference Bouzerara, Harabi, Ghouil, Medjemem, Boudaira and Condom2012; Khattab et al. Reference Khattab, Wahsh and Khalil2012; Li et al. Reference Li, Wang and Zhou2013; Misrar et al. Reference Misrar, Loutou, Saadi, Mansori, Waqif and Favotto2017; Alghamdi et al. Reference Alghamdi, Dakhane, Alum, Abbaszadegan, Mobasher and Neithalath2018), graphite, and apatite powder (Nagai and Nishino Reference Nagai and Nishino1988; Joschek et al. Reference Joschek, Nies, Krotz and Göpferich2000; Ebadzadeh et al. Reference Ebadzadeh, Behnamghader and Nemati2011; Saffaj et al. Reference Saffaj, El Baraka, Mamouni, Zgou, Laknifli, Younssi, Darmane, Aboulkacem and Mokhtari2013). Organic materials which are used as porogens include starch from cassava, corn or wheat (Yang and Tsai Reference Yang and Tsai2008; Gregorová et al. Reference Gregorová, Živcová and Pabst2009; Li et al. Reference Li, Wang and Zhou2013; Gong et al. Reference Gong, Wang, Cheng, Zhang and Zhang2014; Norhayati et al. Reference Norhayati, Maisarah, Muhd, Nurhanna and Ahmad2014; Elomari et al. Reference Elomari, Achiou, Karim, Ouammou, Albizane, Bennazha, Alami and Elamrani2017, Mouafon et al. Reference Mouafon, Njoya, Hajjaji, Njoya, Lecomte-Nana and Njopwouo2020), rice husk (Belibi et al. Reference Belibi, Cerneaux, Rivallin, Ngassoum and Cretin2014), and other materials. Pore-forming agents are used to produce porous ceramic membranes with controlled microstructure (porosity and pore size). During heating to the final firing temperature of the ceramics, these pore-forming agents are burnt out at ~300–600°C, leaving void pores in the ceramic membranes (Zivcova et al. Reference Zivcova, Gregorová, Pabst, Smith, Michot and Poulier2009). Wheat and corn starch used in the production of ceramic membranes, respectively, by Li et al. (Reference Li, Wang and Zhou2013) and Gong et al. (Reference Gong, Wang, Cheng, Zhang and Zhang2014), have contributed to the production of highly porous ceramics with apparent porosity of between 68 and 86%; while Yang and Tsai (Reference Yang and Tsai2008) and Norhayati et al. (Reference Norhayati, Maisarah, Muhd, Nurhanna and Ahmad2014) used corn starch as a pore-forming agent to obtain ceramics with porosities of <44%. Porosity values of 5.3–15.7% were achieved by Saffaj et al. (Reference Saffaj, El Baraka, Mamouni, Zgou, Laknifli, Younssi, Darmane, Aboulkacem and Mokhtari2013) by using bovine bone ash as a porogen during the production of a bioceramic-supported membrane. With these results, starch and bone ash were appropriate porogens for porous ceramics in general and membranes in particular. The effect of these materials in the as-obtained membrane porosity will depend on their proportion.
The current study aimed to produce and characterize low-thermal conductivity ceramic membranes for micro- and ultrafiltration by using local clays, cassava starch, and bovine bone ash. The filtered water had to be free of any particles and potable. At the laboratory step, many membrane-filtration tests presented only physical analyses of wastewater and clean water. For example, only the following physical properties of water (turbidity, pH, conductivity, absorbance, total suspended solid, total dissolved solid, chemical oxygen demand, and total organic carbon) were presented by Abbasi et al. (Reference Abbasi, Mirfendereski, Nikbakht, Golshenas and Mohammadi2010), Barrouk et al. (Reference Barrouk, Alami, Kabbabi, Persin, Albizane and Tahiri2015), Achiou et al. (Reference Achiou, Elomari, Ouammou, Albizane, Bennazha, Younssi, El Amrani and Aaddane2016), and Mouiya et al. (Reference Mouiya, Bouazizi, Abourriche, Benhammou, Smith and Hannache2019) before and after filtration. Despite the absence of the microbiological properties for those water samples, other options to predict the elimination of microorganisms during filtration were not explored. The present study had a dual interest: (1) to determine the physical properties of polluted and filtered water; and (2) to predict the elimination of many microorganisms under the same experimental conditions. This prediction was based on particle-size distribution analysis and on the deduction of the maximum size of microorganisms which can pass through the membrane pores. The method used in this work was practical in an environment lacking laboratory equipment and where microbiological analysis of water is too onerous.
Materials and Methods
Raw Materials
The initial raw materials used to prepare micro/ultrafiltration ceramic membranes were clays (MY3 and KG), cassava starch (AM), and bovine bone (OB) collected from western Cameroon.
MY3 is mostly rich in SiO2 (58.44%), Al2O3 (35.31%), and TiO2 (2.05%). Analysis by X-ray diffraction (XRD) analysis indicated the presence of kaolinite, illite, goethite, anatase, and quartz (Mouafon et al. Reference Mouafon, Njoya, Hajjaji, Njoya, Lecomte-Nana and Njopwouo2020).
The major-element chemical composition of KG is SiO2 (59.48%), Al2O3 (22.26%), Fe2O3 (3.44%), and TiO2 (1.56%). Mineralogically, KG consists of quartz, kaolinite, montmorillonite, rutile, and goethite (Mouafon et al. Reference Mouafon, Njoya, Hajjaji, Njoya, Lecomte-Nana and Njopwouo2020).
Bovine bones were collected from butcher shops, cleaned, dried, crushed, burned at 700°C for 2 h, and crushed and sieved to <125 μm. CaO (51.96%) and P2O5 (39.20%) are the main oxides present in bovine bone ash and hydroxylapatite is the main phase in OB (Mouafon et al. Reference Mouafon, Njoya, Hajjaji, Njoya, Lecomte-Nana and Njopwouo2020).
The cassava was dried, crushed, and sieved to <125 μm. Fourier-transform infrared spectroscopic (FTIR) analysis of AM showed that it consisted of C, H, and O (Mouafon et al. Reference Mouafon, Njoya, Hajjaji, Njoya, Lecomte-Nana and Njopwouo2020). MY3 was used as the main material, with KG used as a plasticizer and binder, and AM and OB were used as pore-forming agents. All of the materials used are abundant in Cameroon and no specific value or re-use value is given to them.
Additional analysis of these materials included Brunauer-Emmett-Teller (BET: Brunauer et al. Reference Brunauer, Emmett and Teller1938) specific surface area and thermodilatometric analysis. The BET specific surface area determinations were carried out using a 3Flex adsorption analyzer (Micromeritics, Norcross, Georgia, USA). OB, MY3, and KG powder were degassed at 200°C for 10 h and AM powder at 100°C for 10 h before analysis. Thermodilatometric analyses of MY3 and KG were carried out using a dried cylindrical powder compact (8 mm in diameter and with a height of ~10 mm). The analysis was performed using a SETSYS Evolution TMA 3 instrument (SETERAM Instrumentation, Caluire, France), at 1400°C with a heating rate of 5°C/min.
Preparation of Membranes
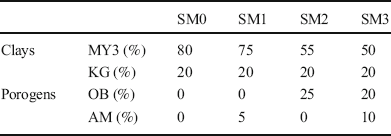
Green membranes were produced by mixing clays (MY3A and KG) and porogens (OB and AM). Up to 30 mass% porogens were included (Table 1). Unidirectional pressing with a Specac hydraulic press (Eurolabo, Paris, France) was used to shape cylindrical ceramic membrane samples at a compacting pressure of ~12 MPa. The samples obtained were oven-dried at 105°C for 24 h after exposure to laboratory room temperature for 15 days, and then sintered at 1150°C for 2 h in an oven (Nabertherm GmbH, Lilienthal, Germany). Thermal cycling was performed as follows: 2°C/min from room temperature to 700°C and 5°C/min from 700°C to 1150°C and held for 2 h.
Various formulations for membranes

Membrane Characterization
Mineralogical and microstructural analysis.
The mineralogical composition of sintered ceramics was determined by XRD analysis: acquisition time of 52 min on a Bruker AXS D8 Advance (Bruker, Karlsruhe, Germany) in a Bragg-Brentano system, theta/theta goniometer, equipped with a copper anode (CuKα = 1.5406 Å), operating at 40 kV and 40 mA, and a linear detector LYNXEYE XE T.
The mineralogical mass balance of various samples was calculated using the method developed by Njopwouo from the formula (Eq. 1) of Yvon (Njoya et al. Reference Njoya, Nkoumbou, Grosbois, Njopwouo and Njoya2006). Those authors considered the results of qualitative mineralogy (XRD, FTIR, DSC-TG analyses) and chemical composition of the samples.

where T(a) is the wt.% of element a in the sample; M i, the wt.% of the mineral i in the sample; and P i(a), the wt.% of element a in mineral i.
The microstructure of the membranes was observed using scanning electron microscopy (SEM) in high-vacuum mode after coating with Pt for 30 s. An FEG LEO 1530 VP instrument (ZEISS, Oberkochen, Germany), with an accelerating voltage varying between 1 and 5 kV, was used.
Thermal behavior analysis.
Dilatometric measurements of mixed raw materials were carried out on a SETSYS Evolution TMA 3 instrument (SETERAM Instrumentation, Caluire, France). Green cylindrical, ceramic membrane samples, 8 mm in diameter and 11–14 mm long, were shaped by unidirectional pressing to perform this analysis. The samples obtained were analyzed at 1150°C for 2 h after heating rates of 2°C/min from 30 to 700°C and 5°C/min between 700 and 1150°C, respectively.
The thermal conductivity of the membranes was measured after drying and sintering. The test was carried out using a hot disk method (Hot Disk, Limoges, France). The disks used were made of 3.189 mm-radius Kapton. Each disk was placed between two cylindrical ceramic membranes, the radius and height of which were greater than double the radius of the disk. The acquisition time was 20 s and 200 points were registered for each analysis.
Physicochemical and mechanical characterization.
The BET specific surface area measurement was carried out using the 3Flex instrument (Micromeritics, Norcross, Georgia, USA). Degassing of membranes was carried out at 90°C for 0.5 h and at 200°C for 10 h before analysis.
The three-point bending test of the membranes was performed by using an EZ20 universal testing machine (Lloyd instruments – Ametek, Bognor Regis, UK). Sample dimensions were ~10 mm×10 mm×50 mm and the crosshead speed was 1 mm/min.
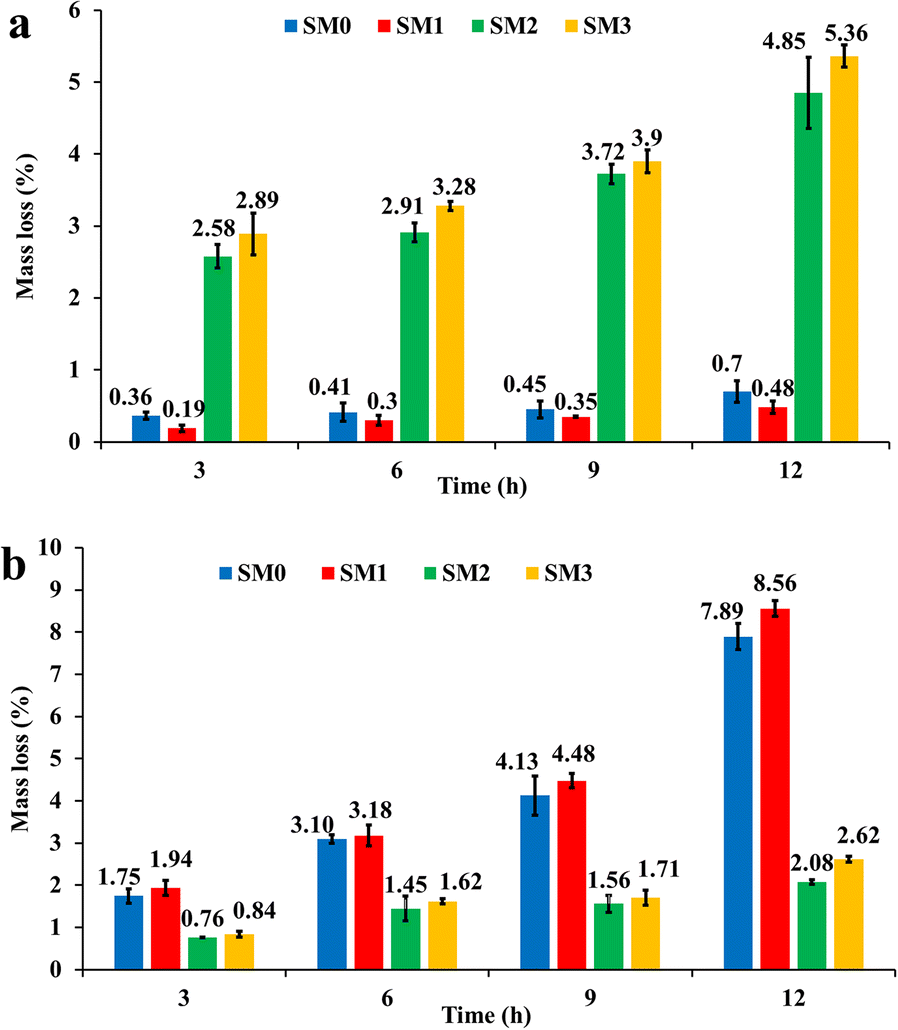
Corrosion testing was carried out to evaluate the ability of membranes to resist strong acid and basic media: aqueous solutions of sulfuric acid (0.02 M, pH = 1.68) and sodium hydroxide (0.17 M, pH = 13.24) were used. Five pieces of membrane with masses of between 0.5 and 1 g were immersed in ~200 mL of solution. The reactions were carried out at ~100°C for 3, 6, 9, and 12 h. At the end, samples removed from acid and base solutions were placed in distilled water for 5 min, then cleaned in an ultrasonic bath for 10 min, and dried at 100°C for 72 h. The degree of corrosion was determined by the percentage of weight loss.
The open pore volume fraction was measured by Archimedes’ method. This method involves triple weighing of sample mass. The first mass (M1) is direct weighing after drying the sample at 100°C for at least 24 h. M2 is the mass of sample completely immersed in distilled water after high-vacuum water absorption for at least 1 h. M3 is the mass of the sample with absorbed water. The open porosity volume proportion was calculated using Eq. 2:

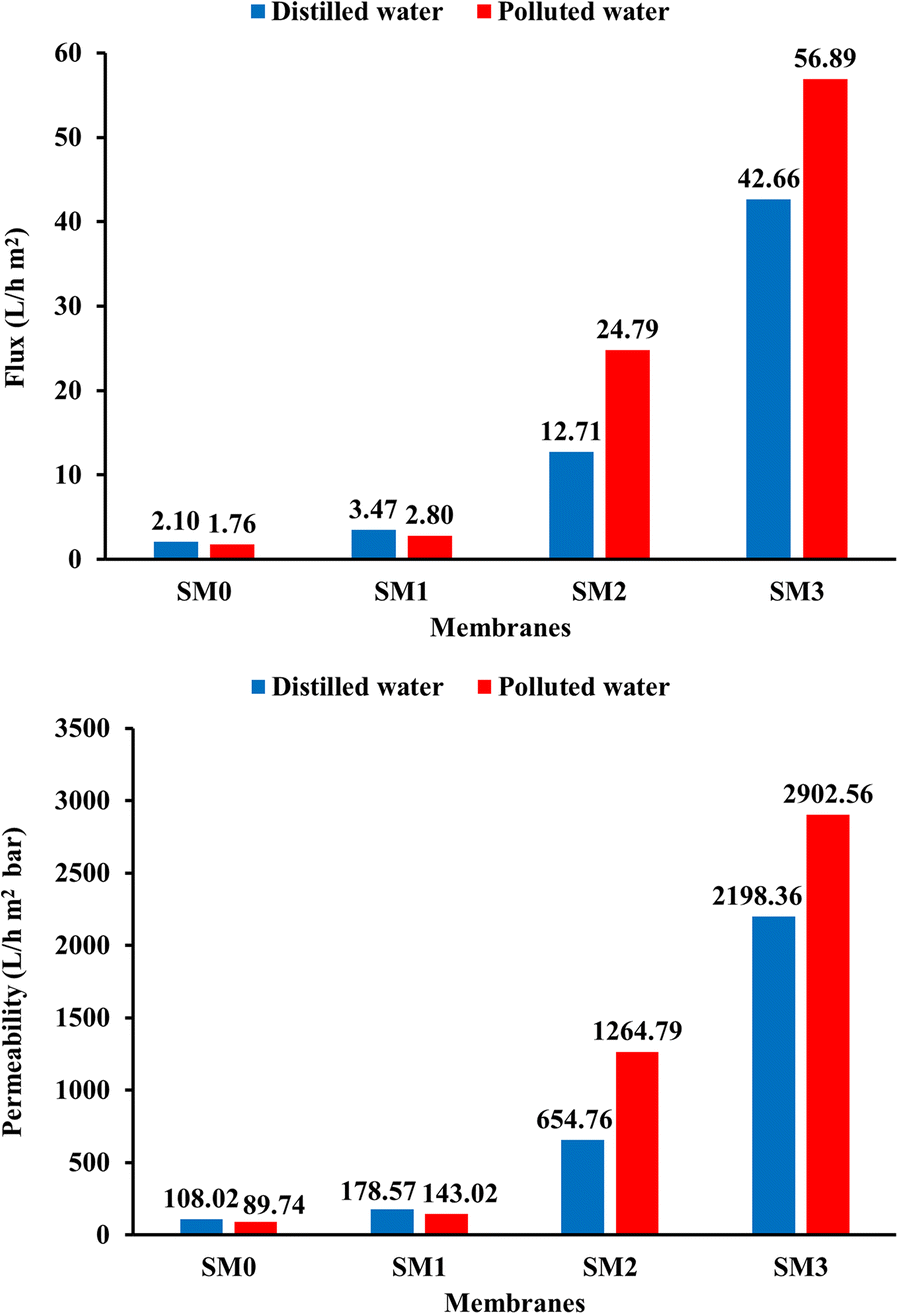
The description of the flow in porous media was done by measuring permeability and flux. These parameters were measured by filtration of distilled and polluted water at room temperature and atmospheric pressure. Transmembrane pressure (ΔP) depends on the quantity of water (h) and gravity action (g), however (Eq. 3). Permeability (Lp) was given by Eq. 4 and is related to water flux (J) (Eq. 5).


v is the filtered volume, s is the surface of the active ceramic membranes area, and t is the filtration time.
Application to nanoparticle retention: filtration test.
Filtration tests were carried out on ceramic membranes with a surface area of 3032 mm2 and a thickness of 6.5 mm. Before starting the test, membranes were cleaned and then immersed in distilled water for 24 h in order to facilitate water flow. This test was done with polluted water synthesized in the laboratory. Its properties were near those of surface water and well water. Polluted water was obtained by mixing tap water with humic substance (10 mg/L), bentonite (50 mg/L), and hydrochloric acid (37%, 0.15 mL (HCl)/L (H2O)). The mixture was then agitated mechanically in order to dissolve the maximum humic and clay particles. Filtration was achieved without application of external force other than gravity. Turbidity, pH, electrical conductivity, redox potential, and particle-size distribution in water were parameters used to evaluate membrane performance. Particle-size distribution in polluted and filtered water was obtained using a Partica LA 950 laser diffraction granulometer (Horiba, Kyoto, Japan) and Zetasizer apparatus (Malvern Panalytical, Malvern, UK), respectively. The limits of detection of laser diffraction granulometers are between 0.2 μm and 2000 μm, while that of the Zetasizer is between 0.2 nm and 10 μm. The Zetasizer apparatus can detect particle sizes close to those of natural and synthetic colloids, minerals (clays, oxides), organics (humic acids, nanopolymers), and biological (virus) nanoparticles in suspension.
RESULTS AND DISCUSSION
Characterization of Raw Materials
The BET specific surface area results showed that the less reactive materials were AM (0.24 m2g–1) and OB (1.89 m2g–1), and the most reactive was KG (39.65 m2g–1). The specific surface area of MY3 is 18.77 m2g–1 – this large value was due to the presence of montmorillonite (phyllite 2:1).
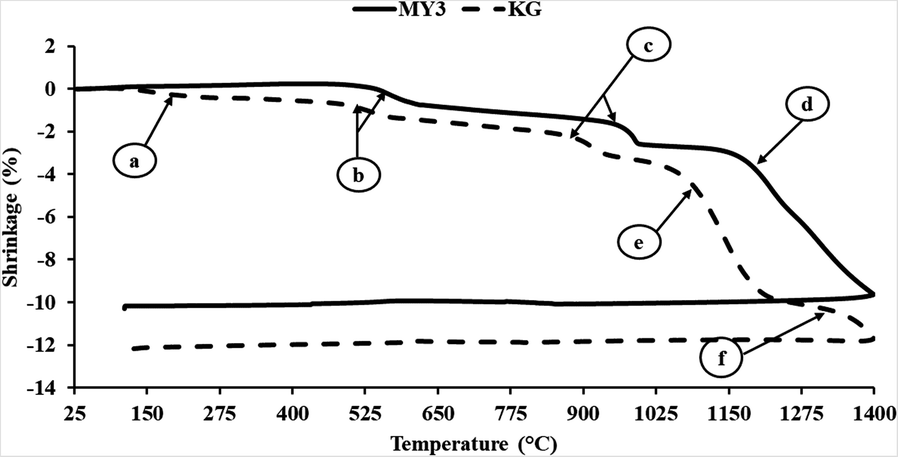
The thermodilatometric behavior of MY3 and KG (Fig. 1) showed many reactions and transformations and highlighted the temperature of densification of the materials. Reactions and transformations are labeled a to f. The first small shrinkage (a) observed at between 130 and 400°C characterized the dehydration and combustion of organic phases within the starting KG. The α–β quartz transformation and dehydroxylation of kaolinite occurred from 480 to 700°C (b) for MY3 and KG. Structural reorganization of metakaolinite into mullite was characterized by a minor shrinkage at between 900 and 1020°C for MY3, and from 875 to 975°C for KG (c). The speed of densification was slower for MY3 than for KG (d, e). KG densification started earlier than that of MY3 and was hindered from 1220°C (f). At 1150°C, the densest material was KG with a size reduction of ~7.50%. This greater and quicker densification justified its use as a binder in the elaboration of ceramic membranes.
Dilatometric curves of MY3 and KG

The mineralogical reconstitution was achieved using Eq. 1 and the scheme is as follows:
• TiO2 was used for anatase TiO2;
• Fe2O3 was used for goethite FeO(OH);
• K2O was used for illite K1.3(Si3Al)O10Al1.7Mg0.3(OH)2;
• The proportion of montmorillonite was calculated using Na2O;
• Reconstitution of Al2O3 after montmorillonite (for KG) or illite (for MY3) was used for kaolinite Si2Al2O5(OH)4 (for MY3 and KG);
• Reconstitution of SiO2 after kaolinite and illite or montmorillonite was converted as quartz SiO2.
The large proportion of kaolinite (75.6%) in MY3 (Table 2) showed that it was kaolinitic clay. The presence of at least 10.4% of montmorillonite in KG confirmed the BET specific surface area result and the plastic character of the clay. Goethite and anatase represent ~5.4% of KG, which means that this clay was less refractory than MY3 which was made up of 4% goethite and anatase (Pountouenchi et al. Reference Pountouenchi, Njoya, Njoya, Rabibisao, Mache, Yongue, Njopwouo, Fagel, Pilate and Van Parys2018).
Estimated mineralogical composition (%) of MY3 and KG

Membrane Properties
Mineralogy and microstructure.
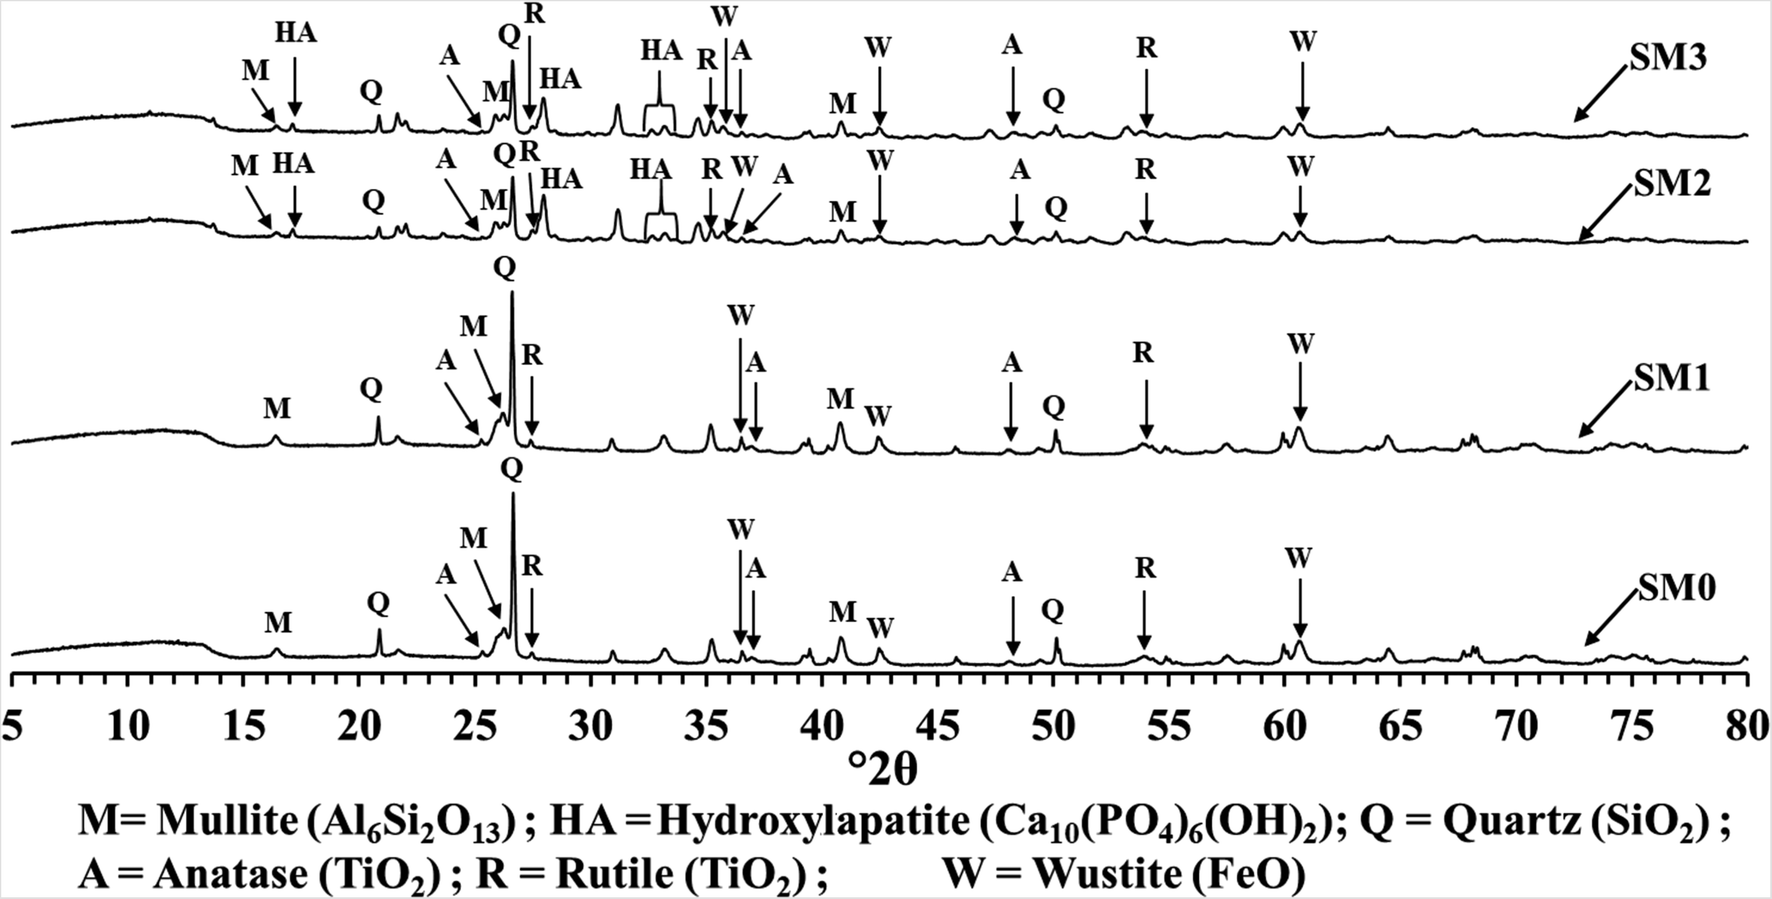
The results of mineralogical analysis of the prepared ceramic membranes (Fig. 2) showed that they comprised generally quartz (SiO2), mullite (Al6Si2O13), anatase (TiO2), rutile (TiO2), and wustite (FeO). In addition, hydroxylapatite (Ca10(PO4)6(OH)2) was present in samples prepared with bovine bone ash (SM2, SM3).
XRD patterns of various membranes

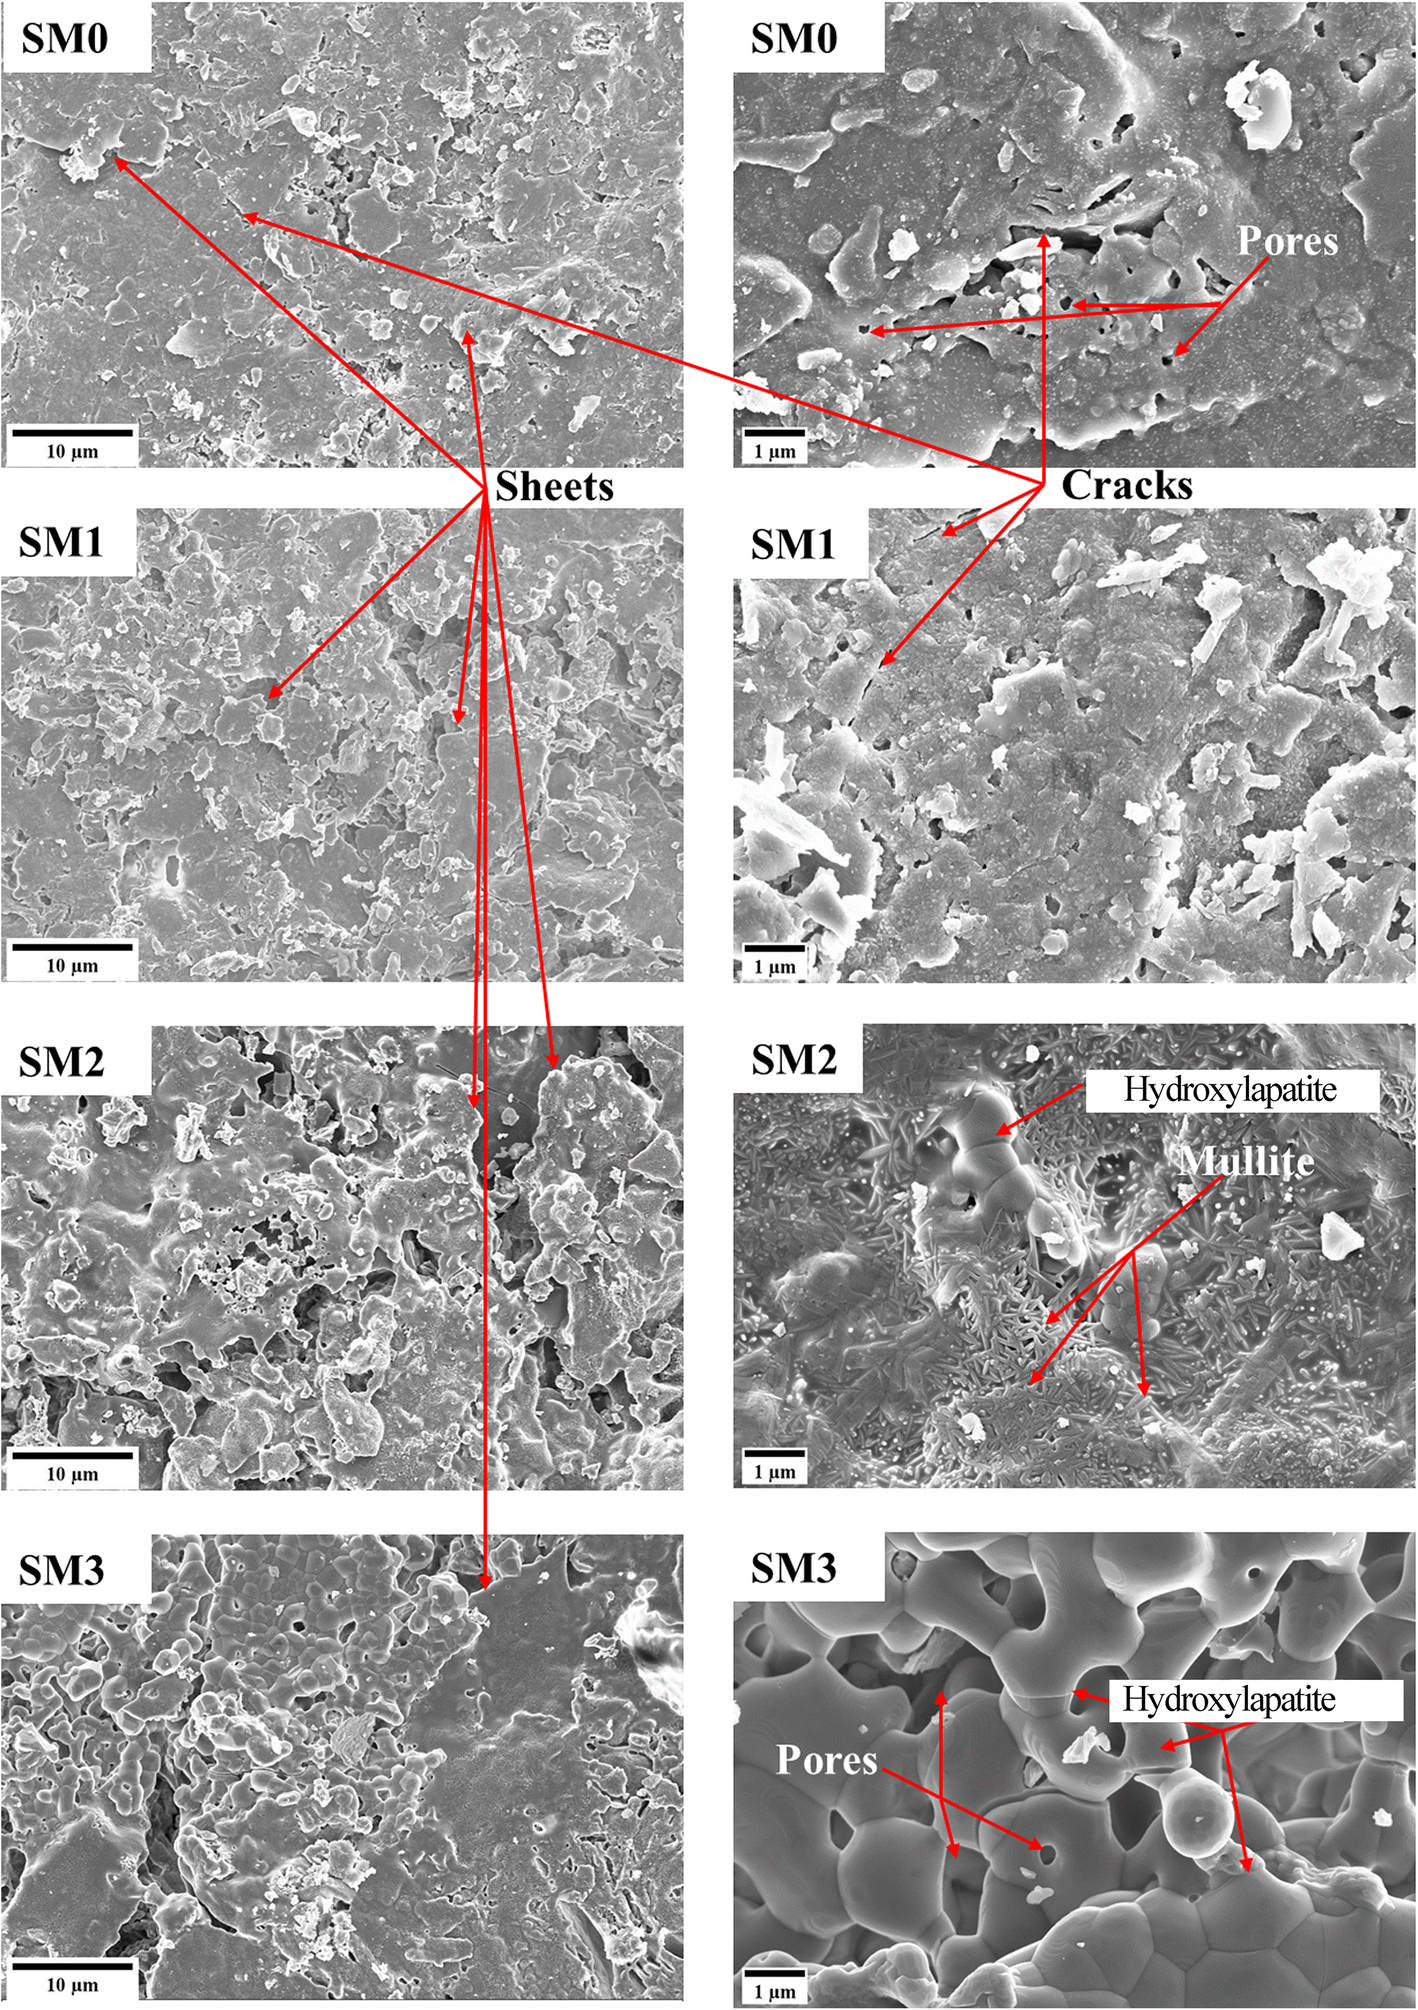
The effects of bovine bone ash and cassava starch on the surface microstructure were evaluated by SEM. Membrane morphologies (Fig. 3) varied in function with type of porogen. SEM images of SM0 and SM1 revealed that they had similar structures. These structures were characterized by multiform sheets and pores. An SM1 image showed more surface pores than an SM0 one. Consequently, the SM0 structure seemed to be more consolidated than SM1. Unlike these membranes, SEM images of SM2 and SM3 showed more consolidated and porous structures. SM3 seemed more porous than SM2. The presence of starch in SM3 could explain this result. Micrographs of SM1 and SM3 revealed that starch membranes were more porous and less consolidated than reference (SM0) and hydroxylapatite (SM2) membranes. The hydroxylapatite membrane seemed stronger and more porous than the reference. If this observation is confirmed by porosity and flexural strength results, it might be possible to confirm that, even though bovine bone ash was used as a porogen, it also acted as a binder during the sintering process. In general, starch and bone ash contributed to microstructure modification. The first weakened the ceramic’s structure by creating voluminous pores and weakly agglomerated particles, while the second acted simultaneously as both a porogen and a binder.
SEM images of various membranes

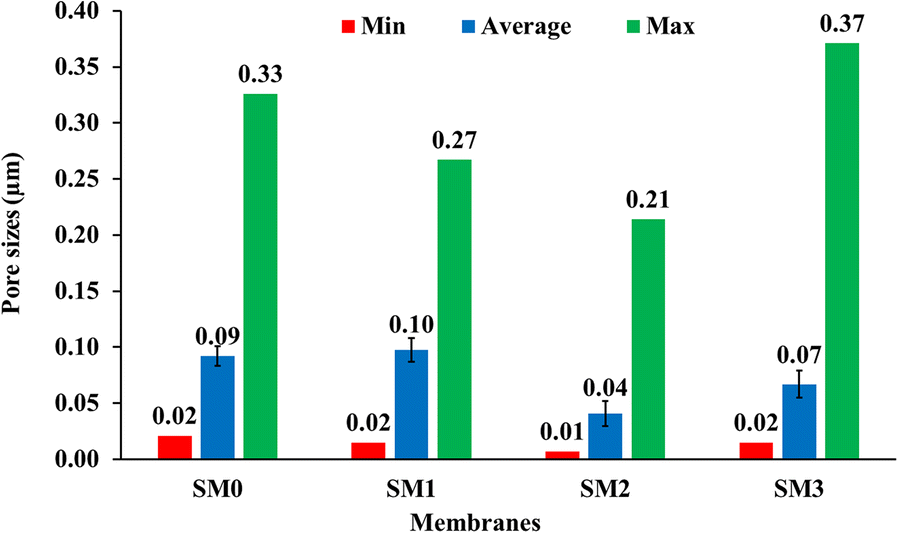
Pore-size distribution was evaluated on a polished surface from SEM images using ImageJ software; at least 200 pores were detected for each membrane. In general, the pore-size distribution of membranes was between 0.01 and 0.37 μm (Fig. 4). According to these results, membranes consisted of mesopores and macropores. The average pore size showed a predominance of macropores on membranes SM0, SM1, and SM3, and a predominance of mesopores on SM2. These membranes offered promise for use in tangential microfiltration and ultrafiltration (Bacchin Reference Bacchin2005). They should, therefore, be able to retain proteins, viruses, colloids, pigments, bacteria, some dissolved solid particles, and suspended particles >0.01 μm in size.
Pore-size distributions of membranes

Thermal behavior.
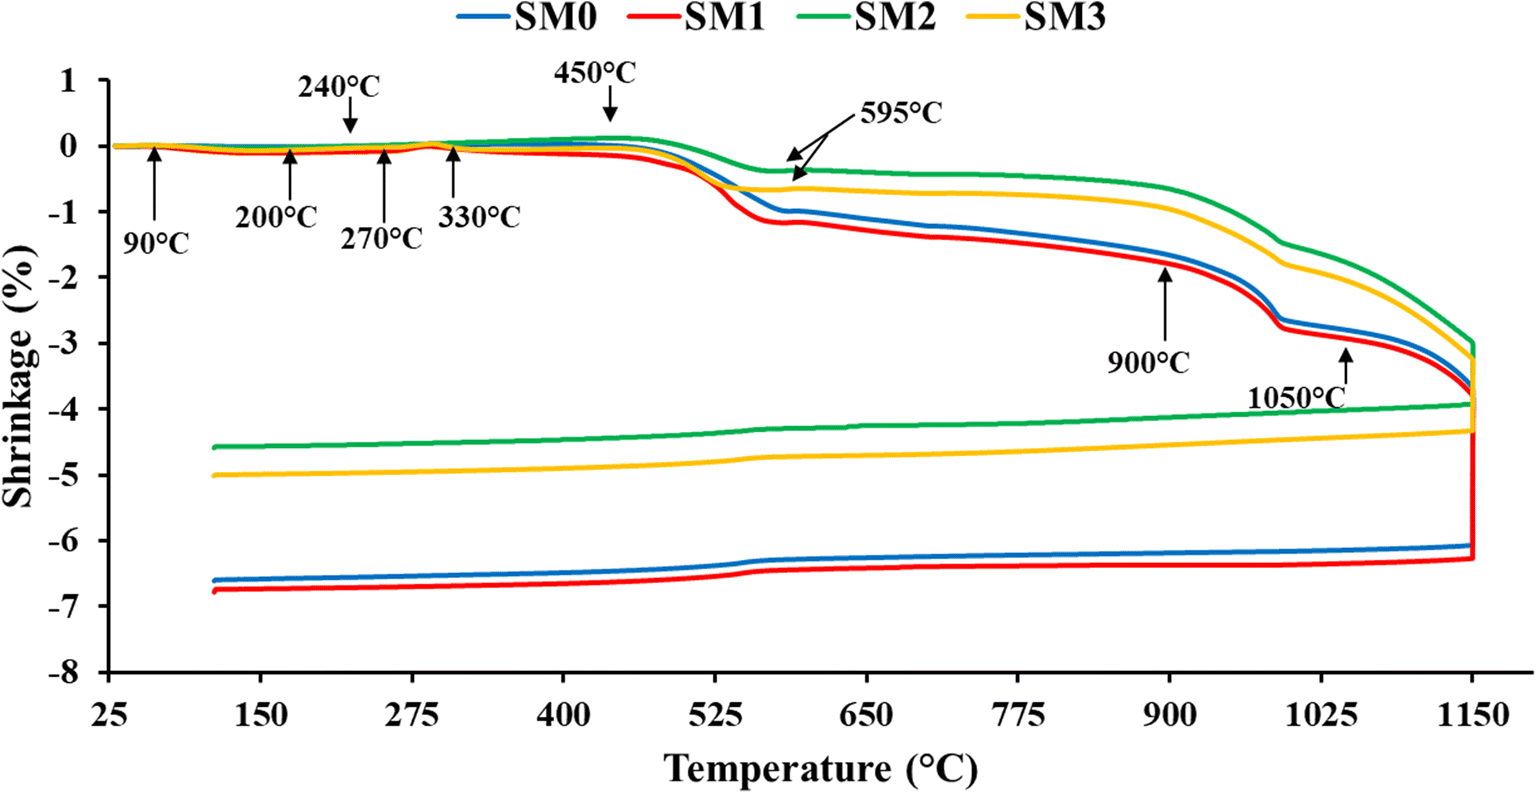
The results of thermodilatometric behavior analysis of various samples (Fig. 5) showed that porogens have an influence on the sintering process. In general, membranes SM2 and SM3 had linear shrinkages which were less than those of SM0 and SM1. These shrinkages were physical, due to the loss of mass during thermal treatment. SM1 and SM3 were characterized by a small shrinkage of ~0.01% between 90 and 200°C and a ~0.03% dilatation rate between the temperatures of 270 and 330°C (Fig. 5). Shrinkage was due to membrane dehydration while dilation was due to combustion of organic matter. The latter phenomenon led to pore creation. SM0 and SM2 showed no evidence of dehydration, but dilation of ~0.12% occurred at temperatures between 240 and 450°C (Fig. 5). From 450 to 595°C, dehydroxylation of kaolinite to metakaolinite was characterized by a small shrinkage of 1% for SM0 and SM1, 0.5% for SM2, and 0.7% for SM3. Structural reorganization of metakaolinite into mullite, amorphous silica, or spinel occurred at between 900 and 1050°C with 1.15% shrinkage for SM0 and SM1. This phenomenon was accompanied by dehydroxylation of hydroxylapatite and the densification of SM2 and SM3 from 880 to 1150°C. Dilatometric analysis revealed a total shrinkage of ~6.07% for SM0, 6.27% for SM1, 3.92% for SM2, and 4.33% for SM3 after a 2 h sintering stage at 1150°C.
Dilatometric curves of various membranes

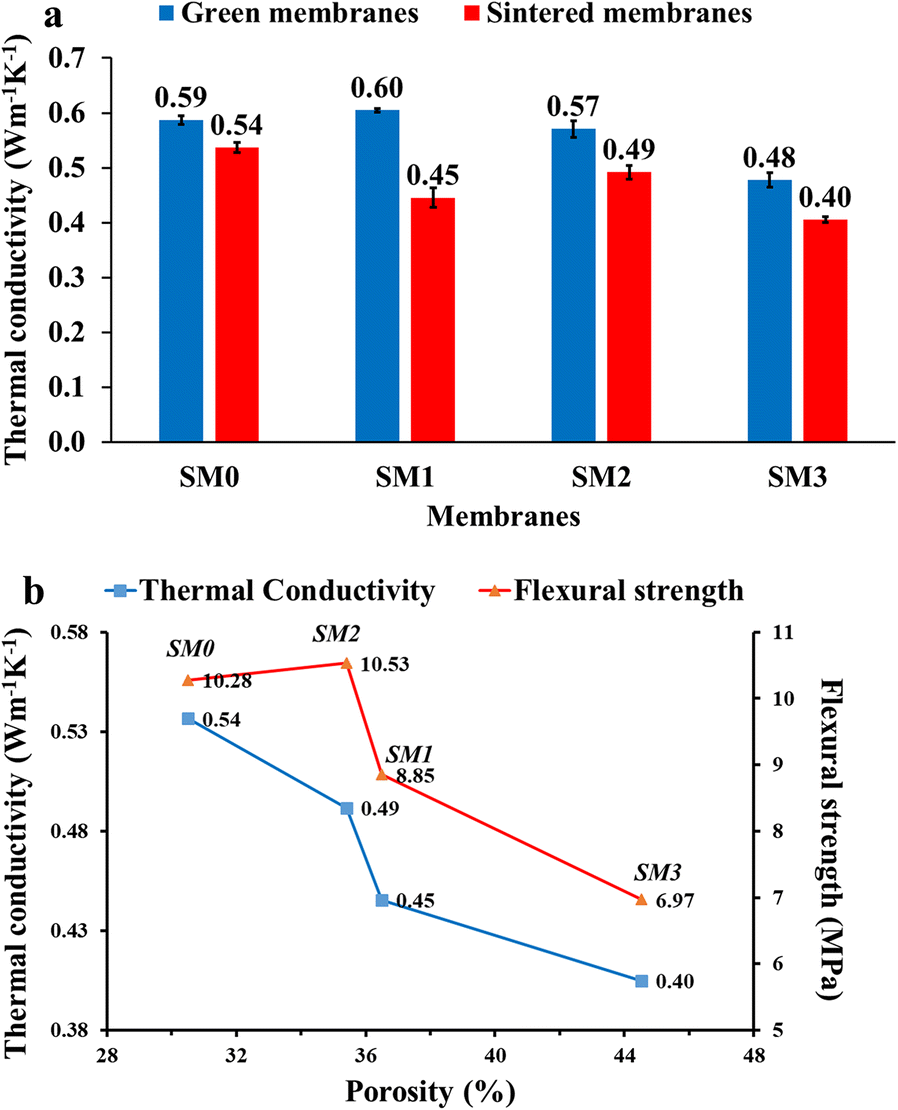
Thermal conductivity was measured on green (after drying) and sintered ceramic membranes. The results obtained showed that those products were characterized by a low thermal conductivity (Fig. 6). In general, the thermal conductivity values of sintered membranes were slightly less than those of green ones. In fact, green membrane and sintered membrane conductivities were between 0.48–0.59 Wm–1K–1 and 0.40–0.54 Wm–1K–1, respectively (Fig. 6). These values were smaller than those obtained by Barea et al. (Reference Barea, Osendi, Ferreira and Miranzo2005) (0.91–1.10 Wm–1K–1) and Nigay et al. (Reference Nigay, Cutard and Nzihou2017) (0.65–1.00 Wm–1K–1). Membranes produced without a pore-forming agent (SM0) had greater thermal conductivity (0.54 Wm–1K–1) than others. Membranes produced with starch as a pore-forming agent (SM1 and SM3) were less conductive (0.45–0.40 Wm–1K–1) than those produced with only bovine bone ash (SM2) (0.49 Wm–1K–1). The thermal conductivity was influenced, therefore, by the type of porogen employed. These low conductivities were an advantage because they confirmed that membranes could be used in a warm environment (such as the tropics) with little risk of burning.
a, b Thermal conductivity and b flexural strength as a function of open porosity

Physicochemical and mechanical properties.
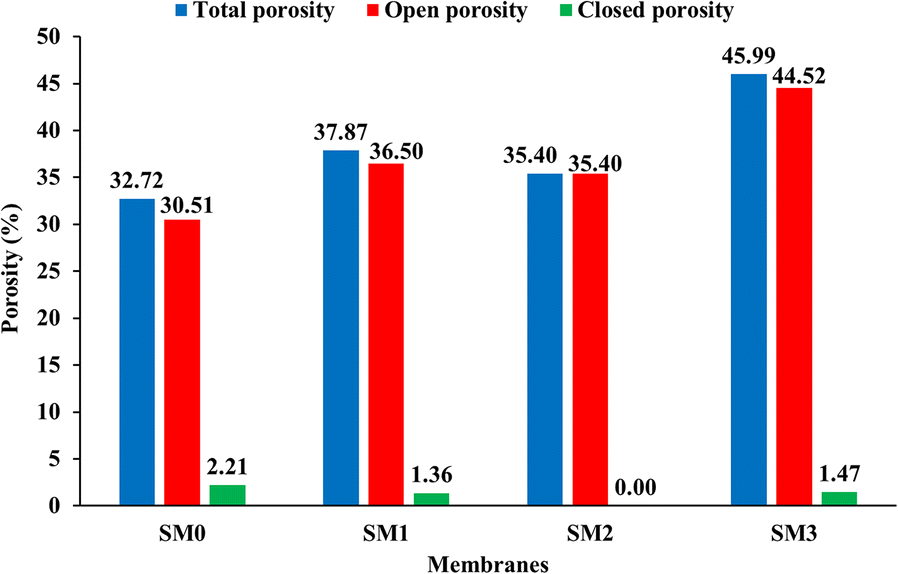
The BET specific surface areas of various membranes were small (from 0.92 to 1.64 m2g–1), despite their large porosity values (Fig. 7). The smallest pore distribution on membrane surfaces explained these small values of specific surface area. If the surface pore size was small, gas infiltration became difficult and the active area was reduced. Consequently, internal pores were not reachable easily by nitrogen, and dissolved or suspended particles in water would have difficulty crossing those membranes. The BET specific surface areas of membranes increased with average pore size. In fact, SM2 and SM3, which had the smallest average pore size (0.04 and 0.07 μm, respectively), were characterized by small BET specific surface areas (0.92 and 1.21 m2g–1, respectively) compared to SM0 and SM1 (0.09 and 0.10 μm, respectively) and BET specific surface areas (1.64 and 1.58 m2g–1, respectively). Bovine bone ash contributed to a small reduction in active area despite its ability to create pores. The BET specific surface area was influenced, therefore, by porogens as much as by thermal conductivity. The mixture of starch and bone ash in the membrane formulation (SM3) led to the increase in BET surface area compared to that for SM2.
Membrane porosities

Membrane porosities were obtained by Archimede’s method. In general, the results (Fig. 7) showed that membrane porosity varied with the function of porogens. The small pore volume fraction of SM0 (32.72%) was due to the absence of porogens. Membrane SM2 which contained only OB (25%) as a porogenic agent was less porous than SM1 which was produced using 5% of starch. This result showed that starch created more pores than bovine bone ash. The porosity of SM3 (46%, the largest) was achieved by incorporating 10% of AM during mixing. This starch had contributed to pore formation during its combustion through emission of a large quantity of CO2. The smallest values for membrane closed porosities (<2%) showed that pores were interconnected and so liquid or gas would circulate easily and rapidly (Fig. 7). This interconnection was beneficial for water filtration and predicted high membrane permeability. The porosities of various membranes were inversely proportional to thermal conductivity (Fig. 6). This correlation confirmed the impact of porogens on thermal conductivity. This result was similar to those obtained by Barea et al. (Reference Barea, Osendi, Ferreira and Miranzo2005), Zivcova et al. (Reference Zivcova, Gregorová, Pabst, Smith, Michot and Poulier2009), Gong et al. (Reference Gong, Wang, Cheng, Zhang and Zhang2014), and Xu et al. (Reference Xu, Jia and Gong2018). The results obtained by those authors showed that a membrane with high porosity is characterized by low conductivity (Barea et al. Reference Barea, Osendi, Ferreira and Miranzo2005; Zivcova et al. Reference Zivcova, Gregorová, Pabst, Smith, Michot and Poulier2009; Gong et al. Reference Gong, Wang, Cheng, Zhang and Zhang2014; Xu et al. Reference Xu, Jia and Gong2018).
The flexural strength value obtained by the three-points bending test increased when pore volume fraction decreased (and with increased proportion of porogens) (Fig. 6). The flexural strength and thermal conductivity of starch and hydroxylapatite membranes behaved in the same way toward porosity. The most resistant membrane (SM2, 10.53 MPa) was characterized by a relatively high thermal conductivity (0.49 Wm–1K–1), and the less resistant one (SM3, 6.97 MPa) was less conductive (0.40 Wm–1K–1) (Fig. 6). The strength of a ceramic membrane decreases with the presence of defects, such as pores, which act as stress concentrators (Norhayati et al. Reference Norhayati, Maisarah, Muhd, Nurhanna and Ahmad2014). The presence of various pore types and cracks, as shown in Fig. 3, may reduce the flexural strength of membranes. According to porosity values (Fig. 6), the flexural strength of SM0 should be much greater than that of SM2. The high flexural strength of SM2 was probably due to the binding characteristics of bovine bone at high temperature. The study conducted by Norhayati et al. (Reference Norhayati, Maisarah, Muhd, Nurhanna and Ahmad2014) showed that the flexural strength of ceramic membranes with a porosity >30% is <10 MPa. Values for mechanical resistance, obtained by Nandi et al. (Reference Nandi, Uppaluri and Purkait2008), were from 3 to 8 MPa for membranes with porosity between 33 and 42%. In the current study, flexural strength results (from 6.97 to 10.53 MPa) showed that the resistance of ceramic membranes depended on porogen type, as shown by the microstructure observed by SEM (Fig. 3). A large proportion of starch typically led to small flexural strength values (e.g. in the cases of SM1 and SM3).
Membrane exposure to acid and base attack revealed its ability to resist chemical corrosion at high temperature (Fig. 8). SM0 and SM1 were more resistant to acid attack while SM2 and SM3 were more resistant to base attack. These results showed that corrosion was due to an acid–base reaction with the membranes. In fact, in acid media the mass loss of hydroxylapatite membranes (SM2 and SM3) was greater than in basic media. SM2 and SM3, therefore, behaved as a base while SM0 and SM1 acted as acid (SiO2 is an acid oxide and Al2O3, an amphoteric oxide). In conclusion, SM0 and SM1 can be used for treatment of acidic water; SM2 and SM3 are useful for filtering basic water.
Mass loss of membranes in a H2SO4 (pH = 1.68) and b NaOH (pH = 13.24) at 100°C

In summary, these membranes exhibited good thermal and chemical stability, enough porosity to ensure liquid circulation, significant mechanical strength, and pore-size distributions favorable for retention of physicochemical and bacteriological pollutants. They were suitable for use in ultrafiltration and microfiltration because they contained both mesopores and the smallest macropores. Membrane efficacy as evaluated after wastewater filtration. Sufficient pore-size distribution, porosity, and mechanical-strength data were available, however, to confirm that the membranes can be used for ultra/microfiltration without a thin-layer coating.
Membrane permeability and flux.
According to the results from distilled-water filtration, the reference membrane (SM0) was less permeable (2.10 L/h·m2 bar for flux and 108.02 L/h·m2 bar for permeability) than others (Fig. 9). The greater value for SM3 permeability (2198.36 L/h·m2 bar) was in accord with its greater porosity. Even though the open porosities of SM1 and SM2 were almost equal, SM2 was more permeable (654.76 L/h·m2 bar) than SM1 (178.57 L/h·m2 bar). This difference may be related to pore interconnectivity. In fact, SM1 consisted of ~1.4% closed pores while SM2 had 0%. Water flow through SM2 occurred more readily than through SM1; consequently, SM2 permeability was greater than that of SM1. The permeability and flux of membranes obtained through polluted-water filtration confirmed that SM3 was more permeable (56.89 L/h·m2 bar for water flux) than others, followed by SM2 (24.79 L/h·m2 bar for water flux) (Fig. 9). SM2 and SM3 flux and permeability were greater for polluted water filtration (1264.79 and 2902.56 L/h·m2 bar, respectively) than during distilled water filtration (654.76 and 2198.36 L/h·m2 bar, respectively). Normally, membrane fouling, which occurs during filtration of polluted water, should reduce water flow and consequently water flux as was observed for SM0 (108.02 and 89.74 L/h·m2 bar, respectively, for distilled and polluted water) and SM1 (178.57 and 143.02 L/h·m2 bar, respectively, for distilled and polluted water). SM2 and SM3 water flows were influenced by factors other than water quality, possibly the variation in water temperature and atmospheric pressure. In general, these results showed that, apart from porosity, pore interconnectivity was an important characteristic which should be taken into consideration during water-flux analysis in porous media.
Membrane permeabilities and flux

Membrane Filtration Test
Nanoparticle retention.
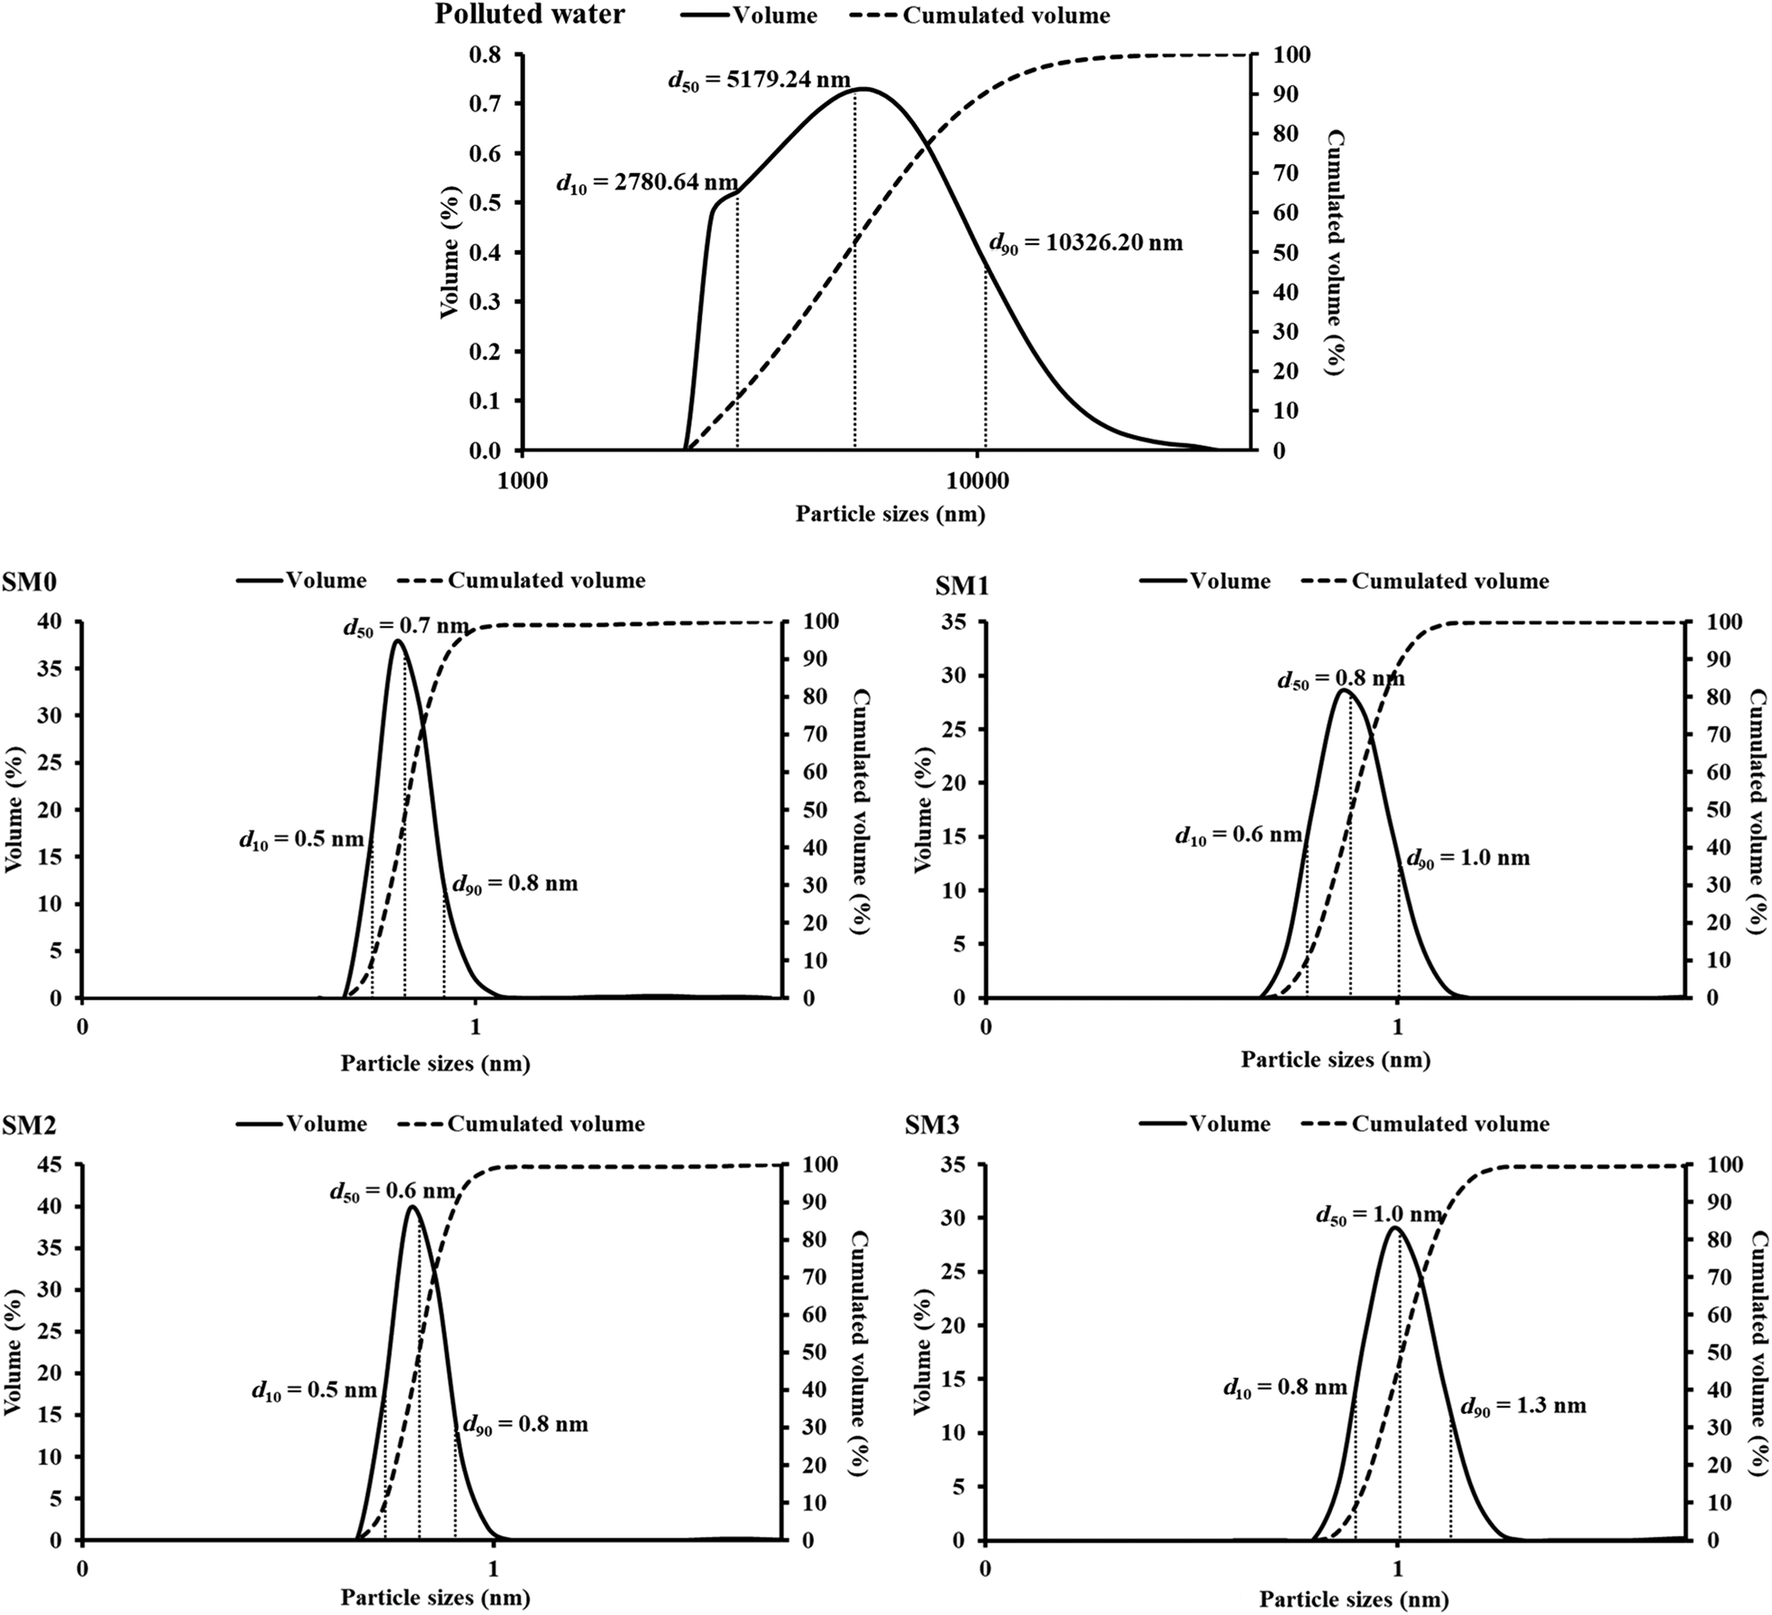
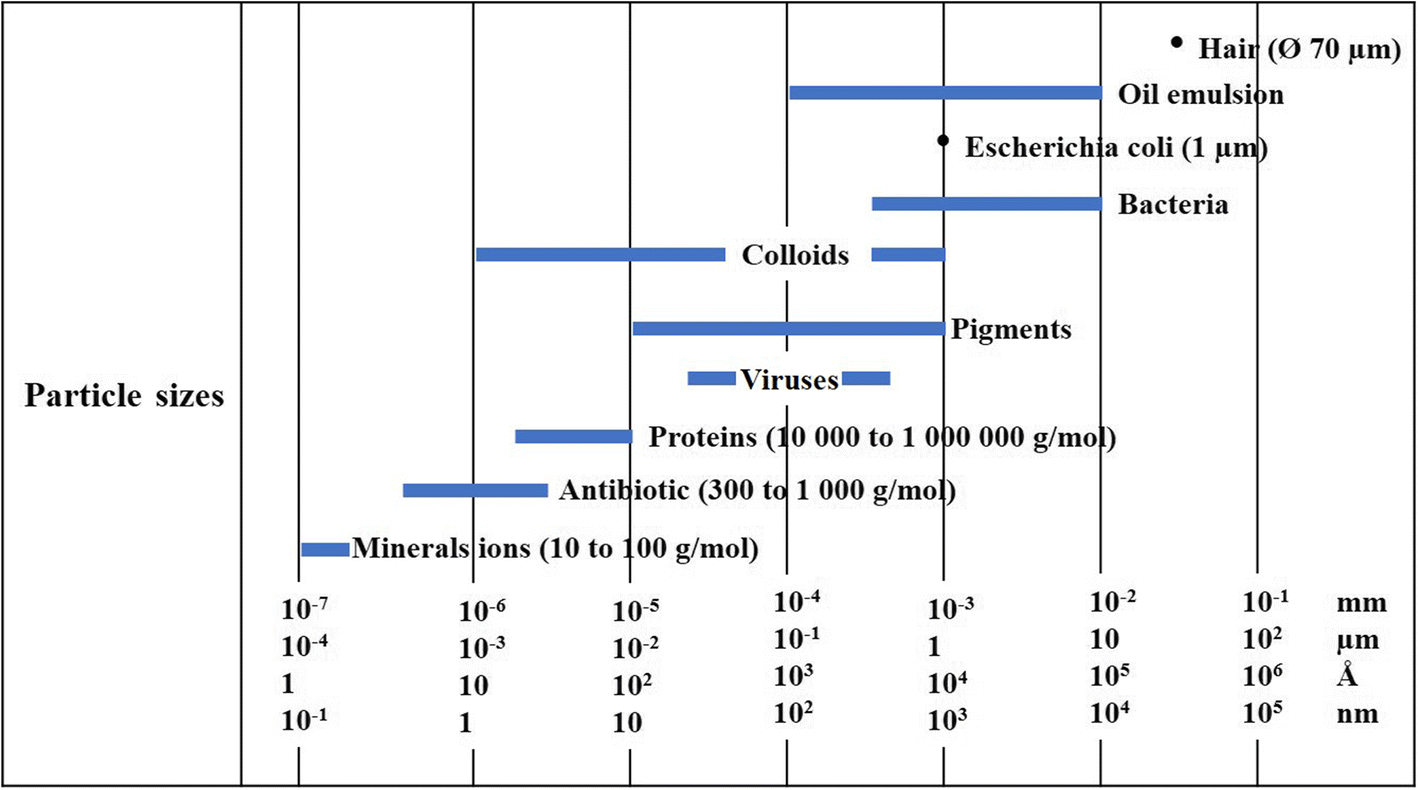
Measurements of particle-size distributions of particles removed from polluted and filtered waters revealed that polluted water contained particles between 1.15 and 39 μm in diameter (Fig. 10), while particle sizes in filtered water were nanometric in size (Fig. 10). In polluted water, 90% of the particles were <10,326 nm (10.33 μm). As particle-size distributions in filtered water were <2 nm (Fig. 10), several pollutants with smaller size were, therefore, retained during filtration. In general, 90% of particles contained in various filtered water samples are <1 nm. Analysis of SM0 and SM2 filtered waters showed particle-size distributions of <1 nm (Fig. 10). For these filtered waters, 90% of particles were <0.8 nm. SM1 and SM3 filtered waters were also characterized by the smallest particles (Fig. 10). Their size was <2 nm and d 90 was = 1 nm for SM1 filtered water and 1.3 nm for SM3 filtered water. Briefly, particle-size distribution analysis showed that waters filtered in different ways contained a majority of particles which were <1 nm in diameter. Any living or non-living organism >1 nm would be retained by membranes during filtration. This remained true, however, if no pressure was applied other than that due to gravitational force. Because of the size variation in various particles and microorganisms, these ceramic membranes were adapted to the elimination of viruses, pigments, proteins, colloids, bacteria, and heavy particles as their sizes were >1 nm (Fig. 11) (Bacchin Reference Bacchin2005). Filtered water obtained using these membranes could be consumed directly without any further disinfection, because viruses and colloids were eliminated directly during filtration.
Particle-size distribution in polluted and filtered waters

Sizes of various particles and microorganisms (Bacchin, Reference Bacchin2005)

Physical parameters of water.
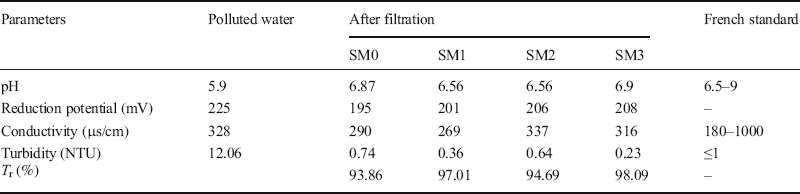
The physical parameters of water (Table 3) before and after filtration were compared with the French standard. Redox potentials were positive and near 200 mV. The filtered waters were well oxygenated and the rates of occurrence of nutriments or other particles were extremely small. The pH of water moved from 5.9 to ~7 (Table 3). This meant that the concentration of hydronium ions (H3O+) was reduced to a negligible value; water was thus neutralized during filtration. This neutralization could be due to an acid–base reaction between membranes composed of amphoteric and basic oxides (Al2O3 and CaO, respectively) and water which was slightly acidic. According to this hypothesis, H3O+ ions were not retained by membrane selectivity, but through a chemical reaction. By taking into consideration the greater corrosion resistance of membranes (Fig. 8) and the small acid content of the water (Table 3), it was possible to state that if membranes are cleaned regularly after filtration, this chemical reaction will not have a negative effect.
Physical properties of water

Water turbidity was reduced significantly by the filtration process. The turbidity (Tr) decreased from 93.86 (SM0) to 98.09% (SM3). SM1 and SM2 decreased it by 97.01 and 94.69%, respectively (Table 3). These decreases were consequently related to turbidity values (<0.65 NTU) which were below that required by the French standard (1 NTU). Consequently, the concentrations of colloids and suspended particles in the filtered waters were less than those of polluted water. In spite of the greater porosity value of SM3, the turbidity of its filtered water (0.23 NTU) was less than that of other membranes (Table 3). In general, turbidity increased while porosity decreased. Membrane selectivity, therefore, was not related to porosity. Selectivity could be influenced by transmembrane pressure and pore-size distribution.
By comparing these physical parameters of water with the French standard, the pH, conductivity, and turbidity of the present filtered waters appear to satisfy the requirement of this law. These waters could be consumed directly, without risk.
Thermal Recycling of Membranes
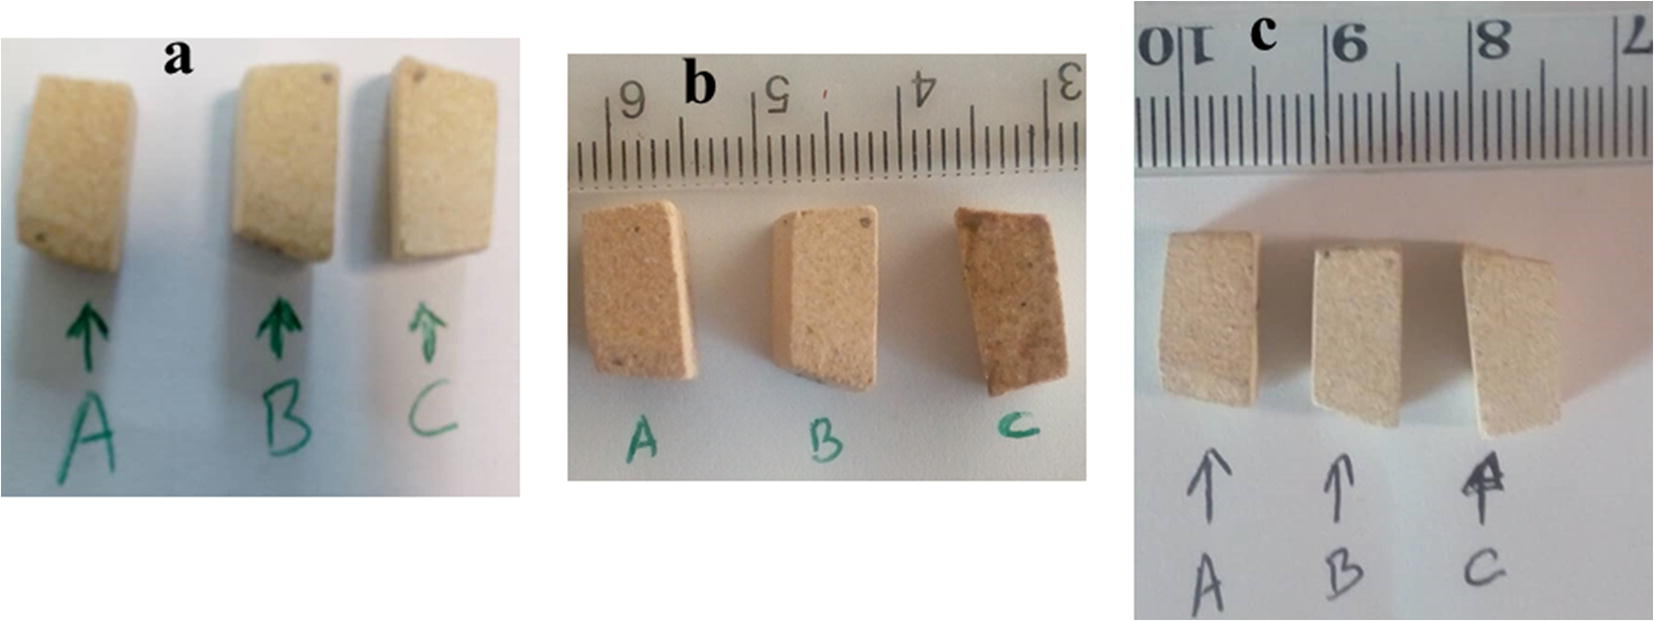
The performance of membranes was affected generally by fouling due to accumulation of dissolved and insoluble substances on their surfaces. Membrane fouling was responsible for permeability reduction and, therefore, a limited supply of water. To revitalize the performance of membranes, they could be cleaned with water, air, mechanically with ball lather, chemically, or thermally (Garmsiri et al. Reference Garmsiri, Rasouli, Abbasi and Izadpanah2017). Three samples, designated A, B, and C, were chosen for a fouling and recycling test (Fig. 12a). Samples were immersed for 5 days in the polluted water used previously for a filtration test. Samples were removed from water and dried at room temperature for 24 h (Fig. 12b). This fouling process was followed by a recycling test. The recycling technique used to renew membrane performance was manual washing with tap water, followed by thermal treatment of A at 300°C, B at 450°C, and C at 600°C for 1 h and at a heating rate of 5°C/min (Fig. 12c). The variables selected to test this recycling technique were BET specific surface area, porosity, water absorption, apparent density, and surface morphology (by SEM). These analyses were carried out before fouling and after thermal treatment.
Samples chosen for recycling test: a before fouling, b after fouling, and c after recycling

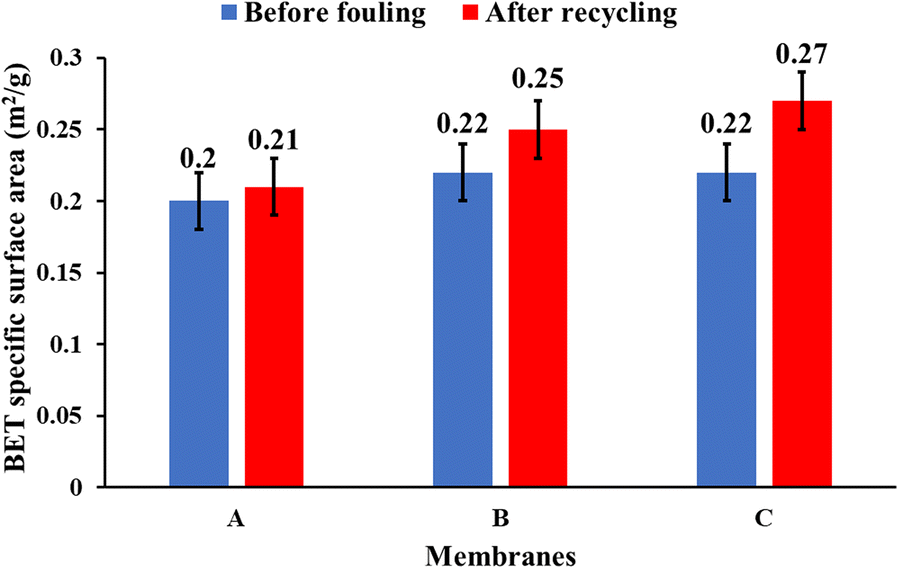
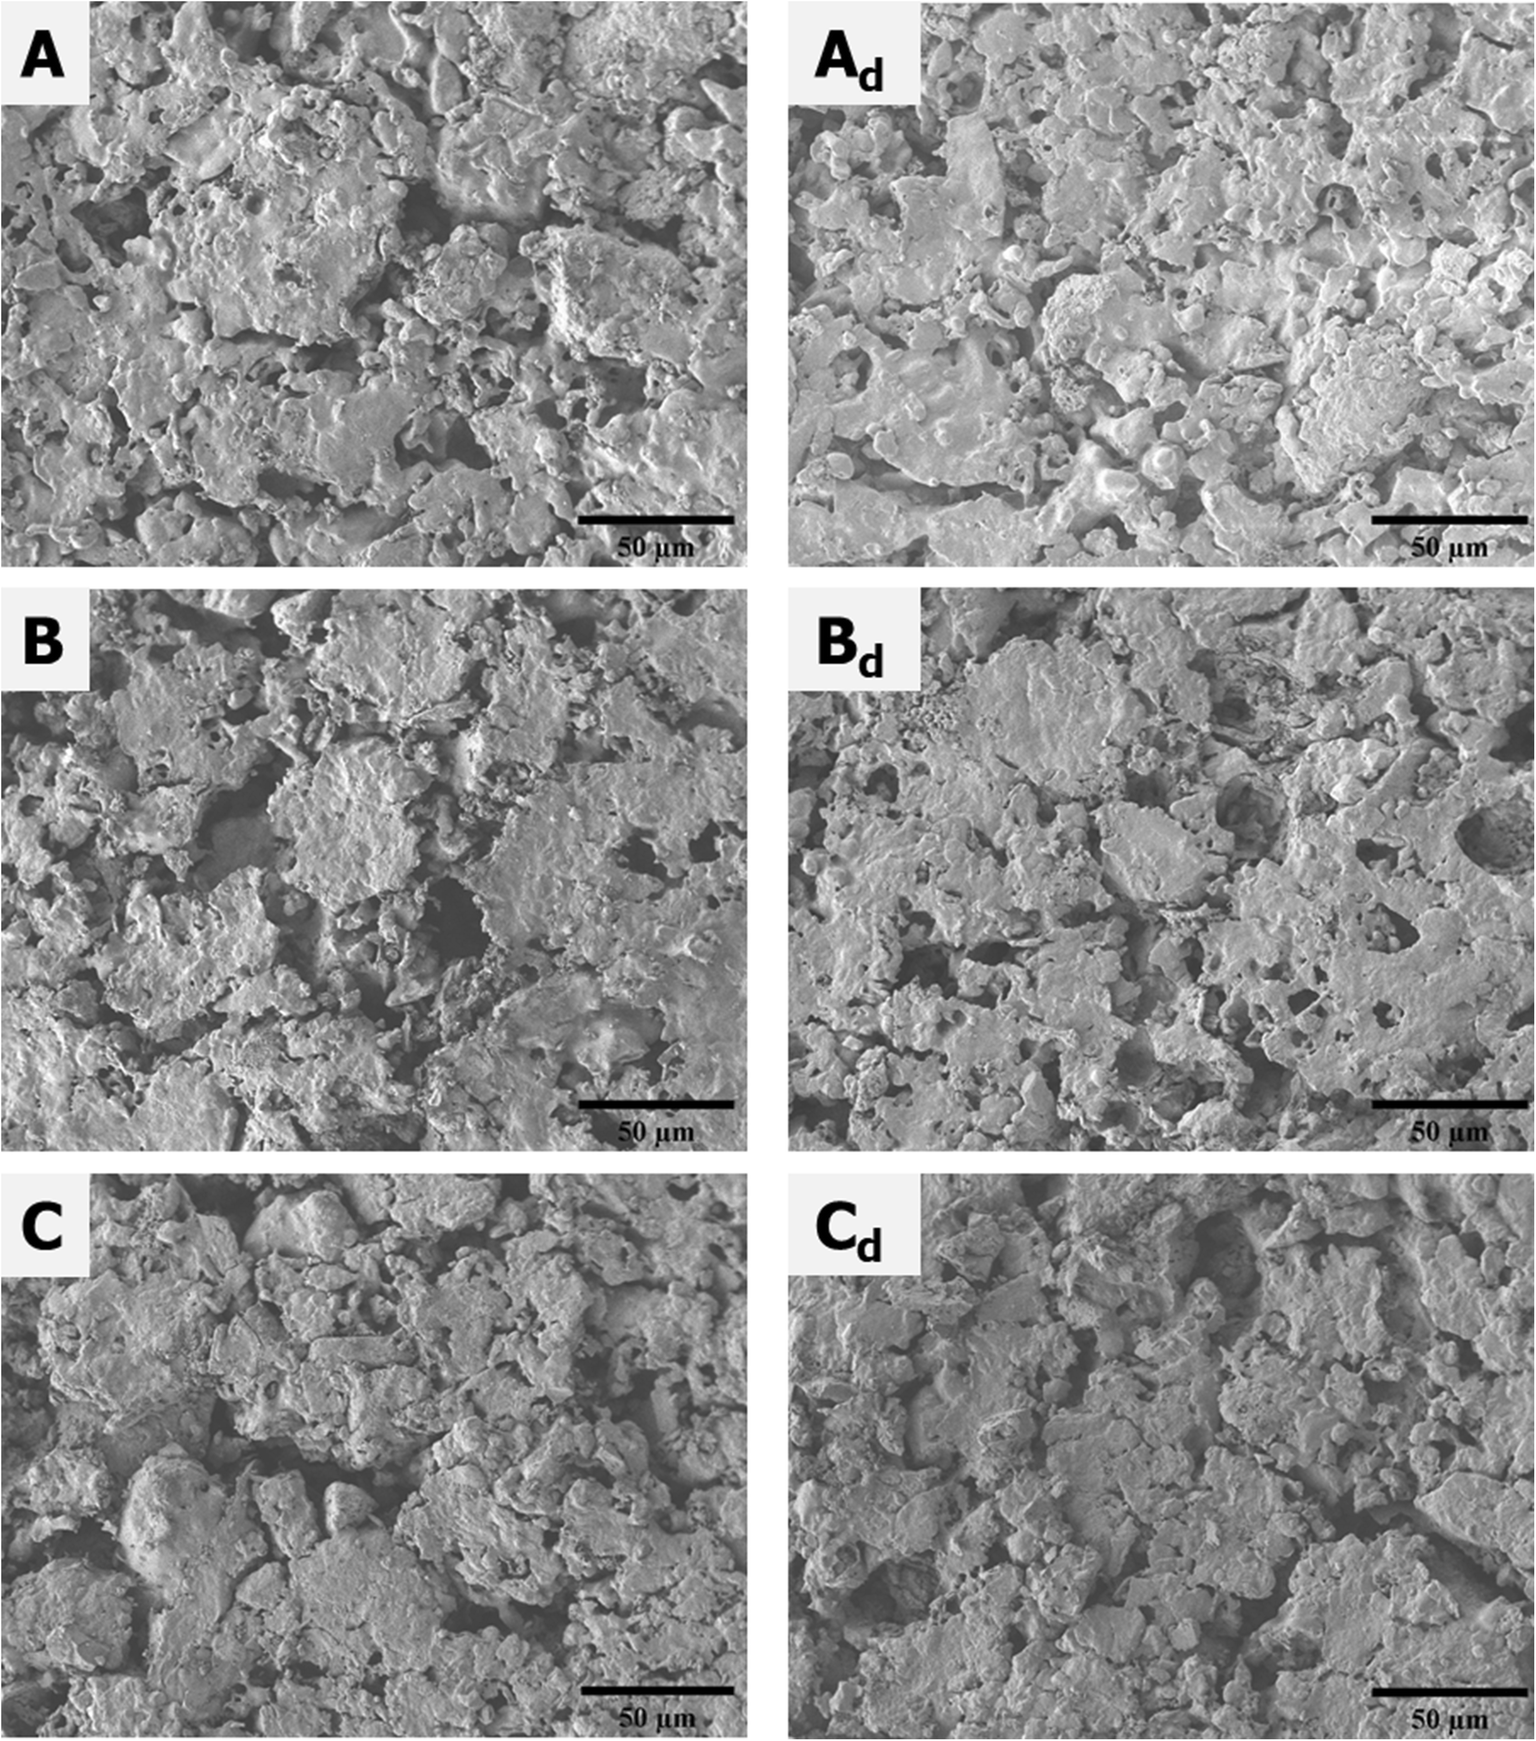
The results showed that the open porosities, apparent densities, and water absorption of each sample before fouling were almost equal to those obtained after thermal recycling regardless of sintering temperature (Table 4). The BET specific surface area of various samples changed slightly with temperature. At 300°C (sample A), the specific surface area remained unchanged, while at 450°C (sample B) and 600°C (sample C) it increased by 0.03 and 0.05 m2/g, respectively (Fig. 13). These slight differences were insignificant because they did not influence significantly membrane performance. With regard to the type of fouling material, membrane properties could vary after thermal treatment. If it was an organic-rich material, novel pores or cracks could be created during sintering. This involved physical structure change with an impact on membrane property. The SEM observations did not reveal new defaults on membrane surfaces after manual washing and sintering (Fig. 14). Their microstructures (mainly pores) remained the same and no fouling element was observed at the surfaces. Thermal treatments, therefore, cleaned the membranes without changing their properties.
Properties of membranes before fouling and after recycling

BET specific surface area of membrane before fouling and after recycling

SEM images of samples before fouling (A, B, C) and after recycling (Ad, Bd, Cd)

In summary, sample analysis before fouling and after sintering showed that temperature did not influence membrane properties. In order to reduce the cleaning (recycling) cost, a thermal treatment could be performed at 300°C. Considering that a significant amount of organic matter was eliminated at ~400°C, good results obtained at 300°C mean that membrane properties or performances could be recovered completely by manual washing without sintering. This hypothesis could explain the similarity of the results obtained. Because fouling processes took place without any external pressure, dissolved or suspended materials did not enter the membrane structure and only surface pores were obstructed; internal pores were not impacted by the fouling process. So, manual washing with tap water could be efficient for the elimination of fouling elements. For domestic use of these membranes, thermal treatment is not necessary to renew their performance. They could be washed with or without soap by using tap water and a non-metallic sponge.
Conclusions
Ceramic membranes of low thermal conductivities and with optimized physicochemical, morphological, and mechanical properties, high chemical resistance, and pore-volume fraction of >30% were developed by uniaxial pressing and sintering for 2 h at 1150°C by using low-cost raw materials including kaolin (MY3), plastic clay (KG), bovine bone ash (OB), and cassava starch (AM). Membrane morphologies showed that they exhibit sheet structures with a cohesion state closely linked to the type and proportion of porogen used. Low thermal conductivity values were also obtained (0.40–0.54 Wm–1K–1). According to flexural strength (from 6.97 to 10.53 MPa), their structures are sufficiently consolidated to be used for domestic applications, with limited risk of failure due to mechanical shock. The use of these membranes for ultrafiltration and microfiltration was justified due to the microstructures obtained: the porous network exhibited both macropores and mesopores (0.01–0.37 μm). Their ability to reject the smallest particles (<2 nm) also confirmed these two membrane filtration processes (ultrafiltration and microfiltration). Greater acid corrosion resistance of SM0 and SM1 allowed the opportunity to use them in acid water filtration; SM2 and SM3 could be used for basic water filtration because of their greater base corrosion resistance. The efficiency in selectivity of membranes was confirmed by the filtration test. They reduced turbidity to <1 NTU, pH was adjusted to ~7, and particle-size distribution was <2 nm. These results suggest that these low-cost ceramic membranes could eliminate viruses, some colloids, bacteria, and other heavy particles, and the filtered water could be consumed directly, without further treatment. Membrane recycling was efficient at all sintering temperatures (300, 450, and 600°C). At these temperatures, the performances of the membranes were recovered completely with no negative impact on their structure. These membranes could be cleaned simply, by manual washing with tap water and soap. The poor thermal conductivities of these membranes indicate that they are suitable for use in the tropics with little risk of burning.
Acknowledgments
The authors gratefully acknowledge the financial support of Agence Universitaire de la Francophonie (AUF) and Ceramics Research Instituted (IRCER) of Limoges University.
Funding
Funding sources are as stated in the Acknowledgments.
Declarations
Conflict of Interest
The authors declare that they have no conflict of interest.