1 Introduction
The phonological distinction between voiced and voiceless obstruents has been one of the most studied distinctions in many of the world's languages. Different scholars consider different features for the description of the contrast of type /b d ɡ/ ~ /p t k/. Jakobson & Halle (Reference Jakobson and Halle1956) used [±voice] and [± tense] as distinctive features. Lisker & Abramson (Reference Lisker and Abramson1964) described the contrast with a single phonetic feature known as Voice Onset Time (VOT). In their view, this feature not only separates voiced from voiceless stops, but also distinguishes aspirated from unaspirated stops. The noise feature of aspiration is simply regarded as the automatic concomitant of a large delay in voice onset. Trubetzkoy (Reference Trubetzkoy and Baltaxe1969) considered three phonetic features [±voice], [±tense] and [±aspirated]. Chomsky & Halle (Reference Chomsky and Halle1968: 327) did not share Lisker & Abramson's view that voicing implementation controls the timing of the onset of vocal cord vibration. In their universal set of distinctive features, Chomsky & Halle (Reference Chomsky and Halle1968: 328) described the voicing contrast with four binary features, [±voice], [±tense], [±glottal constriction] and [±heightened subglottal pressure]. Ladefoged (Reference Ladefoged2006: 268–275) described two feature systems for voicing contrast. One of them uses values of the features Glottal Stricture and Glottal Timing and the other one the binary features [±voice], [±spread glottis] and [±constricted glottis]. Since Lisker & Abramson's pioneering study, many languages have been investigated and the generality of VOT as an important factor has been confirmed. Now, there is abundant evidence that stop pairs at the same place of articulation are distinguishable on the basis of voice onset time (Lisker & Abramson Reference Lisker and Abramson1964, Stevens & Klatt Reference Stevens and Klatt1974, Klatt Reference Klatt1975, Lisker Reference Lisker1975, Yeni-Komshian, Caramazza & Preston Reference Yeni-Komshian, Caramazza and Preston1977, Keating, Linker & Huffman Reference Keating, Linker and Huffman1983, Keating Reference Keating1984). One of the major outcomes of these investigations is that there is language-specific variation with respect to VOT.
Many experimental studies have investigated the phonetic basis for the voicing distinction. Lisker (Reference Lisker1986) discussed sixteen acoustic features signaling voice distinction. In her licensing by cue approach to phonology, Steriade (Reference Steriade and Gordon1997: 6) listed the acoustic properties that influence the perception of voicing categories and are therefore to be treated as cues to voicing distinction. These parameters are closure voicing, closure duration, V1 duration, F1 values in V1, burst duration and amplitude, VOT values, and F0 and F1 values at the onset of voicing in V2.
VOT has been defined as the time interval between the onset of release burst and the onset of periodicity that reflects laryngeal vibration (Lisker & Abramson Reference Lisker and Abramson1964: 422). By convention, zero is assigned to voicing which occurs simultaneously with the moment of stop release, negative values to voicing before the release (voicing lead) and positive values to voicing starting after the release (voicing lag). Lisker & Abramson found a three-way distribution of VOT values for initial stops of eleven languages. These three potentially contrastive categories were defined as follows (Lisker & Abramson Reference Lisker and Abramson1964, Abramson Reference Abramson1977):
· fully voiced stops produced with a negative VOT value (voicing lead)
· voiceless unaspirated stops produced with zero or a slightly positive VOT value (short lag)
· voiceless aspirated stops produced with a clear positive VOT value (long lag)
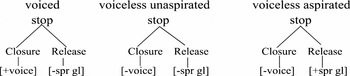
The way in which the voicing distinction is implemented phonetically using VOT is different across languages (Keating et al. Reference Keating, Linker and Huffman1983, Keating Reference Keating1984). We follow Keating (Reference Keating1984, Reference Keating1990) who proposed a model in which there are two levels of representation: phonological and categorical phonetic representation. At the phonological level, the contrast between /b, d, g/ and /p, t, k/ pairs is defined by the phonological feature [±voice] in all languages demonstrating this opposition. At the second level, the binary phonological feature values will be implemented as categories chosen from a fixed and universally specified set: {voiced}, {voiceless unaspirated}, and {voiceless aspirated}.Footnote 1 These abstract categories correspond directly to the above division of the VOT continuum into lead, short-lag, and long-lag which are further realized as articulatory and acoustic parameters represented continuously in time (Keating Reference Keating1984). Keating (Reference Keating1990) reanalyzed this categorical phonetic representation and considered a non-continuant segment to project two aperture nodes in sequence. The first is the closure with a stop aperture while the second is the release of the closure and may have either a fricative or an approximant aperture (see Figure 1).
Voicing categories in stop consonants (Keating Reference Keating1990).

The feature [voice] under the closure node distinguishes phonetically voiced from voiceless closure intervals. If vocal cords vibrate during the interval of a stop closure, the value of this feature will be positive. The feature [spread glottis] under the release node distinguishes aspirated from unaspirated stops. Hence, [+spread glottis] refers to an open position of the vocal cords resulting in aspiration, whereas [−spread glottis] refers to a close position which will result in no aspiration.
In many languages with a two-way voice distinction, voiced or voiceless phonemes might have different phonetic features in different positions or contexts. For instance, /d/ is often voiceless unaspirated word-initially in English, but the same phoneme could be fully voiced in intervocalic position. For native speakers of English, no phonological contrast would be apparent between these two [d]s. The same picture is true when we are dealing with different languages. Keating (Reference Keating1984: 291) believes that this framework allows us to always treat the stops of two languages as phonologically identical, though they may be different phonetically.
She also believes that various languages use all possible combinations of universal set of phonetic voicing categories in their implementations of [±voice]. The choice of implementation rules must be specified for each context in each language, since there seems to be no way to predict categories across environments (Keating Reference Keating1984: 315).
Among the languages which contrast [+voice] and [−voice] in initial position, some of them, such as English, Danish, and German, choose {vl.unasp.} and {vl.asp.} (i.e. voiceless unaspirated and voiceless aspirated, respectively). Other languages, such as French and Spanish, choose {voiced} and {vl.unasp.}, and a few languages, such as Turkish and Swedish (Beckman & Ringen Reference Beckman, Ringen, Schmeiser, Chand, Kelleher and Rodriguez2004, Ringen & Helgason Reference Ringen and Helgason2004), choose {voiced} and {vl.asp.} phonetic categories to implement the phonological contrast in initial position.
1.1 Aims of the study
The present study mainly investigated VOT as an acoustic correlate of voicing in Standard Contemporary Persian (SCP). SCP is a language with a two-way [voice] contrast (Samareh Reference Samareh1992). Determining the phonetic implementation of this phonological contrast in SCP, i.e. the feature of the categorical phonetic representation, is one of the aims of this study. We also investigated whether this phonetic implementation is consistent or if SCP shows differences between initial and intervocalic positions.
VOT values are known to vary systematically according to place of articulation. The general finding is that VOT values increase as the place of articulation moves from anterior to posterior position in the vocal tract (Peterson & Lehiste Reference Peterson and Lehiste1960, Klatt Reference Klatt1975, Zue Reference Zue1976, Morris, McCrea & Herring Reference Morris, McCrea and Herring2008). However, for each place of articulation there are language specific differences (Cho & Ladefoged Reference Cho and Ladefoged1999). In this study, we aimed to investigate place of articulation as an effective factor influencing VOT values. Meanwhile, none of the languages that were studied by Cho & Ladefoged (Reference Cho and Ladefoged1999) had palatal stops included in their phoneme inventory and the study of SCP might reveal the influence of palatal stops on the general differences in VOT with respect to place of articulation.
There is strong evidence to suggest that VOT can vary with vowel context (Klatt Reference Klatt1975, Morris et al. Reference Morris, McCrea and Herring2008) and sex differences (Smith Reference Smith1978, Sweeting & Baken Reference Sweeting and Baken1982, Swartz Reference Swartz1992, Whiteside & Irving Reference Whiteside and Irving1998). Among the goals of this study was to investigate the influence of these factors on VOT in SCP. This may well be one of the first studies of VOT of such scope in Persian.
There are a number of studies suggesting that fundamental frequency (F0) is an acoustic correlate of stop consonant voicing (Haggard, Ambler & Callow Reference Haggard, Ambler and Callow1970, Ohde Reference Ohde1984, Kohler Reference Kohler1985, Holt, Lotto & Kluender Reference Holt, Lotto and Kluender2001). In order to examine the effect of this acoustic parameter in Persian stops, voicing distinction, and also the trading relation between cues, we also examined F0 of the onset of the following vowel as one of the other acoustic cues to voice distinction to see how it interacts and correlates with VOT.
1.2 The phonology of Persian stops
Persian belongs to the Indo-Iranian branch of the Indo-European language family. SCP is the official language of Iran, the variety spoken by educated people in Tehran (capital of Iran) and in the media. The style level which is the subject of this study is formal quotative according to Hodge (Reference Hodge1957: 364–365).
SCP has twenty-three consonantal and six vocalic phonemes (University of Victoria Phonetic Database; UVPD 1999). Some scholars add one diphthong phoneme to the vocalic set (Mahootian Reference Mahootian1997: 286). There exists, however, some evidence against the inclusion of diphthongs in vocalic phonemes of Persian. However, this discussion would be beyond the scope of this article. Eight plosives and two affricates are contrastive, which altogether form the ten stops of SCP. The traditional characteristics of stops could be summarized as follows:

The stops under investigation in this study are /p b t d tʃ dʒ k ɡ ɢ/, i.e. the set of oral stops. As can be seen, there are pairwise voice distinctions in the oral stops except for the dorso-uvular phoneme. We include this plosive in the study for comparative and descriptive reasons.
We follow the assumption of most scholars who consider /t/ and /d/ to be dental (Windfur Reference Windfuhr1979, Pisowicz Reference Pisowicz1985, Lazard Reference Lazard and Lyon1992, Samareh Reference Samareh1992), although Majidi & Ternes (Reference Majidi and Ternes1999) and UVPD (1999) describe these phonemes as alveolars. Mahootian (Reference Mahootian1997) described them as either apico-alveolar or apico-dental. There are also different ideas about the exact place of articulation of the dorsals /k ɡ/. Some scholars consider them as velars or prevelars (Mahootian Reference Mahootian1997, Windfuhr Reference Windfuhr1979, UVPD 1999). Pisowicz (Reference Pisowicz1985: 17, 32–33) considers palatals and velars as the allophones of /k/ and /ɡ/. He proposes that palatal articulation (and not velar articulation) may be regarded as the chief representation of the phonemes /k/ and /ɡ/. We believe that palatals should be considered as phonemes and velars as their allophones, since palatals and velars are in complementary distribution such that velars occur only in the syllable onset position when the nucleus vowel is [+back] while palatals occur in all other positions. But it should be noted that even in that case they would not have the same degree of backing as English velars.
There is also some debate as to whether the uvular phoneme is a dorso-uvular plosive or fricative. Nye (Reference Nye1955), Pisowicz (Reference Pisowicz1985), Samareh (Reference Samareh1992), Mahootian (Reference Mahootian1997) and UVPD (1999) consider it to be a plosive. However, Windfuhr (Reference Windfuhr1979: 129) and Majidi & Ternes (Reference Majidi and Ternes1999) classify it as fricative. Based on the results of an acoustic experiment, we have concluded that the uvular voiced obstruent of SCP should be treated as a plosive, although in some positions (e.g. between two vowels) it assimilates to its fricative or sonorant allophone (Bijankhan & Nourbakhsh Reference Bijankhan and Nourbakhsh2008). For example, /ɢ/ in /ɑɢɑ/ ‘Mr.’ converts into [ʁ] and it realizes as [ʔɑʁɑ].
Previous studies have been carried out on voicing contrast in Persian stops. Qarib (Reference Qarib [Gharib]1965 as cited in Windfuhr Reference Windfuhr1979: 141) investigated the features of voicing on the basis of phonetic experiments; she found that besides voice the other pertinent feature is aspiration. Experiments of Zavj'alova (Reference Zav'jalova1961, as cited in Windfuhr Reference Windfuhr1979: 142) showed that the voiceless stops are generally aspirated whereas the voiced stops are never aspirated but may be (partially) devoiced or (partially) voiced in specific environments. Lazard (Reference Lazard and Barrau1972) suggested that aspiration is the essential distinctive feature of the above contrast and voice distinction is secondary. He consequently identified the major distinction as fortis vs. lenis. Pisowicz (Reference Pisowicz1985: 36) and Windfuhr (Reference Windfuhr1979: 129) also viewed the opposition as an opposition of tenseness. Mahootian (Reference Mahootian1997: 287) believes that the set of voiceless stops are aspirated in syllable initial position and unaspirated at the end of a syllable. UVPD (1999) considered voiceless stops as aspirated in all positions. Heselwood & Mahmoodzadeh (Reference Heselwood and Mahmoodzade2007), in an EGG experiment, investigated vowel onset characteristics including VOT, measures of pitch (Fx), closed quotient (Qx) and spectral tilt (ST) as a function of voice and manner contrast in Persian coronal stops. They showed that VOT distinguishes between voiced and voiceless coronal stops. Regarding the Fx measurements, they concluded that it distinguishes voiced from voiceless coronal plosives but not voiced from voiceless affricates. They report that the spectral tilt distinguishes voiced from voiceless stops. Their results also showed that the minimum, mean and maximum Qx differences between /t/ and /d/ are significant, but only the minimum Qx difference reaches significance for distinguishing /tʃ/ and /dʒ/.
2 Methodology
2.1 Participants
Five male and five female participants were selected for the study. All were native speakers of SCP and were born in Tehran of Persian-speaking parents. The participants did not speak any other language as their first language. They were university students and had some knowledge of English as their second language. The mean age ±SD of the participants was 25.6 ±4.6 ranging from 22 to 37 years old. None of them reported any history of speech disorder.
2.2 Materials
2.2.1 Experiment 1: initial position
Nonsense words were not selected as material for the study, because we have observed that participants usually pronounce them in an unnatural and conservative manner. The initial position items contained 54 monosyllabic words of the form C1V1C2, such that C1 covers the full set of SCP oral stops /p b t d tʃ dʒ k ɡ ɢ/ and C2 only sonorant consonants (including /h/ as a sonorant glide; Chomsky & Halle Reference Chomsky and Halle1968: 303). Monosyllabic words were all stressed. Four factors, namely voicing, place of articulation of each stop, quality of the nucleus vowel including the full set of Persian vowels /i e æ u o ɑ/, and sex of participants were examined in initial position (see appendix).
2.2.2 Experiment 2: intervocalic position
Eleven bisyllabic words of the form CVC1VC2 were selected as intervocalic items such that C1 and C2 included the same consonants as mentioned above. The syllable C1VC2 of items are all stressed similar to the first set of items, because stress falls on the last syllable of Persian nouns. Vowels of both syllables were low back /ɑ/ with the exception of two words with dorso-palatal C1 in which the vowels were low front /æ/. This is due to the place assimilation of vowels with dorsal stops in SCP. Voicing, place of articulation of the stops and sex of speakers were examined in intervocalic position.
The ten subjects were asked to produce each token three times, yielding 195 = (54 initial + 11 intervocalic) × 3 tokens per speaker and 1950 (= 195 × 10 speakers) tokens altogether.
2.2.3 Experiment 3: fundamental frequency
Twenty-two words were selected from the data gathered for experiments one and two containing all of the oral stops in the vowel frame /_ɑ/ in initial position, (/_æ/ in the case of the palatal stops) and /ɑ_ɑ/ in intervocalic position (/æ_æ/ in the case of the palatal stops). As noted above, all the stops follow the same stress pattern, i.e. they are selected from the onset of a stressed syllable.
Since the sex of the participants has major influence on the fundamental frequency values, we considered only the data elicited from male speakers for this experiment. F0 differences at voicing onset were examined for voiced and voiceless items and the relation between F0 and VOT was also investigated.
2.3 Recordings and measurements
The recordings were made in a quiet room in the phonetics laboratory of the University of Tehran, using a high quality Shure microphone and Kay Computerized Lab (CSL) model 4400. The microphone was positioned about 20 cm from the mouth of the speaker in a diagonal position.
The items were presented out of context and the participants were asked to read them one by one, with a pause and in a natural way, without any marked intonation.
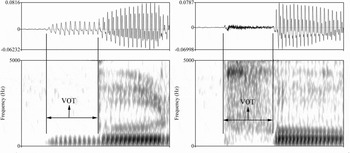
Subsequently, the VOT of each speech sample was measured using Praat (Boersma & Weenik 2008). VOT measurements were made from the signal by measuring the time between the release burst and the onset of voicing marked by the first visible sign of periodic acoustic activity. Following Keating (Reference Keating1980: 36–37) for positive VOT, voice onset began with the zero-crossing before the first negative peak of pulsation. For negative VOT, voice onset was measured from the low point of the first clear negative peak. We examined spectrograms in some cases only for the confirmation of our measurement landmarks. Figure 2 shows landmarks for positive and negative VOT values in initial position. In the intervocalic position, the closure duration was measured in the case of negative VOT values. In all of the cases, voicing in the closure period of intervocalic stops continued from the preceding vowel through to the following one. In some cases, the amplitude of voicing decreased near the burst release but did not cut off. Tokens that did not contain the proper landmarks or ones which were spirantized or sonorized were omitted from the analysis.
[bu-] from [bur] (left): negative VOT = −69 ms; [pu-] from [pur] (right): positive VOT = 84 ms by one of the male participants (landmarks are shown by solid lines).

The reliability of acoustic measurements was assessed by within-experimenter reliability tests. 10% of the data were chosen at random and reanalyzed by the investigator at least 12 months after VOT measurement had begun. A total of 195 tokens were selected on the basis of stratified random sampling and were re-measured and compared to the original set of VOT measurements. Examination of the Pearson product correlation for similarity indicated that reliability was high. The correlation between the original VOT measures and the follow-up measures was r = .995 and Cronbach's Alpha = .997.
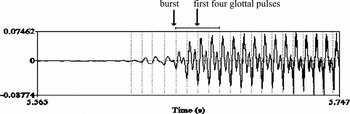
Fundamental frequency of samples was measured using Praat. F0 was determined by pitch analysis in the selected set consisting of the first four complete glottal pulses after the burst release of stops (figure 3). Minimum, maximum, and mean pitch values were reported for each stop.
Landmarks (burst and the first four glottal pulses) for the measurement of F0.

2.4 Statistical analysis
Advanced statistical methods were used in order to consider the main effects of all factors as well as factor-by-factor interactions. The General Linear Model (GLM) univariate procedure, which provides analysis of variance for one dependent variable by one or more factors or variables, was considered to be an appropriate model in this study. A two-way ANOVA was utilized to assess differences of VOT values between voicing category (voiced and voiceless) and position (initial and intervocalic) factors. Two separate two-way ANOVAs were utilized for the analysis of place of articulation and the following vowel context for voiced and voiceless items. Separate analysis was conducted for each voicing category because of the inherent differences between voiced and voiceless stops. A two-way ANOVA was used to examine the effect of sex of participants and its interaction with voicing categories. An alpha-level of .05 was set as the level of significance. The relative effect size of each factor and factor interactions were also calculated. SPSS 13.0 statistical software was used for all of the descriptive and analytic statistics.
3 Results and discussion
3.1 Voicing contrast distinction
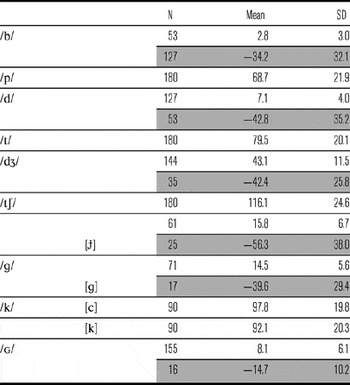
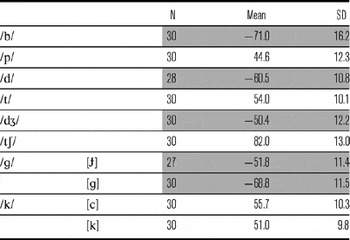
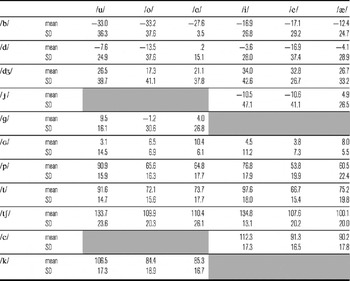
The VOT values in ms for the voiced and voiceless stop consonants in initial and intervocalic positions are displayed in tables 1 and 2, respectively. Mean, standard deviation (SD) and number (N) of tokens are shown for each sound. Although the palatals are believed to be underlying forms, we present the VOT values for palatal and velar stops separately. Following standard practice, the positive and negative values are presented separately for voiced stops. Negative values are shown in grey areas. However, all voiced tokens, not just positive VOT values, are included in the graphs and statistics.
VOT values (ms) for initial stops. Negative values are represented separately in grey areas.

VOT values (ms) for intervocalic stops. Negative values are represented in gray areas.

The uvular stop /ɢ/ was excluded from the intervocalic analysis, since in 78.3% of the cases, it was spirantized or sonorized in this position.
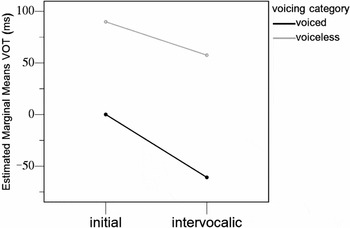
The GLM univariate analysis of variance indicated that the VOT differences between voiced and voiceless groups was highly significant (F(1,1895) = 3041.47, p < .001, effect size = .616). The same test revealed that the VOT differences between initial and intervocalic positions were significant (F(1,1895) = 610.45, p < .001, effect size = .244). The interaction between voicing category and position factors were also significant (F(1,1895) = 57.53, p < .001, effect size = .029). Figure 4 represents the interaction plot between these two factors. Since both lines are close to parallel and the effect size is also very small, the interaction between voicing and position is rather marginal.
Interaction plot of VOT values in initial and intervocalic positions for voiced and voiceless stops.

As is evident from the interaction plot in figure 4, voiceless items had higher VOT values than voiced items, both in initial and intervocalic positions. It is also evident that VOT in initial position had higher values than intervocalic position, both for voiced and voiceless items.
The overall findings suggest that VOT is a powerful differentiator of Persian stops, distinguished phonologically by the [±voice] feature.
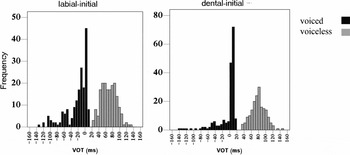
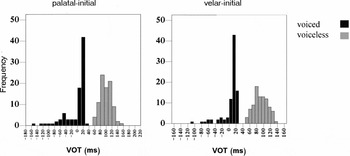
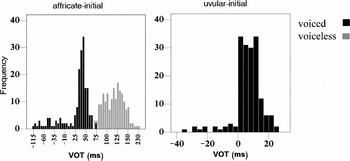
Of course, it would not be enough to compare the means of VOT values in order to consider the latter as the acoustic correlate of voicing in SCP, it is also necessary to perform a distributional descriptive test for each voiced/voiceless pair of stops. Figures 5–7 represent distributions of each pair of stops in initial position. It is clear from these diagrams that there was no overlap between voiced and voiceless phonemes in most places of articulation. The only exception was for affricates /tʃ dʒ/ for which a slight VOT overlap could be observed. In the case of bilabial plosives, there is a gap of 10 ms between voiced and voiceless sounds. This gap is equal to 15 ms for dentals and palatals.
Distribution of measured VOT values for initial bilabial (left) and dental (right) stops.

Distribution of measured VOT values for initial palatal (left) and velar (right) stops.

Distribution of measured VOT values for initial affricates (left) and uvular stop (right).

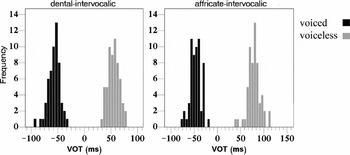
Distributional descriptive tests for each voiced–voiceless pair of stops indicated that there was no overlap between the voiced and voiceless phonemes for all places of articulation in intervocalic position. Figure 8 presents the distributions of the voiced–voiceless dental and affricate stops as examples clearly showing that there was a distinction between voiced and voiceless stops in each case.
Distribution of measured VOT values for intervocalic dental (left) and affricate (right) stops.

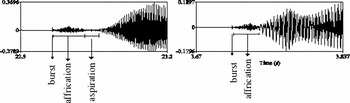
The two stop categories occupy distinct ranges along the VOT dimension and can be identified acoustically and phonetically using this measure. There was only a slight degree of overlap between the VOT distribution of voiced and voiceless affricates in initial position. Heselwood & Mahmoodzadeh (Reference Heselwood and Mahmoodzade2007) in their study of Persian coronal stops showed that the VOT measure distinguishes between voiced and voiceless affricates. Their finding was based on the comparison of means and they did not present distributional statistics for their data. Jansen (Reference Jansen2004) argued that VOT is secondary in signaling the voice distinction of affricates, because affricates have a longer release stage than plosives, which can overlap the aspiration phase of voiceless affricates (Jansen Reference Jansen2004: 58–60). Although the temporal pattern of release and aspiration for affricates is different from that of other stops, the VOT mean difference between voiced and voiceless affricates is noticeable. Since VOT includes both affrication and aspiration stages of stop release patterns (figure 9), it may be preferable not to consider it as a secondary cue in voicing distinction of affricates. Indeed, there are several important acoustic cues in voicing distinction of affricates. However, in order to consider one of them as primary or secondary, the appropriate perception experiments need to be conducted.
Burst and release patterns of voiced and voiceless affricates. [tʃɑ-] (left): positive VOT = 104 ms; [dʒɑ-] (right): positive VOT = 27 ms by one of the female participant.

As discussed above, SCP is said to contrast [+voice] and [−voice] stops. Determining the phonetic categories that implement this phonological contrast was one of the main goals of this study. The mean VOT value in initial position for /p/ is 68.7 ms, with a mode at 75 ms. For /t/ the mean and mode were 79.5 ms and 84 ms, respectively. The palatal /k/ displayed a mean VOT of 97.8 ms with a mode at 81 ms. Mean and mode VOT values for /tʃ/ were 116.1 ms and 101 ms, respectively. These values indicate that SCP speakers produced /p t k tʃ/ with long lag VOT values that are quite typical of languages that employ the {vl.asp.} phonetic category as the implementation of the [−voice] phonological feature. We investigated whether voiced stops were produced mainly with prevoicing or short lag in each position. The negative VOT values were recoded as prevoiced and positive VOT values of voiced items were recoded as short lag into a separate variable. Statistics showed that short lag items had a higher percentage (69.12%) as compared to prevoiced ones (30.88%) in initial position.
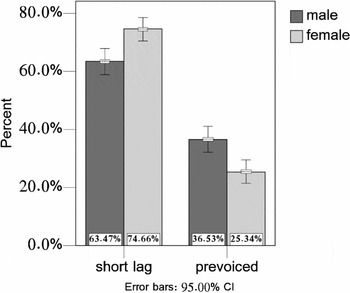
Previous studies revealed that the occurrence of prevoicing can be affected by a number of potentially relevant factors, including sex of speakers and place of articulation (Smith Reference Smith1978, van Alphen & Smits Reference van Alphen and Smits2004). The influence of the sex of the speakers as well as the place of articulation were also investigated in initial position in the present study. Figure 10 displays the percentage of male and female uses of prevoicing vs. short lag for voiced tokens. It shows that male speakers produced more tokens with prevoicing than females did.
Percentage of prevoiced and short lag items for voiced stops in initial position according to sex difference.

This result manifests an effect of the sex of the speakers on the percentage of prevoicing articulation. On the whole, males produced 36.53% and females 25.34% of all voiced stops with prevoicing. This could be due to the smaller size of vocal tracts in females which causes the air pressure in the supraglottal area to rise more quickly, resulting in more prevoicing in males than females (van Alphen & Smits Reference van Alphen and Smits2004: 459).
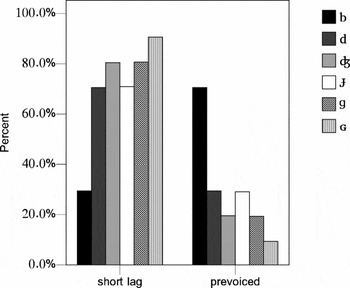
Figure 11 displays the percentage of prevoiced and short lag items for voiced tokens according to place of articulation. The figure shows that the bilabial plosive [b] was more often produced with prevoicing, but the dental plosive [d], postalveolar affricate [dʒ], palatal, and velar plosives [ ɡ] as well as the uvular plosive [ɢ] were produced mainly with short lag VOT values. Visual examination of the figure reveals that there is a general tendency for the percentage of short lag plosives to increase as the place of articulation moves back.
Percentage of prevoiced and short lag items for each voiced stop according to the place of articulation.

There were also considerable speaker differences in the use of this variable. For example, in initial position one speaker produced 100% of an item with a short voicing lag, while another one produced 80% of the same item with prevoicing. Consistent prevoicing by a minority of speakers was also found by Heselwood & Mahmoodzadeh (Reference Heselwood and Mahmoodzade2007: 131) who cite Docherty (Reference Docherty1992) as having found the same in English.
For the purpose of testing the relation between length of affrication and negative VOT values, we measured the length of affrication for the voiced affricate [dʒ]. The measurements were made from the signal by measuring the distance between the release burst and the onset of periodic acoustic activity of the following vowel. The linear regression test shows a non-significant F(1,63) = 2.39 statistic, indicating that the variation in the negative VOTs could not be predicted by the length of affrication (α = .127).
Previous studies (Lisker & Abramson Reference Lisker and Abramson1964, Keating et al. Reference Keating, Linker and Huffman1983) revealed that in languages with a two-way voicing distinction, [±voice] is implemented phonetically by VOTs from adjacent categories, i.e. {voiced/vl.unasp.} or {vl.unasp./vl.asp.} and not from the extreme categories, i.e. {voiced/vl.asp.}. The generality of this observation requires some modification for SCP. It seems that this language typically uses the {vl.unasp.} phonetic category as the implementation of [+voice], but the {voiced} phonetic category is mainly used for the bilabial stop [b]. In other words, the bilabial voice distinction is implemented by extreme categories. Maddieson (Reference Maddieson1981) and van Alphen & Smits (Reference van Alphen and Smits2004) also reported a similar difference due to the place of articulation in some languages. The effect of place of articulation on the occurrence of prevoicing can be explained by differences in the size of the surface of the vocal tract walls. An increase in the air pressure inside the oro-pharyngeal cavity will exert a slight outward push, causing the cavity to expand and the pressure inside to lower. The extent to which this is possible depends on place of articulation (Hayward Reference Hayward2000: 240). Since labial plosives are produced more anteriorly than other plosives, the surface of the tissue that can be pushed outward as a result of raised oral pressure is larger for labials than for alveolars. In line with this, labials were more often produced with prevoicing than other plosives (van Alphen & Smits Reference van Alphen and Smits2004: 464).
As noted above, Swedish and Turkish do not use adjacent categories for the implementation of voicing contrast. Ringen & Helgason (Reference Ringen and Helgason2004) presented empirical evidence to show that voice onset in Swedish lenis stops precedes stop release in initial, intervocalic and final positions. They also reported that word initial fortis stops are postaspirated, while word-medial and final fortis stops are either preaspirated or unaspirated, depending on the speaker. When followed by a vowel, however, word-medial fortis stops are not postaspirated. Comparing Swedish to SCP reveals major differences between these two types of languages.
Returning to the typological issue, it could be concluded that SCP typically uses {vl.unasp.} and {vl.asp.} phonetic categories as the implementation of [±voice] in initial position. Moreover, it is shown that VOT strongly distinguishes between voiced and voiceless stops in intervocalic position.
As a next step, it should be determined if SCP shows a difference between initial and intervocalic positions in the implementation of [± voice]. The mean VOT value in intervocalic position for /p/ is 44.6 ms, with a mode at 27.0 ms. For /t/ the mean and mode were 54.0 and 45.0 ms, respectively. /k/ displayed a mean VOT of 55.7 ms with a mode at 54.0 ms. Mean and mode VOT values for /tʃ/ were 82.0 and 83.0 ms, respectively. Although these are less than their corresponding values in initial position, they are all considered as long lag VOT values which indicate that SCP also uses the {vl.asp.} phonetic category as the implementation of [−voice] phonological feature in intervocalic position. In intervocalic position, 100 percent of voiced tokens were produced with negative VOT values. It could be concluded that {voiced} is the phonetic category which implements [+voice] in this position. This is in line with articulatory ease because the intervocalic stops are voiced without the need for extra gestures (Keating Reference Keating2003).
To summarize, there is a clear difference between the implementation of voicing in initial and intervocalic positions in SCP. In both positions the [−voice] phonological feature is implemented by the {vl.asp.} phonetic category. However, the implementation of [+voice] is {vl.unasp.} in initial position and {voiced} in intervocalic position. It seems that SCP prefers articulatory ease over articulatory uniformity (Keating Reference Keating2003). It is also concluded that SCP does not use adjacent categories in intervocalic position.
3.2 Factors affecting VOT
In this section we investigate how the parameters place of articulation, vowel context and sex of speakers affect VOT.
3.2.1 Place of articulation
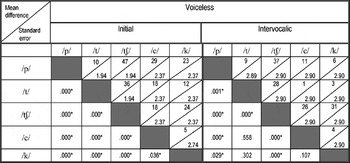
Significant differences in the VOT values according to place of articulation were confirmed by the GLM univariate analysis of variance for voiced items (F(5,824) = 57.60, p < .001, effect size = .259) as well as for voiceless items (F(4,672) = 171.39, p < .001, effect size = .505) with the full range of vowels in initial position. The same test revealed that the differences in VOT values according to place of articulation were significant for both voiced (F(4,133) = 18.78, p < .001, effect size = .361) and voiceless (F(4,138) = 50.38, p < .001, effect size = .594) categories in intervocalic position. It should be noted that the equal variance assumption was violated in initial position for voiced items since the significance value of the Leven's test of equality of error variances was less than .1. Thus Tamhane's test was used for the post hoc analysis of voiced items in initial position, but for other cases the HSD post hoc test was used. Tables 3 and 4 represent the results of the post hoc. The upper part of each table shows mean differences and standard errors and the lower part of the tables shows the level of significance. It is evident from table 3 that all the differences of voiceless stops in initial position were significant. But the differences between [t] versus [c, k] as well as the difference between [c] and [k] were not significant in intervocalic position.
Post hoc test for voiceless initial and intervocalic stops according to place of articulation. Significant differences marked with an asterisk.

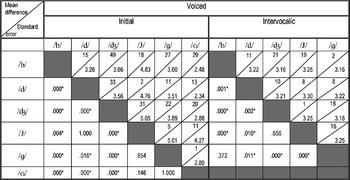
Post hoc test for voiced initial and intervocalic stops according to place of articulation. Significant differences marked with an asterisk.

Table 4 shows that the difference between [] versus [d ɡ ɢ], and also between [ɢ] and [ɡ] were not significant in initial position. In intervocalic position all the differences were significant except the difference between [b] and [ɡ] as well as [] and [dʒ].
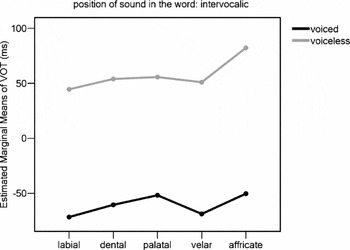
The interaction of voicing and place of articulation was also significant in both initial (F(4,1593) = 2.95, p < .05, effect size = .007) and intervocalic (F(4,285) = 8.89, p < .001, effect size = .111) positions. There exists a significant difference between the means of voice/voiceless pairs in each place of articulation. Moreover, voiceless items had higher VOT values at each place of articulation. Figures 12 and 13 contain interaction plots between place of articulation and voicing factors in initial and intervocalic positions, respectively. Since affricates have longer VOTs than plosives due to their different release pattern, they are placed out of their vocal tract position and after all other stops in these figures. As noted above, initial stop values are taken from the full range of vowel contexts while intervocalic values are taken only from low vowel contexts. To be more precise, initial items are compared in two ways and the results are given in two separate plots. The left plot represents initial items in full vowel contexts and the right plot in just low vowel contexts. Visual examination of these two plots, however, reveals that the picture did not differ greatly in these two conditions. Since the pair of broken lines in the figures 12 and 13 are inclined to have almost same direction for each pair of adjacent places, the interaction of voicing and place of articulation is rather marginal. Discontinuity in the broken line of voiceless plosives results from lack of unvoiced uvular plosive in SCP and therefore detaching of the unvoiced affricate node from the broken line.
Interaction plots representing the effect of place of articulation and voicing category on VOT values (ms) in initial position. The right plot represents items in a low front vowel context for palatals and in a low back vowel context for all other tokens and the left plot represents items in a full range of vowel contexts.

Interaction plots representing the effect of place of articulation and voicing category on VOT values (ms) in intervocalic position.

Analyses of VOT values by place of articulation mostly replicate the previous studies in this regard. Many studies have reported that the further back the closure, the longer the VOT values would be (Peterson & Lehiste Reference Peterson and Lehiste1960, Klatt Reference Klatt1975, Zue Reference Zue1976). The results presented in figures 13 and 14 show that dentals have higher values than bilabials, and palatals have higher values than dentals. These findings could be explained by general aerodynamic and physiological laws. The volume of the cavity behind the constriction and the volume of the cavity in front of constriction are among the causes of VOT variations due to change in place of articulation. If the volume of the supralaryngeal cavity behind the constriction is small, the air pressure is greater so it takes longer to fall and delaying the time before vocal fold vibration can begin. Thus, more front-articulated stops are more compatible with voicing. Sprouse, Solé & Ohala (Reference Sprouse, Solé and Ohala2008) estimated the overall compliance of the walls of the supraglottal cavity for various places of articulation, including retroflexes. Since the duration of voicing was longer in retroflex stops compared to alveolars, they claimed that the differences in the area available to be compliant to the air pressure are more important than the differences in cavity size. On the other hand, the greater mass of air in front of the constriction causes a greater obstruction to the release of the pressure behind it, again delaying the time before adequate transglottal pressure is attained (Cho & Ladefoged Reference Cho and Ladefoged1999: 213).
Effect of vowel context and voicing categories on VOT values in initial position.

These aerodynamic characteristics account for the above differences in VOT value for voiced items. For voiceless plosives, on the other hand, the glottis is open and there might be a ceiling effect, i.e. intraoral pressure equalizes subglottal pressure, no matter where the closure in the oral cavity is produced, the limit is the subglottal pressure.
But the difference between palatals and velars does not follow from the above observation. As can be seen in figures 12 and 13, the VOT values of voiced and voiceless velars in intervocalic position and voiceless velars in initial position were lower than the VOT values of palatals. These findings are not in accordance with the general pattern above. Cho & Ladefoged (Reference Cho and Ladefoged1999), in their cross-linguistic study of the relation between VOT and place of articulation, showed that it may depend on aerodynamic circumstances, the mass and mobility of different articulators, temporal adjustment between the closure duration and VOT, and perceptual factors. These factors are given different weights in different languages, resulting in variations across languages in the way contrasts in VOT are manifested (Ladefoged & Cho Reference Ladefoged and Cho2001). As noted above, there is no contrast between palatal and velar stops in SCP and velars could not be considered as phonemes. The difference between palatals and velars could be explained by the difference between the contact areas for these two places of articulation. IPA male samples of the forms [ɑɑ] and [ɑɡɑ] in the Kay Elemetrics Palatometer database (model 4333, version 2.5.1, software developed by Speech Technology Research Ltd.) show that the contact area for velars, which are normally posterodorsum, is smaller than for palatals, which are normally anterodorsum (Catford Reference Catford1992: 81) and this could be the reason for the above difference. Cho & Ladefoged (Reference Cho and Ladefoged1999: 211) described the difference of VOT according to the extent of articulatory contact area on the basis of explanations by Stevens (Reference Stevens1999), who noted that the rate of change in intraoral pressure following the release depends on the rate of increase in the cross-sectional area at the constriction. When there is a long, narrow constriction, the Bernoulli effect causes the articulators forming the constriction to be sucked together. The Bernoulli effect is larger if the contact area is more extensive. Consequently, the decrease in intraoral pressure after the closure is more gradual for the more extended closure areas.
It should be noted that [d] and [t] are lamino-dentalveolar plosives in SCP, i.e. in order to produce these phonemes, the tip of the tongue is placed behind the upper teeth and the blade of the tongue is placed below the alveolar region. So the contact area is normally larger than in the case of alveolar stops in languages such as English. This could be the reason for some of the unexpected non-significant differences in tables 3 and 4.
Figure 12 also revealed that the uvular phoneme /ɢ/ does not follow the general pattern and, as noted above, its difference to [] and [ɡ] was not significant. In the uvular place of articulation there is only a single stop and there is no need to make a perceptual distinction between a voiced plosive and its voiceless congener. Docherty (Reference Docherty1992) suggests that a low-cost option causes languages to use the simplest articulatory gestures in such situations. As for the difference between velars and uvulars, Cho & Ladefoged (Reference Cho and Ladefoged1999) observed little consistency in their data. They suggested that because the uvular stop might be produced by a constriction with relatively shorter contact, the VOT of uvulars could be shorter than that of velars.
Cho & Ladefoged (Reference Cho and Ladefoged1999: 223) suggested separating languages into four phonetic categories according to the amount of positive VOT values. Their suggested categories for velar stops were unaspirated stops (30 ms), slightly aspirated stops (50 ms), aspirated stops (90 ms), and highly aspirated stops. Comparing the mean VOT values of voiceless palatal stop (97.8 ms) and voiceless velar stop (92.1 ms) of SCP to these categories, it could be concluded that the specific region of SCP on this VOT continuum would be the third category which might be referred to as aspirated stops.
3.2.2 Vowel environment
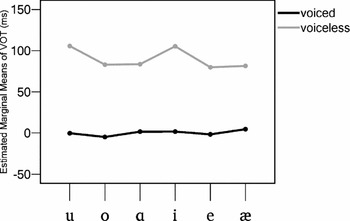
The effect of vowel quality on the VOT values of preceding stops is reported below only for the initial position because the tokens in the intervocalic experiment included low vowel environments exclusively. Table 5 shows the mean VOT values of initial stops as a function of the following vowel environment.
Mean and standard deviation of VOT values (ms) for voiced and voiceless stops as a function of next vowel context. Significant differences marked with an asterisk.

The GLM univariate test indicated that there was a significant difference of VOT values due to the next vowel effect for voiced (F(5,824) = 2.77, p < .05, effect size = .017) and voiceless stops (F(5,672) = 54.207, p < .001, effect size = .287).
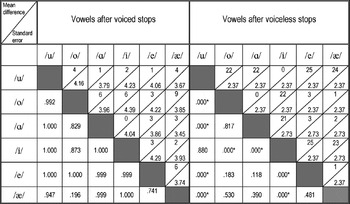
Tamhane's test was used for the post hoc analysis of voiced items since Levene's test was significant (F = 6.049, p < .001), but for voiceless items the LSD post hoc test was used. Table 6 shows the details of the post hoc test for the effect of vowel context on VOT values for voiced and voiceless initial stops.
Post-hoc tests for the effect of vowel context on VOT values of voiced and voiceless initial stops. Significant differences marked with an asterisk.

The post hoc tests revealed that this difference was significant only for high vowels in comparison to non-high vowels (p < .001) for voiceless stops. It appears that there is no dependency of VOT values to the [±back] feature or degree of height for middle and low vowels. A two-way ANOVA test revealed that the interaction of vowel context and voicing categories was significant (F(5,1592) = 10.46, p < .001, effect size = .032). Figure 14 represents the interaction plot of these two factors.
There appears to be a systematic variation for voiceless stops of VOT as a function of the positive or negative values of the feature [high] of subsequent vowels. This is in accordance with the findings by Klatt (Reference Klatt1975), Chang, Ohala, Hansson & James (Reference Chang, Ohala, Hansson and James1999) and Morris et al. (Reference Morris, McCrea and Herring2008). However, it seems that no consistent dependency could be found as a function of the following vowel for voiced stops in the present study. Chang et al. (Reference Chang, Ohala, Hansson and James1999) found that VOT of voiceless stops and vowel height are indeed mechanically linked. They analyzed acoustic and aerodynamic data collected from a male native speaker of American English uttering 12 nonsense words of the type [ati], [ata]. They proved the hypothesis that high vowels engender longer VOT because they offer greater resistance to the air escaping from the mouth, thereby delaying the transglottal pressure differential required for voicing. Zue (Reference Zue1976: 85–101) also studied the relation of vowel quality with VOT, but he did not find any dependency of VOT on the vowel context. His database included 1728 utterances spoken by three male speakers. He used fifteen English vowels and diphthongs in his study. Zue (Reference Zue1976: 77) measured VOT from the onset of burst release to the first signs of periodicity following the release in the time waveform. He believes that prevoicing is not a phonemic determinant in English, so he ignored prevoicing in his study. He suggested that the difference of his results to those of Klatt was due to the difference in measurement techniques since Klatt utilized spectrograms and measured VOT from release to the onset of voicing defined as the time where the second and higher formants are clearly visible (Zue Reference Zue1976: 100).
3.2.3 Sex differences
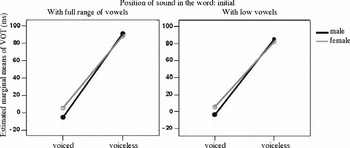
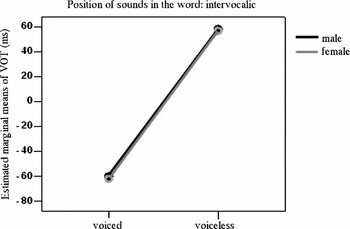
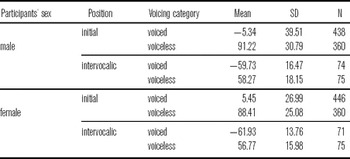
The GLM univariate test indicated that the difference of VOT values due to sex of participants was significant in initial position (F(1,1600) = 6.43, p < .05, effect size = .004). The interaction of sex and voicing category factors was also significant (F(1,1600) = 18.65, p < .001, effect size = .012) in initial position. The same test indicated that the difference of VOT values due to the sex of the participant was not significant in intervocalic position (F(1,291 = .96, p = .33) and neither was the interaction of sex and voicing category factors in intervocalic position (F(1,291) = .03, p = .85). Figures 15 and 16 represent the interaction plot of these two factors in initial and intervocalic positions and table 7 shows the mean and standard deviation of VOT values for each factor. In order to consider the effect of vowel contexts, initial items are presented in two separate plots. The left plot represents initial items in all vowel contexts and the right plot in low vowel contexts. Comparing these two conditions revealed that vowel context might not have a high impact on the sex difference parameter.
Effect of participant's sex and voicing categories on VOT values in initial position. The right plot represents items in a low front vowel context for palatals and low back vowel context for all other tokens and the left plot represents items in a full range of vowel context.

Effect of participant's sex and voicing categories on VOT values in intervocalic positions.

VOT values (ms) for sex and voicing category factors.

Examining the statistics revealed that for voiced items in initial position, females produced higher VOTs than males but for voiceless items, the mean difference was not significant. For both voiced and voiceless items females had lower standard deviations. The difference for voiced items could be due to the difference between using prevoiced and short lag VOT categories which was reported in section 3.1, figure 10. As reported above, females show a higher percentage of using short lag category than males and since short lag items have higher VOT values than prevoiced items in initial position this causes females to produce higher VOT values for voiced items.
Among the studies that have documented sex differences in VOT, the general pattern suggests that females produce longer VOT values than males (Swartz Reference Swartz1992, Whiteside & Irving Reference Whiteside and Irving1998, Robb, Gilbert & Lerman Reference Robb, Gilbert and Lerman2005, Wadnerkar, Cowell & Whiteside Reference Wadnerkar, Cowell and Whiteside2006). Whiteside, Henry & Dobbin (Reference Whiteside, Hanson and Cowell2004), in a developmental study on British English boys and girls, reported the same differences in VOT as found for adults. Whiteside, Hanson & Cowell (Reference Whiteside, Henry and Dobbin2004) studied the effects of menstrual cycle phase and sex on VOT. Wadnerkar et al. expanded the Whiteside et al. (Reference Whiteside, Hanson and Cowell2004) study and examined VOT production of English plosives from speech samples of 15 women and 20 men. Women were tested at two points in the menstrual cycle and men were tested once. Their study indicated a role for activational ovarian hormones in regulating temporal features of speech. Ryalls, Zipprer & Baldauff (Reference Ryalls, Zipprer and Baldauff1997) studied voice onset time production of equal numbers of males and females and equal numbers of African Americans and Caucasian Americans. They showed that females produced longer VOTs for voiceless plosives and smaller negative VOTs for voiced plosives. However, some scholars have reported longer VOT values in males (Smith Reference Smith1978) and in some cases no differences were reported between males and females (Sweeting & Baken Reference Sweeting and Baken1982). Morris et al. (Reference Morris, McCrea and Herring2008) performed a comprehensive study on 80 young adult male and female speakers of English producing CV syllables in a controlled phonetic environment and controlled tempo situation. They found no significant difference of VOT values according to gender of participants. They concluded that there is no need to control speaker sex in future studies utilizing VOT in isolated syllables (Morris et al. Reference Morris, McCrea and Herring2008: 316).
It should be noted that different experimental designs taking into account nonlinguistic factors such as age of participants, tempo of speech, or menstrual cyclicity and hormonal factors, and using linguistic factors such as syllables, words, phrases or sentences as well as vowel context and place of articulation or even sociolinguistic factors may be among the reasons for the different results obtained in the above studies (for further discussion see Morris et al. Reference Morris, McCrea and Herring2008).
4 Fundamental frequency
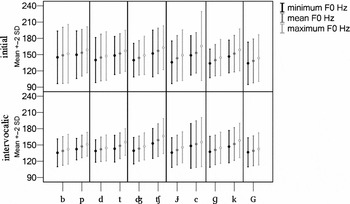
Figure 17 displays means and standard deviations for three F0 (Hz) values (minimum, maximum and mean) for each stop category in initial and intervocalic positions. The values are from the first four glottal cycles.
F0 (Hz) results for initial (top) and intervocalic (bottom) stops.

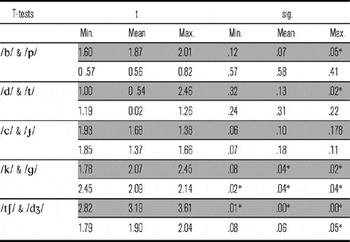
Two independent sample T-tests were performed to compare the mean difference of each phonologically voiced–voiceless category in initial and intervocalic positions. Three separate tests were performed for minimum, mean and maximum values of each category. Table 8 represents detailed statistics for the tests.
T-test results for F0 (Hz) values between voiced and voiceless pairs in initial and intervocalic positions. Statistics for initial position for each pair are shown in grey. Significant differences marked with an asterisk. df = 28 in all cases.

For initial position, the tests showed a significant differences between minimum, maximum and mean F0 (Hz) values of [tʃ] and [dʒ], between mean and maximum values of [k] and [ɡ] and finally between maximum values of [b] and [p] as well as [d] and [t]. For intervocalic position, all the differences were not significant excepting those of minimum, maximum and mean values of [k] and [ɡ] and maximum values of [tʃ] and [dʒ].
Previous studies reported that F0 after voiceless stops is higher than after voiced stops (Lehiste & Peterson Reference Lehiste and Peterson1961, Haggard et al. Reference Haggard, Ambler and Callow1970, Kohler Reference Kohler1982, Ohde Reference Ohde1984). For voiced stops, speakers keep the vocal folds slack to facilitate voicing, and slack folds tending to produce a lower F0, but speakers tense the vocal folds for voiceless stops to prevent them from vibrating too early, and tense folds tend to vibrate faster when they do start, giving a higher F0 (Kingston, Diehl, Kirk & Castleman Reference Kingston, Diehl, Kirk and Castleman2008). The cricothyroid (CT) muscle is responsible for the longitudinal tension (stiffening/slackening) of the vocal folds. Löfqvist, Baer, McGarr & Story (Reference Löfqvist, Baer, McGarr and Story1989) studied the control of voicing and voicelessness with particular reference to the role of changes in the longitudinal tension of the vocal folds, as indicated by cricothyroid muscle activity. They found a higher level of CT activity for voiceless consonants and also a higher F0 value after them.
Unsurprisingly, the data presented in figure 17 show that the F0 values of voiceless tokens are higher than those of voiced ones in each voiced–voiceless category, but at some places of articulation the differences were small and not significant. Meanwhile, examination of the error bars reveals that there is a large overlap in the distribution of F0 in each voiced–voiceless category and in none of the cases was the difference higher than the standard deviation. These results suggest that F0 is not the major cue distinguishing the two stop categories in SCP. Heselwood & Mahmoodzadeh (Reference Heselwood and Mahmoodzade2007) also studied the rate of vocal fold vibration in Persian by measuring (Fx) values at the onset of the vowels after [d t dʒ tʃ]. They compared the difference between [d] and [t] as well as [tʃ] and [dʒ] and concluded that the vocal fold vibration at the vowel onset following [d] is slower than [t] but the difference between [tʃ] and [dʒ] was not significant. Their box-plots also revealed a large overlap between voiced–voiceless categories.
In order to examine the correlation between F0 and VOT parameters, Spearman ρ correlation test were performed for initial and Pearson correlation test for intervocalic stops. The nonparametric test was adopted in initial position since the data were not normally distributed. The tests revealed that there is a significant and positive correlation between VOT and F0 in initial position (Spearman Rho correlation = .351, p < .001). The correlation between these two parameters in intervocalic position was also positive and significant (Pearson correlation = .209, p < .01).
Many studies focusing on the trading relation between F0 and VOT demonstrated that there are interactions between parameters (e.g. Fitch, Halwest, Erickson & Liberman Reference Fitch, Halwest, Erickson and Liberman1980). But to show the actual interaction between two factors it would be necessary to perform perceptual analysis in order to compare sensitivity to differences between pairs of stimuli in which the values of these dimensions are positively versus negatively correlated (Kingston et al. Reference Kingston, Diehl, Kirk and Castleman2008: 51). The positive correlation between F0 and VOT does not, of course, mean that F0 has a perceptual role in the identification of voiced and voiceless stops in SCP.
5 Conclusion
The purpose of this study was to examine VOT characteristics in the phonological distinction between voiced and voiceless stops of Standard Contemporary Persian. We also investigated the effect of place of articulation, vowel context and sex of speakers on VOT values. Fundamental frequency was also investigated as a further acoustic correlate of stop consonant voicing.
The general conclusion of this study is that VOT is strongly correlated with voicing contrast in SCP. It was found that bilabial voiced stop were more often produced with prevoicing while other voiced stops were mostly produced with a short voicing lag. Therefore, the two voicing categories are differentiated in production by the presence or absence of aspiration for most of the places of articulation in initial position. In this way, the voicing contrast in stop consonants can be represented by the {vl.unasp.} and {vl.asp} categories and eventually by the [±spread glottis] phonetic feature under the release node of stop categories in initial position (see figure 1). The two voicing categories in intervocalic position would be {voiced} and {vl.asp.}. This means that [±voice] phonetic feature under the closure node and/or [±spread glottis] phonetic feature under the release node represent the [±voice] phonological contrast in this position.
It has been shown that VOT varies with the place of articulation. Palatals had longer VOTs than dentals, and dentals had longer values than bilabials. The uvular and velars, however, did not fall into the general pattern that VOT values increase as the place of articulation moves from anterior to posterior position in the vocal tract. For voiceless stops, vowel context also affected VOT values but the only significant difference was due to high vowels which had the effect of lengthening the VOT on the preceding stop. Moreover, examining sex differences in the VOT values displayed a slight interaction between voicing and sex factors. For voiced stops females produced higher VOT values, but for voiceless items the sex difference was not significant.
An experiment on F0 revealed that it is not a major cue for distinguishing voiced and voiceless stop categories in SCP. The study also showed a significant and positive correlation between VOT and F0.
Acknowledgements
We thank Dr. Karine Megerdoomian for editing this article. We also wish to sincerely thank Adrian Simpson and three anonymous reviewers for helpful comments.
Appendix
Initial position items
Intervocalic position items
(Stops under investigation are underlined)