INTRODUCTION
Surface exposure dating has unlocked the chronologies of the largest late Quaternary ice advances in New Zealand and permitted an important debate on the timing and climate forcing of glacial advances, including inter-hemispheric climate teleconnections (e.g., Shulmeister et al., Reference Shulmeister, Fink and Augustinus2005, Reference Shulmeister, Fink, Hyatt, Thackray and Rother2010a; Schaefer et al., Reference Schaefer, Denton, Barrell, Ivy-Ochs, Kubik, Andersen, Phillips, Lowell and Schlüchter2006; Barrows et al., Reference Barrows, Juggins, DeDeckker, Calvo and Pelejero2007; Reference Barrows, Almond, Rose, Fifield, Mills and Tims2013; Putnam et al., Reference Putnam, Schaefer, Denton, Barrell, Birkel, Andersen, Kaplan, Finkel, Schwartz and Doughty2013; Rother et al., Reference Rother, Fink, Shulmeister, Mifsud, Evans and Pugh2014; Doughty et al., Reference Doughty, Schaefer, Putnam, Denton, Kaplan, Barrell, Andersen, Kelley, Finkel and Schwartz2015). A significant limitation of surface exposure dating of moraines is that only the very largest advances and the recessional sequence of moraines are preserved, because moraines associated with advances of intermediate size are removed or buried by subsequent advances. The presence of thick packages of glacial and paraglacial sediments preserved in valleys on the eastern side of the Southern Alps has long been recognised (e.g., Speight, Reference Speight1926). Stratigraphic work, supported by infrared stimulated luminescence (IRSL) dating, has confirmed that these outcrops contain evidence of multiple late Quaternary ice oscillations and has permitted the recognition of numerous individual advances (e.g., Rother et al., Reference Rother, Shulmeister and Reiser2010; Shulmeister et al., Reference Shulmeister, Thackray, Rieser, Hyatt, Rother, Smart and Evans2010b; Hyatt et al., Reference Hyatt, Shulmeister, Evans, Thackray and Rieser2012). This stratigraphic work has highlighted evidence of advances, nearly as substantial in extent as the Marine Oxygen Isotope Stage (MIS) 6 and 2 maximum ice advances, commonly preserved in valley stratigraphies (e.g., Shulmeister et al., Reference Shulmeister, Thackray, Rieser, Hyatt, Rother, Smart and Evans2010b).
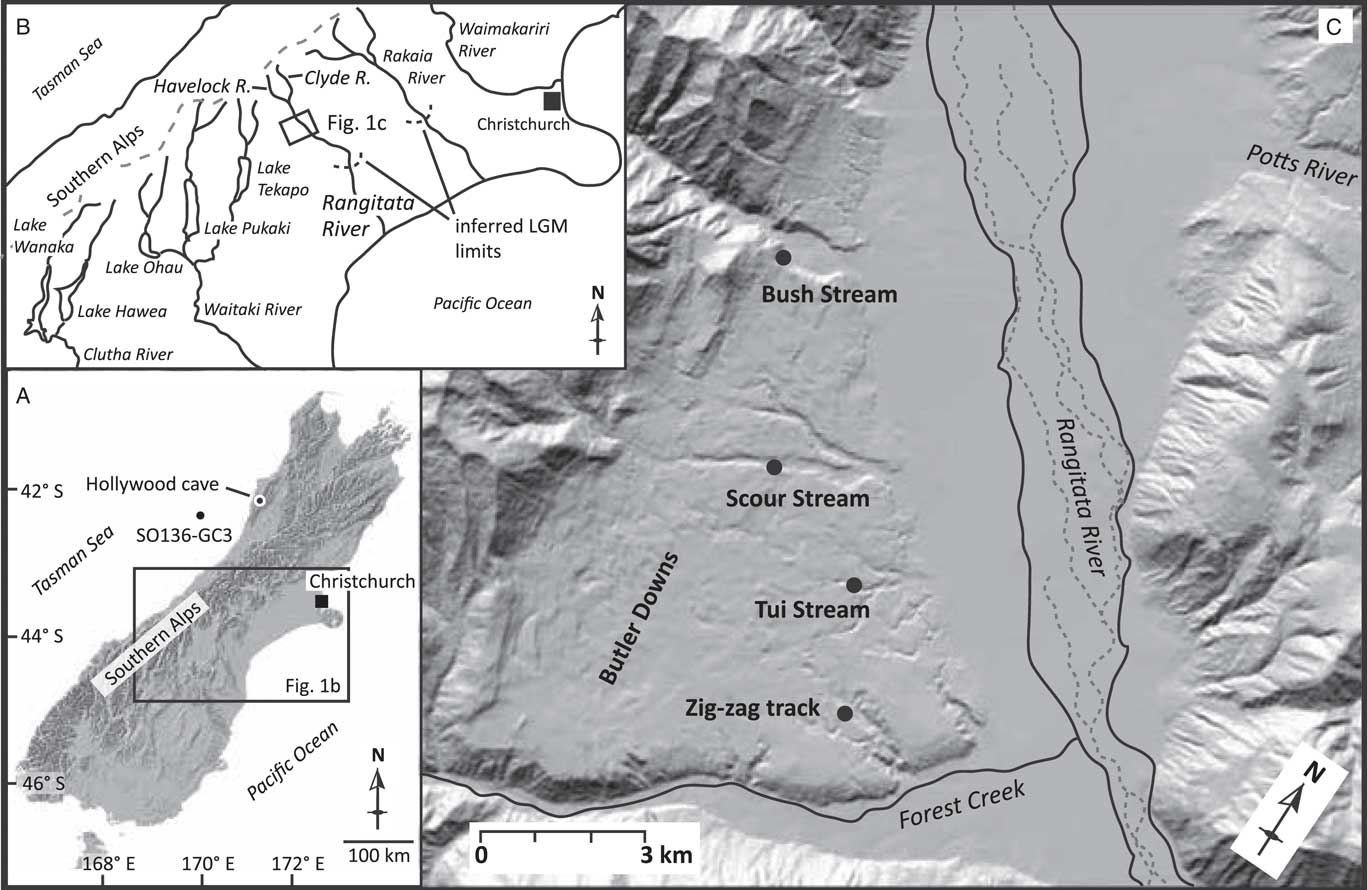
This paper examines sedimentary sequences in a tectonic basin 17 km upstream from the Canterbury Plains in the Rangitata Valley, South Canterbury, in a location likely to record glaciations of intermediate extent (Fig. 1). The purpose of the paper is to decipher the nature of glaciation in these valley systems, to provide age constraint for late-Pleistocene glacial advances, and to investigate broader questions of paleoclimatic conditions through the last glacial cycle.
Location map. (A) South Island of New Zealand with the locations of marine core SO136-GC3 (Barrows et al., Reference Barrows, Juggins, DeDeckker, Calvo and Pelejero2007) and Hollywood Cave (Whittaker et al., Reference Whittaker, Hendy and Hellstrom2011) marked. These are sites of comparison for our records. (B) General overview of central South Island with field area marked as a box. The curved dashed lines along the Rangitata and Rakaia rivers represent the glacial limits and the dashed line running along the Southern Alps marks the divide. (C) Digital elevation model (DEM) of the middle Rangitata with the four sections marked.

Geological and tectonic setting
The high topography and active tectonics of the Southern Alps of New Zealand are a product of Late Tertiary to modern oblique thrust faulting inboard of the main plate boundary along the Alpine Fault (e.g., Koons, Reference Koons1994). The front ranges in Canterbury are inferred to be less than 1 Ma old (e.g., Nichol et al., Reference Nichol, Alloway and Tonkin1994), uplifted due to the southward shift of faulting, and uplift into the Canterbury region during the latter part of the Quaternary. Following this general pattern, the broad structural valley in the middle Rangitata River valley, where this study is focused, has seen reduced tectonic activity in the latest Quaternary (Upton et al., Reference Upton, Craw, James and Koons2004). Bedrock geology of the region is dominantly Torlesse Supergroup greywackes that were uplifted and deformed during the late Mesozoic Rangitata Orogeny and the late Tertiary to modern Kaikoura Orogeny. Intervening subsidence produced shallow water marine sediments that locally cap Torlesse greywackes (e.g., Coates, Reference Coates2002).
The Rangitata River is a braided river that drains the glaciated highlands of the Southern Alps and is formed by the junction of the Clyde and Havelock rivers (Fig. 1). Like many of the east-flowing rivers, it forms a major (900 km2) alluvial fan on the Canterbury Plains (Barrell et al., Reference Barrell, Forsyth and McSaveney1996) downstream of an incised bedrock gorge where the river has cut through the rising front ranges. Upstream of this gorge, the river displays a braided morphology and occupies a broad and deep, formerly glaciated trough that is partly filled with late Quaternary sediments. About 17 km inland of the gorge, this broad structural valley opens to the west, where movement on the Forest Creek Faults has created an intermontane basin, occupied by the Butler and Brabazon downs (Upton et al., Reference Upton, Craw, James and Koons2004). Glacial sediments from major, earlier ice advances have been preserved in this reach due to the greater valley width, despite being overrun by later advances. This study examines the stratigraphic sequences exposed in this portion of the Rangitata valley (Fig. 1).
Glacial geology and geomorphology
Previous works on glacial limits within the region include the pioneering work of Speight (1941) and more recent mapping by Mabin (Reference Mabin1980, Reference Mabin1987) and Oliver and Keene (Reference Oliver and Keene1989, Reference Oliver and Keene1990). The nomenclature for glacial advances used here follows Mabin’s scheme. He determined that ice flowed down the main Rangitata Valley and beyond the Rangitata Gorge, and that the distributary Clearwater Lobe flowed south-eastward at the modern mouth of the Potts River (Fig. 1) and into the Ashburton Basin. Cosmogenic surface exposure dating indicates that the surface geomorphology largely formed during the MIS 3-2 retreat of the Clearwater Lobe (Rother et al., Reference Rother, Fink, Shulmeister, Mifsud, Evans and Pugh2014). Previous age control in the main Rangitata Valley is limited, but last glacial maximum (LGM) ice limits have been inferred to lie downstream of the Rangitata Gorge (Mabin, Reference Mabin1980).
This study
The Butler and Brabazon downs comprise a broad valley shoulder that bears remarkably well-preserved glacial geomorphology (Borsellino et al., Reference Borsellino, Shulmeister and Winkler2017). The landforms preserve detailed records of ice recession within the Rangitata valley upstream of the Rangitata Gorge. Landforms include numerous kame terraces, meltwater channels, terminal and lateral moraines, and extensive areas of kame and kettle topography. Post-glacial tributary stream incision has exposed extensive sedimentary outcrops of glacial and pro-glacial origin. This paper presents sedimentological and stratigraphic descriptions from stream sections in the Butler and Brabazon downs. Stratigraphic evidence and optically stimulated luminescence (OSL) age control provide a detailed history of ice occupation and proglacial environments in this intermontane section of the Rangitata system.
Note on terminology
In this paper we use the term LGM on its own to refer to the global glacial maximum at the end of the last ice age (i.e., 26.5–19 ka per Clark et al., Reference Clark, Dyke, Shakun, Carlson, Clark, Wohlfarth, Mitrovica, Hostetler and McCabe2009). A glacial advance in the low 30 ka to high 20 ka timeframe is now widely recognised as the most extensive advance in New Zealand in the latter half of the last glaciation (Rother et al., Reference Rother, Fink, Shulmeister, Mifsud, Evans and Pugh2014) and this is consistent with the regional climate stratigraphy (Alloway et al., Reference Alloway, Lowe, Barrell, Newnham, Almond, Augustinus and Bertler2007), which recognises a broader stadial period in New Zealand from c. 32–18 ka. We use the term New Zealand last glacial maximum (NZ LGM) for that period.
METHODS
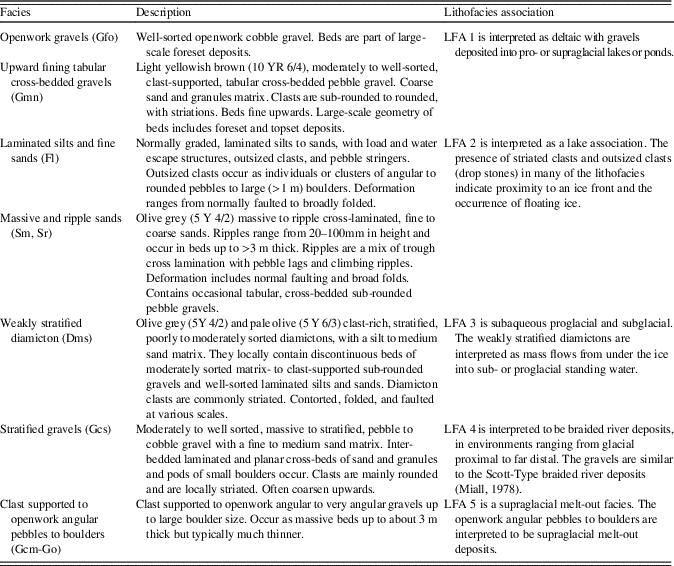
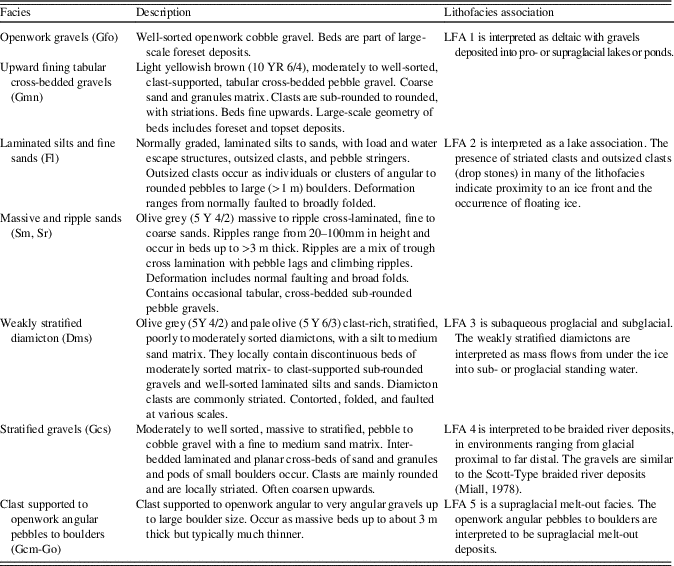
Sediment exposures were logged using standard field techniques and measurements (unit thickness, bedding, structures, texture, fabric measurements, roundness, orientation, and color). There is a wealth of sedimentological and stratigraphic detail available but here we provide concise descriptions of the lithofacies and lithofacies associations in order to facilitate the summarization of major sedimentological packages and their relevance to the local tectonic and climate history. Lithofacies codes (see Table 1) follow Evans and Benn (Reference Evans and Benn2004), as developed from earlier work (e.g., Eyles et al., Reference Eyles, Eyles and Miall1983), and the methods are based on our lithofacies work in the Rakaia Valley (Shulmeister et al., Reference Shulmeister, Thackray, Rieser, Hyatt, Rother, Smart and Evans2010b; Hyatt et al., Reference Hyatt, Shulmeister, Evans, Thackray and Rieser2012). Sites were located using a combination of a hand-held Garmin Etrex GPS, Google Earth images, and the New Zealand Topographic series 1:50,000-scale map (NZ Topo50, BX-18, Lake Clearwater sheet).
Lithofacies and lithofacies associations of the middle Rangitata Valley. Facies based on Eyles et al. (Reference Eyles, Eyles and Miall1983), as modified by Hyatt et al. (Reference Hyatt, Shulmeister, Evans, Thackray and Rieser2012).
Luminescence methods
Age control for the sedimentary sequences was obtained using OSL (Huntley et al., Reference Huntley, Godfrey-Smith and Thewalt1985) dating of quartz sand, as deposits lacked organic material for radiocarbon dating. While OSL dating can be challenging in fluvial and pro-glacial environments, deposits from these settings can be accurately dated on a case-by-case basis by selecting depositional facies that indicate that the sediments were likely to have been reset by sunlight exposure (e.g., Fuchs and Owen, Reference Fuchs and Owen2008; Rittenour, Reference Rittenour2008; Wyshnytzky et al. Reference Wyshnytzky, Rittenour, Nelson and Thackray2015). We preferentially targeted well-sorted, rippled, and horizontally bedded sand lenses from lacustrine and ice-distal outwash deposits to reduce the influence of incomplete resetting (partial bleaching) of the luminescence signal (Table 1). Two of the nine OSL samples, however, were collected from non-ideal deposits, namely sand lenses from ice-proximal outwash and stratified diamicton (Dms; Table 2), and demonstrate the importance of the correct selection of depositional facies for OSL sampling.
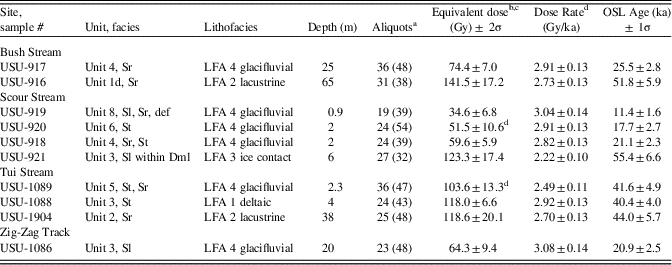
Luminescence age results.
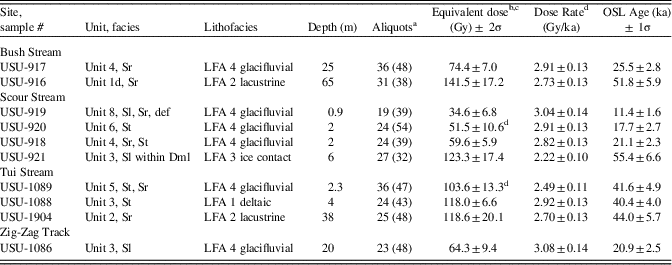
a Number of aliquots used for age calculation and total number of aliquots analyzed in parentheses. Rejection criteria include evidence for feldspar contamination (IRSL signal greater than 2× background), corrected signal response >15% between repeat points and >5% signal recuperation on the zero-dose steps.
b Equivalent dose (DE) determined using the single aliquot regenerative dose method (Murray and Wintle, Reference Murray and Wintle2000) on quartz sand. DE values calculated using the central age model (Galbraith and Roberts, Reference Galbraith and Roberts2012) unless noted otherwise.
c See Table 2 for details on dose-rate calculation.
d DE calculated using the minimum age model of Galbraith et al. (2011).
Samples for OSL dating were collected by pounding opaque metal pipes into target horizons within the sediment exposures and sealing the ends of the tightly packed tubes to prevent light exposure and sediment mixing. Samples were sent to the Utah State University Luminescence Laboratory for processing to purified quartz separates for analysis. Samples were treated with dilute hydrochloric acid and chlorine bleach to remove carbonates and organics followed by heavy mineral separation (sodium polytungstate, 2.7 g/cm3) and treatment in concentrated hydrofluoric acid to remove feldspars and etch the quartz grains. The purity of the quartz separates was checked by monitoring their response to infrared stimulation; contaminated aliquots were not used for age calculation.
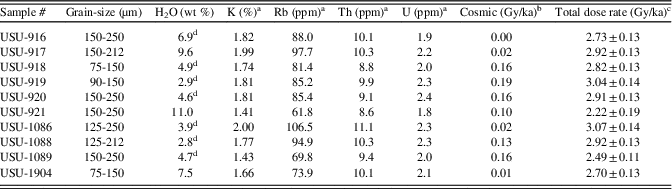
Samples for environmental dose-rate determination were collected from a 30-cm-diameter area surrounding the OSL sample tube. Sediments were homogenized and representative samples were analyzed for radioisotope concentration using ICP-MS and ICP-AES techniques (Table 3). These concentration values were converted to dose rate following the conversion factors of Guérin et al. (Reference Guérin, Mercier and Adamiec2011) and beta attenuation values of Brennan (Reference Brennan2003). Sediments collected in airtight containers were then dried to determine in situ water content. Contribution of cosmic radiation to the dose rate was calculated using sample depth, elevation, and latitude/longitude following Prescott and Hutton (Reference Prescott and Hutton1994). Total dose rates were calculated based on water content, radioisotope concentration, and cosmic contribution (Adamiec and Aitken, Reference Adamiec and Aitken1998; Aitken, Reference Aitken1998).
Dose-rate data for luminescence samples.
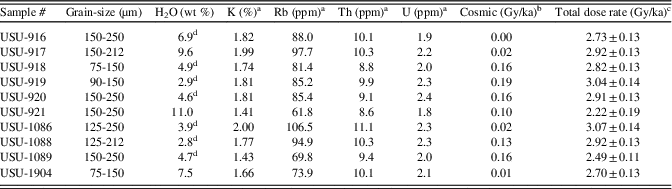
a Elemental analysis using ICP-MS/ICP-AES.
b Cosmic dose rate calculated using the Prescott and Hutton (Reference Prescott and Hutton1994).
c Total dose rate is calculated using conversion factors of Guérin et al. (Reference Guérin, Mercier and Adamiec2011) and beta attenuation values of Brennan et al. (2003) and includes cosmic contribution and attenuation by water.
d Water content assumed to be 7 ± 3% for samples with low in-situ water content due to affects of outcrop drying.
Small aliquots (50–200 grains) of quartz sand were analysed using the single-aliquot regenerative-dose (SAR) technique (Murray and Wintle, Reference Murray and Wintle2000) on Risø OSL/TL DA-20 luminescence readers with blue-green (470 nm, 36 W/m2) stimulation and detection through 7.5-mm UV filters (U-340). Stimulation was conducted at 125°C following 240°C preheats (10 s) for regenerative and natural doses. OSL ages were calculated from 28–41 aliquots that passed rejection criteria related to feldspar contamination (IRSL signal to background ratio >2) and performance related to repeat-point (>15% difference) and zero-dose tests (>5% signal recuperated). Equivalent dose (DE) values were calculated using either the central age model (CAM) or minimum age model (MAM) of Galbraith and Roberts (Reference Galbraith and Roberts2012). Samples with evidence of partial bleaching as indicated by significant positive skew (USU-920 and USU-1089) were calculated using the minimum age model.
RESULTS
Chronology
All luminescence data are presented in Tables 2 and 3 and DE distributions are presented in Supplementary Data 1. Luminescence ages range from ~60 to 11 ka (Table 2). Although there is modest scatter in the OSL analyses (over dispersion values of 19–37%), results suggest that most samples were reset prior to burial. Two samples (USU-920 and USU-1089) showed signs of partial bleaching as evidenced by positive skew, and were analyzed using a minimum age model. Both of these samples were collected from ice-proximal fluvial deposits. The remaining eight samples were analyzed using a central age model (Galbraith and Roberts, Reference Galbraith and Roberts2012).
OSL ages from each site are in stratigraphic order within 1-sigma error, except for one apparent stratigraphic reversal. This occurred at the Tui Steam site (discussed below) where, although sample USU-1089 was analyzed with a minimum age model to minimize effects of partial bleaching, the midpoint of the reported age is out of sequence with sample USU-1088, below. These ages, however, are indistinguishable within 1-sigma. The ability to obtain reliable OSL ages from these ice-proximal glacial settings stems from careful sample selection and use of small-aliquot (~200 grains) dating of quartz sand, which has the ability to reset within seconds of sunlight exposure (Godfrey-Smith et al., Reference Godfrey-Smith, Huntley and Chen1988).
Stratigraphic sections
Four major stratigraphic exposures within the Butler Downs of the middle Rangitata Valley are presented in this paper as evidence for pre-LGM and syn-LGM ice advances in the valley. A brief description of each outcrop is provided below, utilizing the lithofacies (abbreviated facies codes given in text) and lithofacies associations described in Table 1. These outcrops are more fully described in Supplementary Data 2–5. The main lithofacies associations (LFA) are: deltaic sands and gravels (LFA 1); lake sediments (LFA 2); subglacial to proglacial subaqueous deposits (LFA 3); braided river sands and gravels (LFA 4); and supraglacial melt-out deposits (LFA 5). Outcrops are described from northwest to southeast (upvalley to downvalley).
Bush Stream section
Description
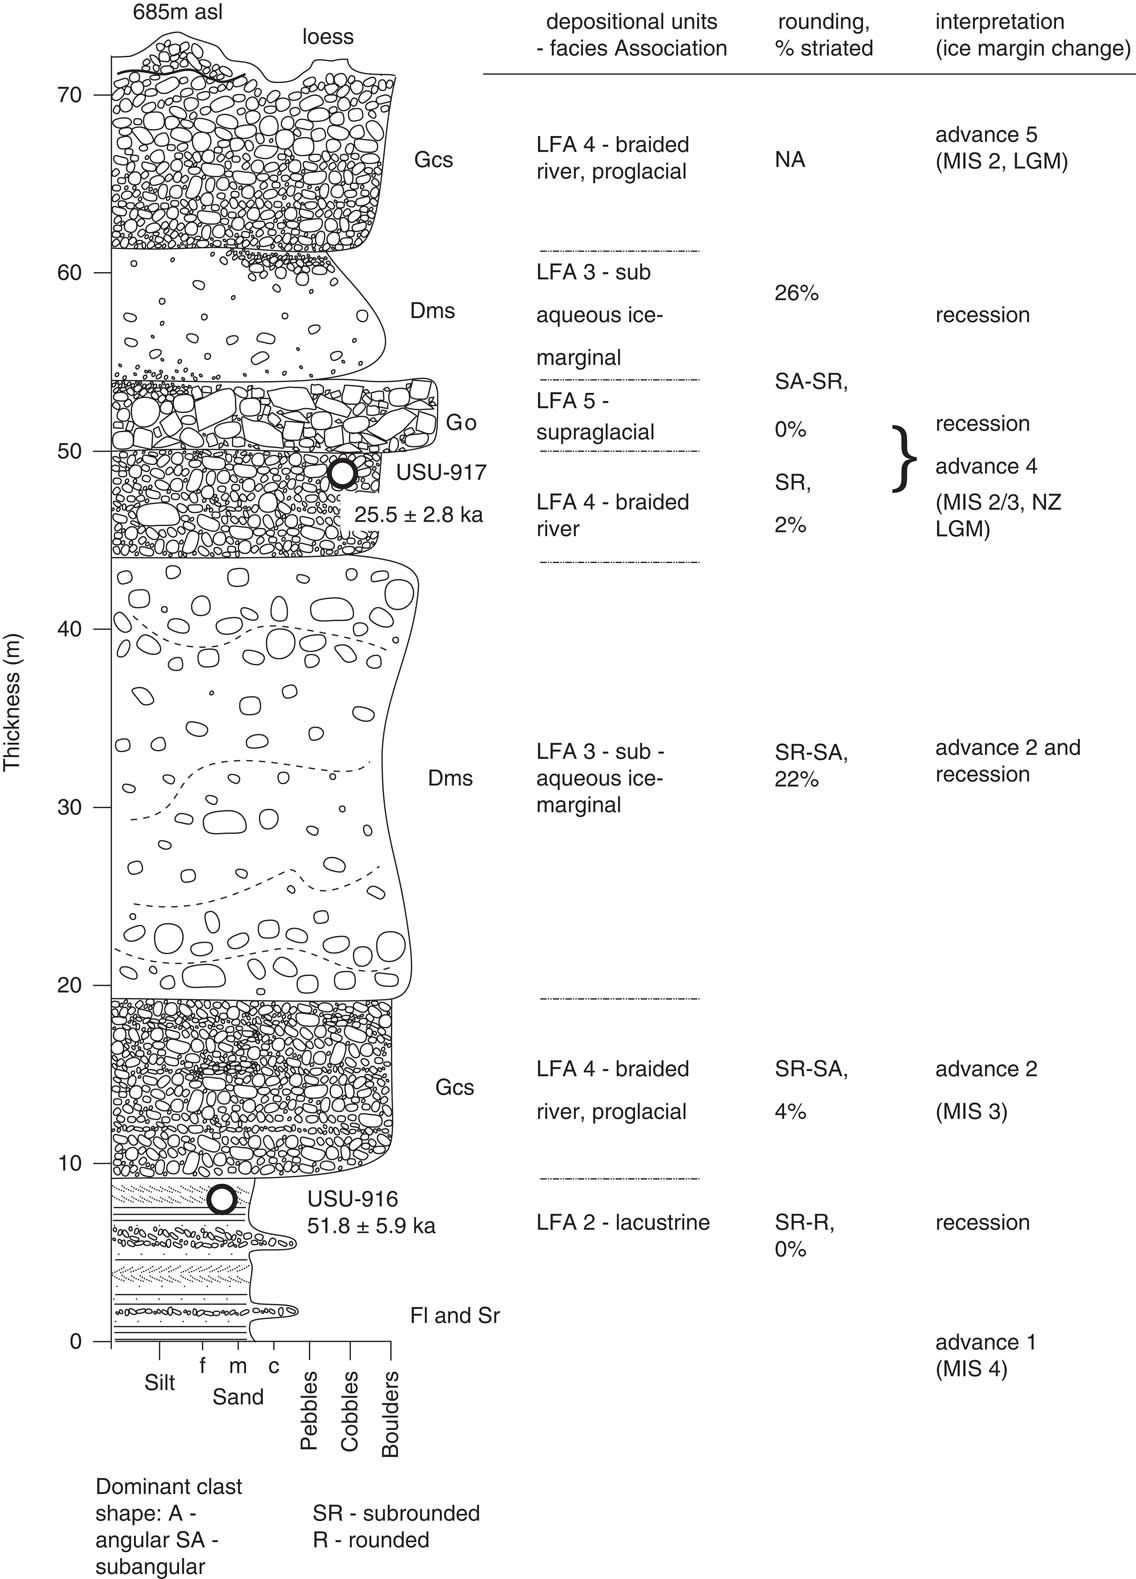
The Bush Stream section (Fig. 1) was described from two adjacent outcrop exposures with complementary exposure of and access to the lower and upper stratigraphy. Exposures located at 43.6289°S, 170.8642°E and containing 70 m of sediment subdivided into seven lithofacies (Fig. 2).
Stratigraphic log for Bush Stream.
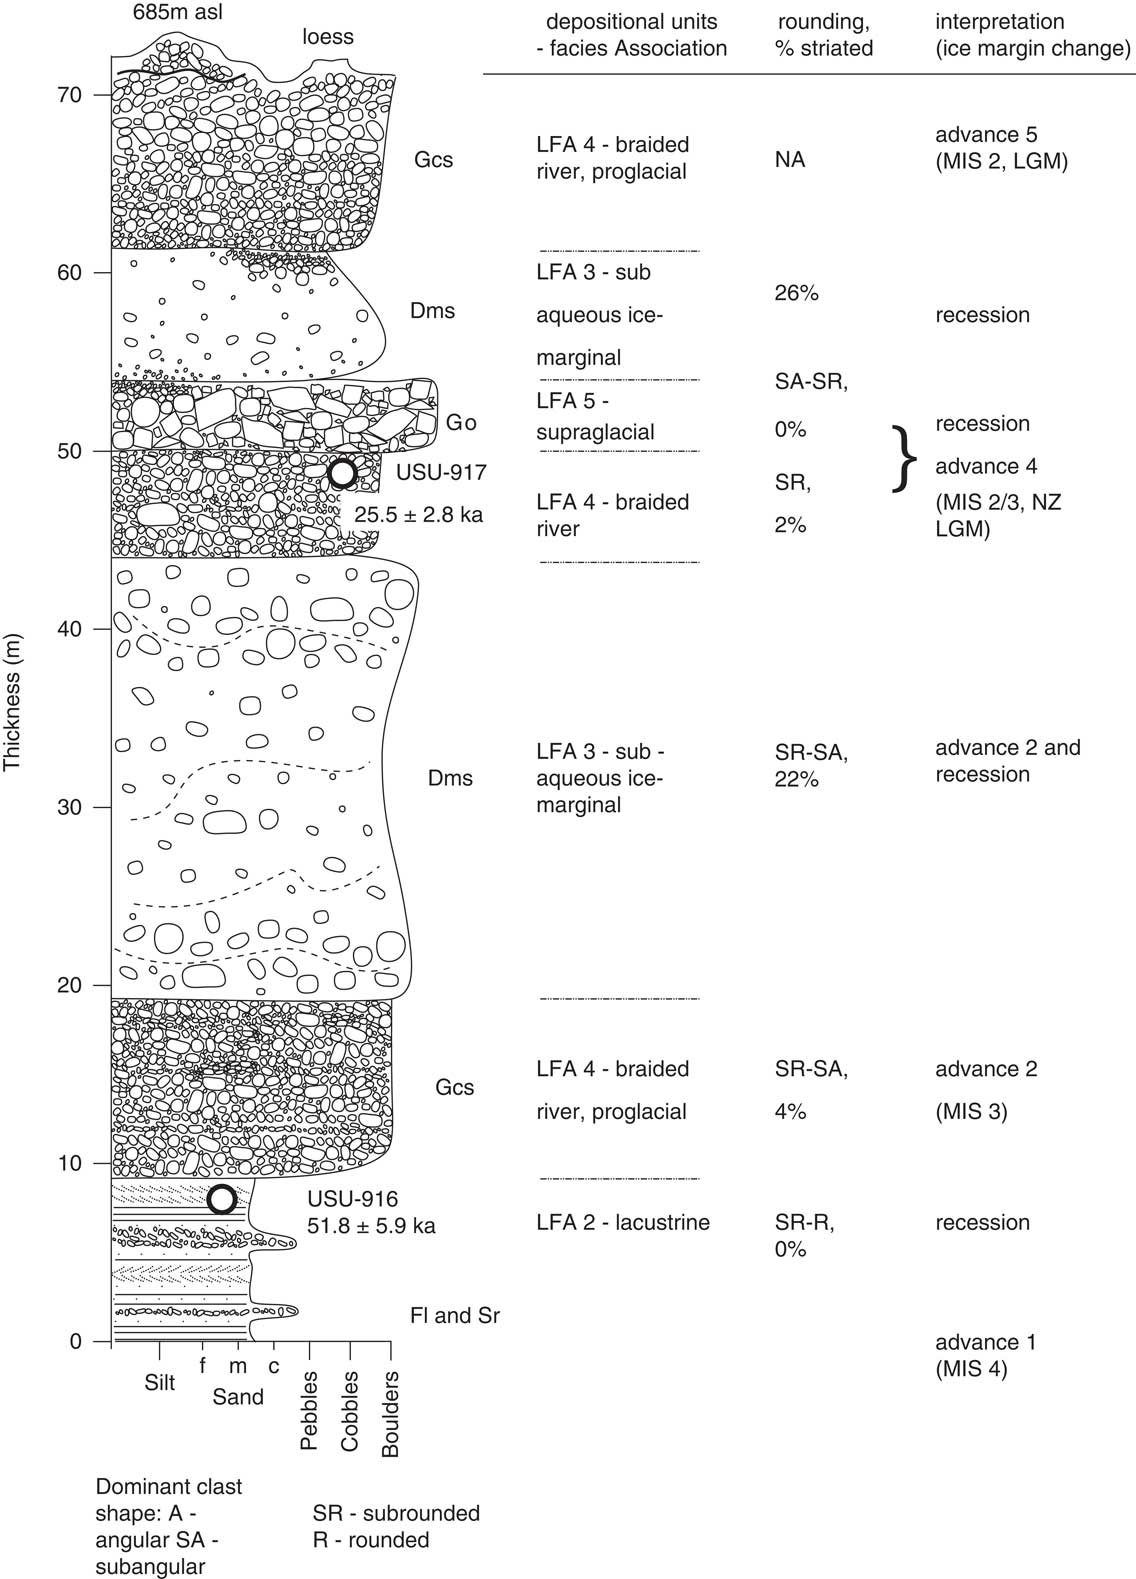
The basal part of the outcrop contains laminated silts (Fl) and trough and ripple cross-laminated silts and sands (Sm, Sr) with interbeds of clast-supported rounded fine gravels (Fig. 2). These lithofacies have a measured thickness of 8.7 m. An OSL sample collected from rippled sands near the top of the beds produced an age of 51.8 ± 5.9 ka (USU-916, Table 1). They are overlain by 10 m of crudely bedded, clast-supported pebble to boulder gravel (Gcs). These gravel are sub-angular to sub-rounded with rare striated clasts (6%) and openwork gravel beds up to 0.3 m thick. Imbrication indicates flow to the southeast.
Above the stratified gravels lie 25 m of weakly stratified cobble to boulder diamicton that displays minor deformation (Unit 3; Fig. 2). Striae are recorded on 12% of clasts. This lithofacies is capped by 6 m of stratified, clast-supported gravel (4% striated/faceted clasts) with rare boulders (Gcs; Unit 4). An OSL sample from a sandy interbed near the top of this lithofacies yielded an age of 25.5 ± 2.8 ka (USU-917, Table 1). The overlying lithofacies comprises 4 m of clast-supported to openwork pebble to boulder (Go) gravel (Unit 5; Fig. 2). Boulders are up to 3 m in diameter and are largely sub-angular. This unit locally grades upward into a thin sub-rounded normally graded clast-supported gravel.
Overlying that gravel is a 7-m-thick stratified pebble-cobble diamicton with a silty/sandy matrix (LFA 3, Fig. 2) of 26% striated and 15% faceted clasts. The top of the outcrop is composed of 8–10 m of clast-supported reverse-graded gravel with large cross-beds near the top (Fig. 2).
Interpretation
Broad-scale observations from the outcrops at Bush Stream suggest that all units are laterally continuous. The lowest lithofacies are interpreted to have been deposited in a pond or shallow lake (LFA 2; Table 1). The laminated silts indicate settling from suspension while the rippled sands and silts reflect periods of traction current flows. These lithofacies are the same as those recognised as representing pro-glacial deposits in the Rakaia Valley to the north (Hyatt et al, Reference Hyatt, Shulmeister, Evans, Thackray and Rieser2012). The absence of striated clasts or drop stones indicates, however, that there was no ice in this section of the valley at the period when the lake was present. Given the lack of local obstructions to form a lake, the lake was likely impounded by glacial deposits at the Rangitata Gorge, ca. 30 km downstream. The OSL age of ca. 52 ka in the top of this unit provides a minimum age for the event that blocked the valley downstream and a maximum age for the overlying glacial and paraglacial sediments.
The overlying stratified gravel is interpreted to be the braided gravels of an outwash-head deposit (LFA 4) and suggests that ice advanced toward the site during the deposition of the unit, as evidenced by the coarseness of the clasts and presence of striae. Similar deposits occur in the Hope (Rother et al., Reference Rother, Jol and Shulmeister2007) and Rakaia (Shulmeister et al., Reference Shulmeister, Thackray, Rieser, Hyatt, Rother, Smart and Evans2010b) valleys. The weakly stratified diamicton above is interpreted to reflect deposition in an ice-marginal pond (LFA 3). These stratified diamicton are very common in New Zealand valley glacier deposits, especially in the major valleys east of the Southern Alps (e.g., Hyatt et al., Reference Hyatt, Shulmeister, Evans, Thackray and Rieser2012; Evans et al., Reference Evans, Rother, Hyatt and Shulmeister2013). The sediments can be deposited either by local failure of glaciolacustrine sediments or by the deformation of such sediments by a local ice advance when the sediments are still saturated. In either case, the diamicton represent sub-aqueous ice marginal settings. The overlying pebble-gravel (Unit 4) lacks striated clasts and is interpreted to represent braidplain aggradation. The aggradation is likely associated with advancing but still distal ice. It is overlain by a supraglacial melt-out deposit (LFA 5) that indicates the retreat of the ice that advanced downvalley at or after ca. 26 ka.
The upper two units at Bush Stream consist of another stratified diamicton, which is, again, interpreted to represent a sub-aqueous ice-contact deposits (LFA 3) most likely formed during ice retreat. The upper braided river gravels (LFA 4) are interpreted to represent a minor head of outwash formed during a subsequent re-advance.
Scour Stream section
Description
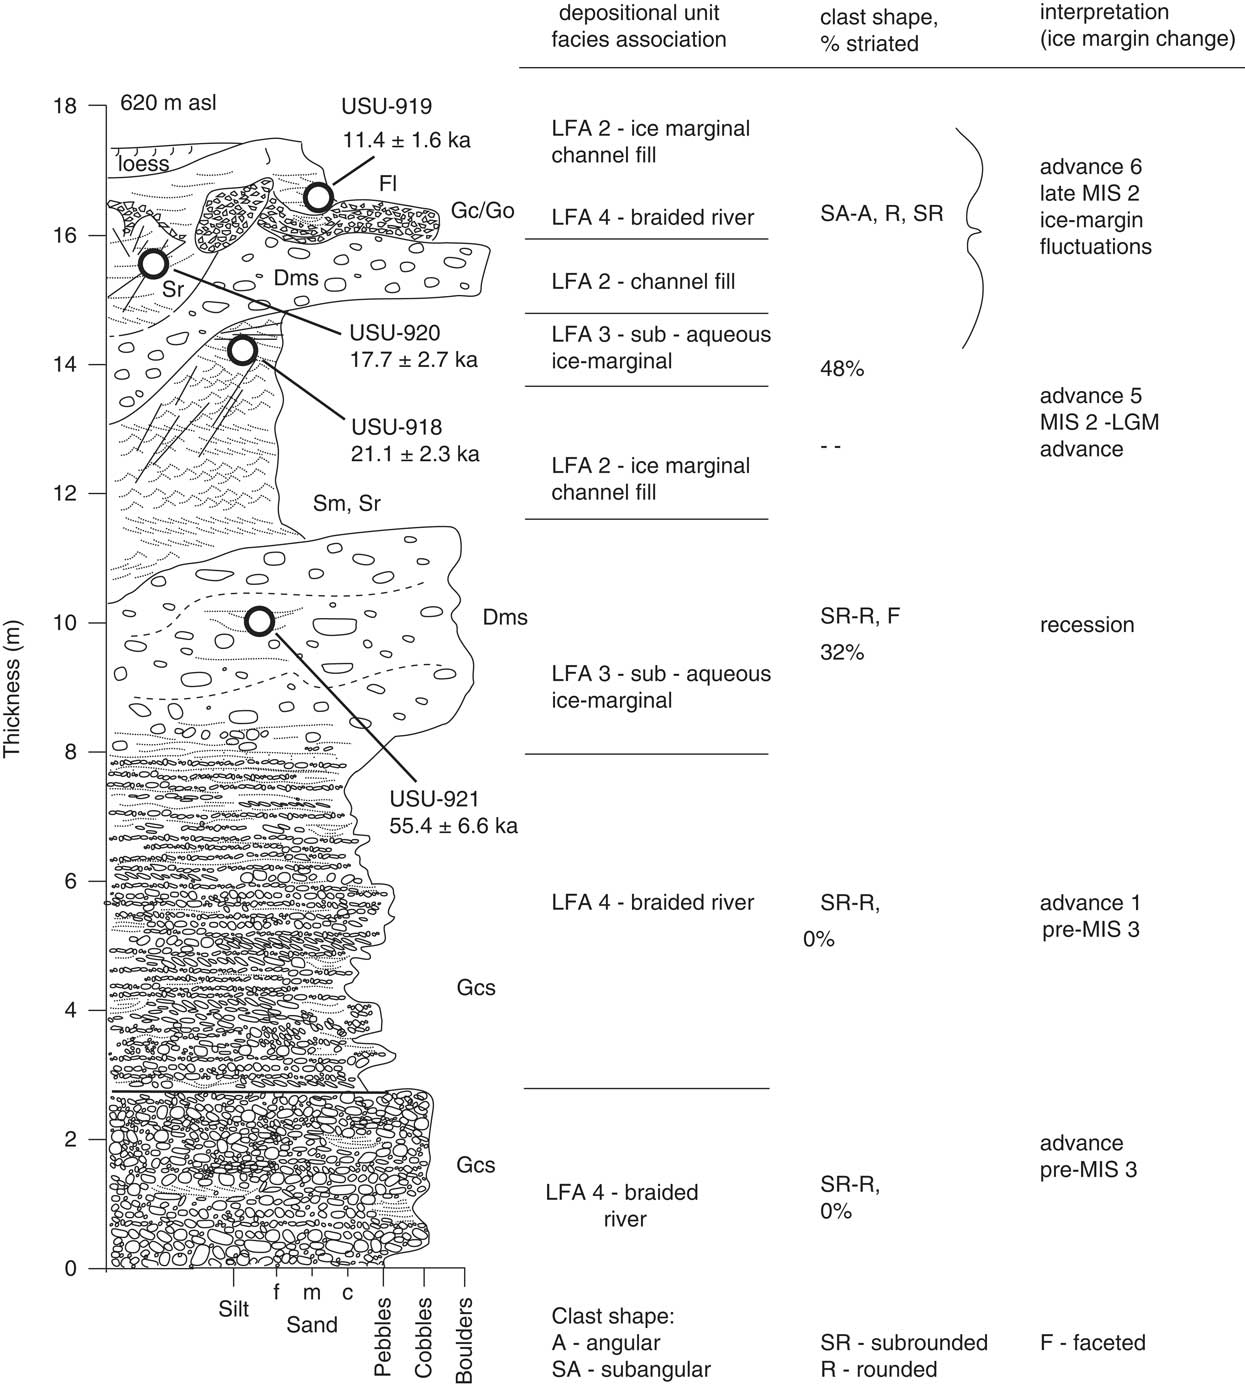
The Scour Stream site is located at 43.6592°S, 170.8835°E (Fig. 1) and comprises exposures along a farm track that climbs out of Scour Stream and onto the terraced Butler Downs. It displays a total of 11.6 m of sediment from which 10 lithofacies are identified (Fig. 3 and Supplementary Material).
Stratigraphic log for Scour Stream.
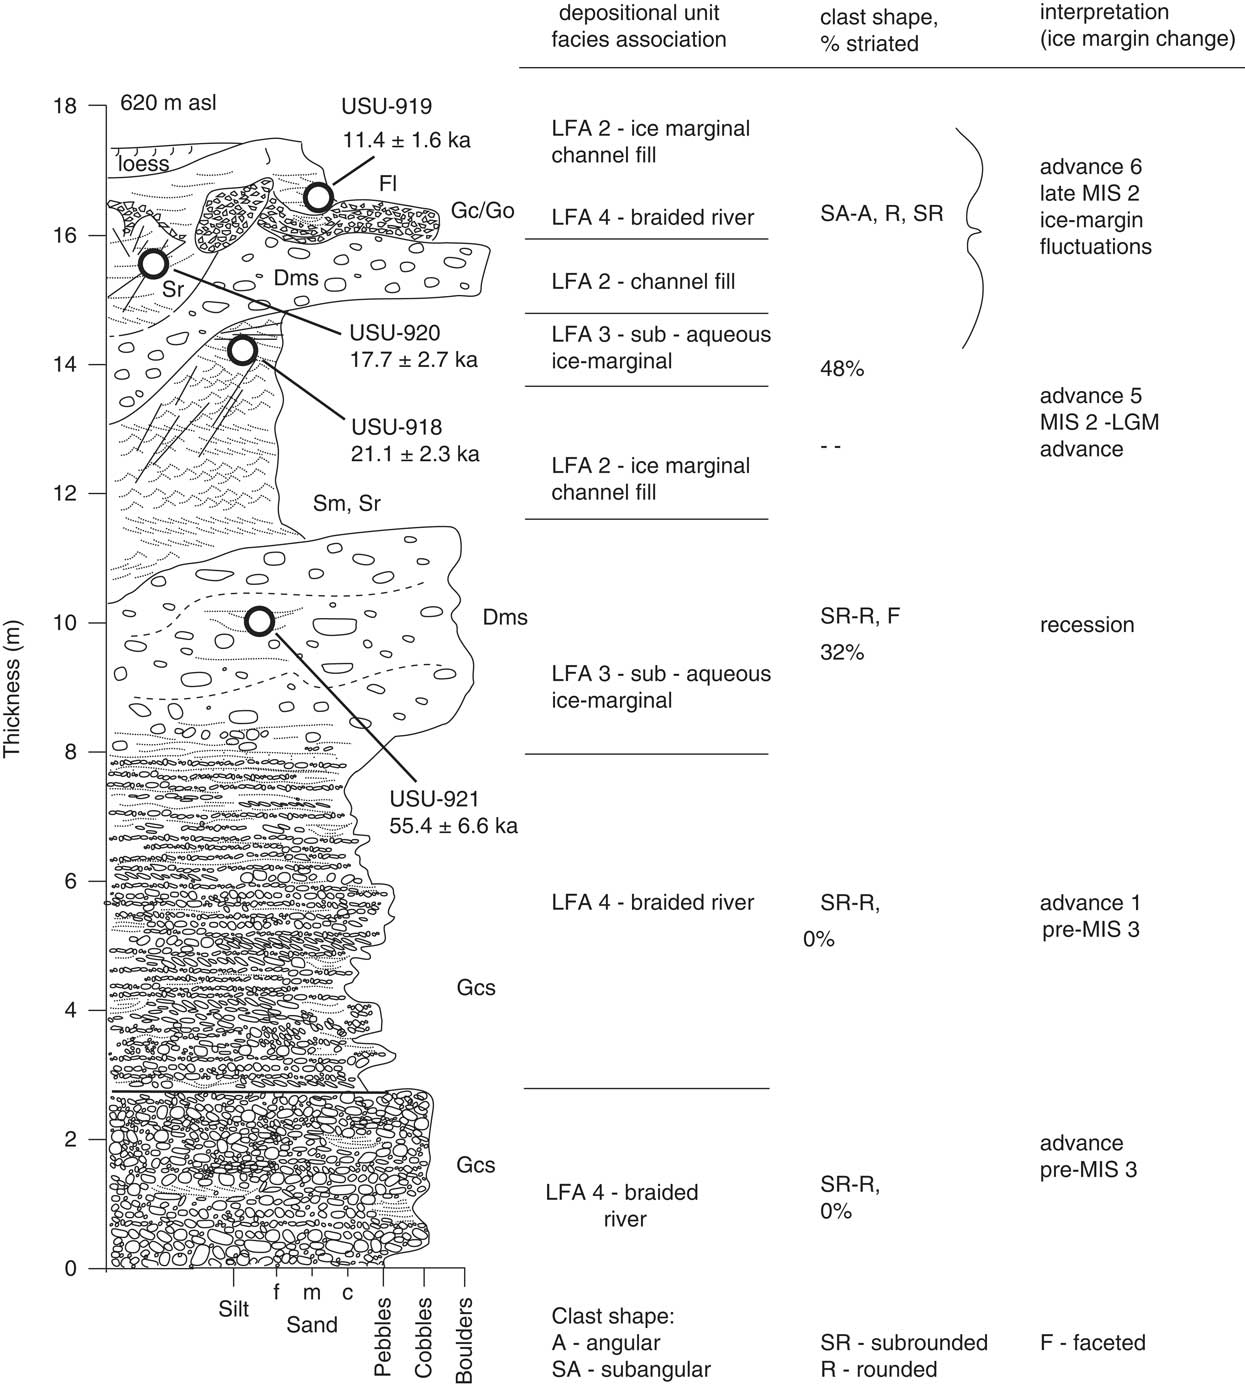
The basal 2.5 m comprises a crudely stratified, clast-supported pebble to cobble gravel (Gcs). Clasts are dominantly sub-rounded to rounded and lack striations. It has a sharp upper contact with an overlying 5.5-m-thick strongly stratified gravel (Gcs) with frequent coarse sand interbeds. Clasts are imbricated to the west-northwest and are again dominantly sub-rounded to rounded. Striations are absent. Sands increase in the top 2 m of this bed.
There is a gradual transition in the top 20 cm to a sandy, weakly stratified diamicton (Dms). The Dms contains many pebbles and cobbles and rare boulders up to 1.5 m in diameter. Clasts are sub-rounded to rounded, notably striated (32%), and many larger clasts are polished and faceted. Small pockets of laminated sand and silt display fine-scale reverse faulting. An OSL sample from a sandy interbed near the top of this unit yielded an age of 55.4 ± 6.6 ka (USU-921). The diamicton is capped by 3.5 m of heavily faulted and sheared, cross-bedded fine to medium sands (Sm, Sr). Shear surfaces at the base of the unit strike between 146° and 182°, while a third distinct shear surface at the top of the unit is flat-lying and appears to be associated with the emplacement of the overlying sediments. The sands yielded an age of 21.1 ± 2.3 ka (USU-918). There is a sharp upper contact to a 1.8-m-thick, sandy pebble diamicton with sand interbeds (Dms). Clasts are commonly striated (48%).
Overlying the diamicton is a medium cross-bedded sand with common high-angle, cm- to dm-scale faults (Sm, Sr). An OSL sample from this sand yielded an age of 17.7 ± 2.7 ka (USU-920). These sands are overlain by up to 0.4 m of clast supported gravels (Gc) with pockets of trough cross-bedded, locally openwork angular pebble gravels, and sand beds with evidence of ductile deformation including load casts. Clasts are much more angular than in the underlying beds. This gravel and a contiguous gravel lag underlie up to 0.70 m of planar-bedded silts and fine sands (Fl). These sands are contorted in the basal 30 cm but become laminated towards the top of the section. Stringers of pebbles occur throughout and mm-to-cm scale deformation is present. An OSL sample from this unit yielded an age of 11.4 ± 1.6 ka (USU-919). The outcrop is capped by loess and soil.
Interpretation
The basal 8 m of the Scour Stream section represents braid-plain deposition (LFA 4) from rivers flowing into the downs. The gravels are likely derived from the main Rangitata Valley, based on imbrication direction and high sediment maturity as reflected in the roundness of the gravels. The absence of striae suggests that ice was distal to the site, but the aggradation suggests a gradual ice advance. The overlying diamicton (LFA 3) represents the arrival of ice at this site near the MIS 4/3 boundary (ca. 55 ka).
There is an unconformity between the diamicton and the overlying ripple bedded sands of LFA 2. All of the overlying sediments, except the loess and soil at the top of the section, relate to ice-marginal conditions during the LGM. The sand units and diamicton relate to glacial-marginal drainages, with the sheet-like diamicton representing slurry flows in the ice-marginal channels. The angular gravels in the upper beds represent deposition of supraglacial debris into the marginal channels. Though the sediments are similar, the OSL results support two separate ice margins at about 21 and 18 ka because a thin aggradation of gravel (LFA 4) stratigraphically separates the sands. The upper-most OSL age (11 ka) is problematic, as it visually appears to be from similar ice marginal sediments, but is younger than the typically inferred timing of glaciation this far down the valley systems and inconsistent with retreat ages from the adjacent and connected Clearwater Valley to the north (Rother et al., Reference Rother, Fink, Shulmeister, Mifsud, Evans and Pugh2014). Its stratigraphic position means that it may reflect a post-glacial surface drainage, flowing along the downs prior to the incision of Scour Stream.
Tui Stream section
Description
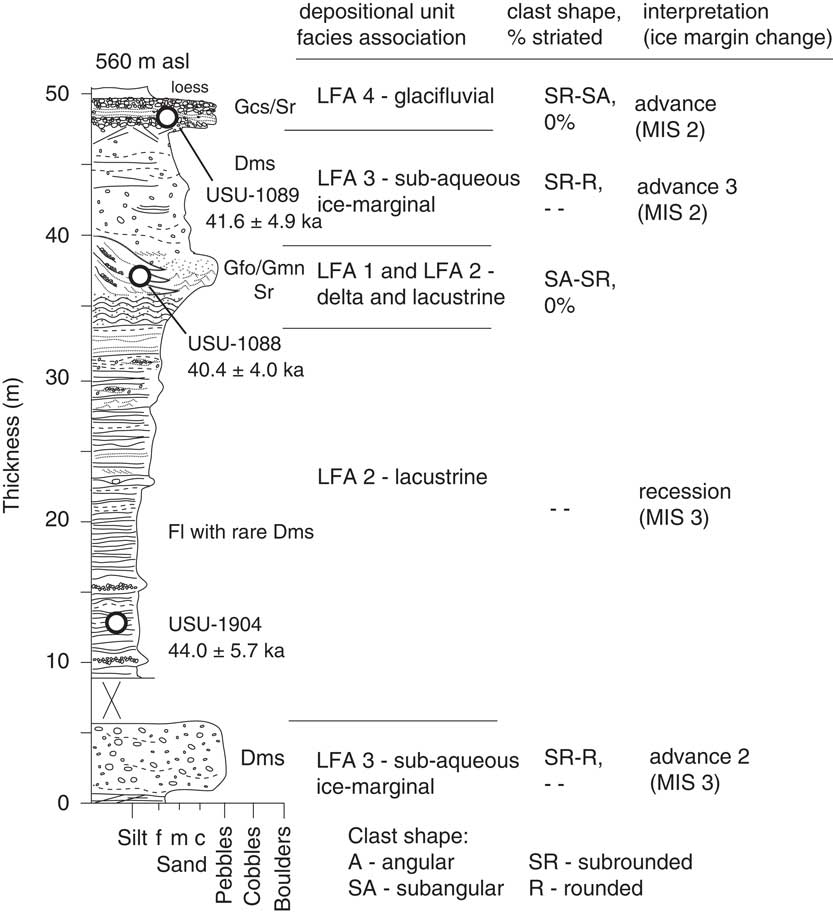
This 50-m-high and 1-km-long section is located along the Tui Stream cut that incises the Butler Downs at 43.6700°S, 170.9094°E (Fig. 1) and contains five lithofacies (Fig. 4 and Supplementary Material).
Stratigraphic log for Tui Stream.
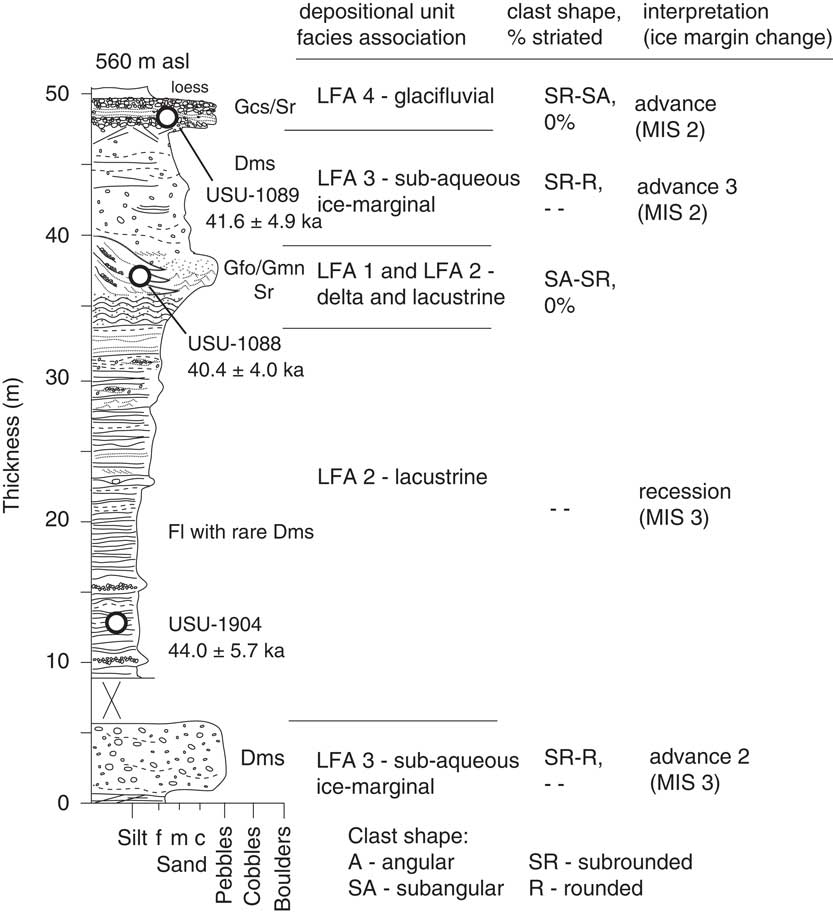
The basal 5 m (Fig. 4) consists of sub-rounded to rounded, pebble to cobble diamicton (Dms) with some faceting and striation present. This is overlain by nearly 30 m of laminated to ripple cross-bedded silts (Fl). Diamicton interbeds and pods become more common in the top few meters and drop stones are present but rare. Ductile and brittle deformation become common and the beds coarsen upward in the top few meters. Sample USU-1904 was recovered from silts near the base of this unit and yielded an age of 44.0 ± 5.7 ka.
The laminated silts are capped by 7 m of mixed sediments. These are predominantly laminated silts (Fl) with diamicton (Dms) interbeds, but there is a lateral transition to repeating sets of dm-scale, normally graded openwork to clast-supported pebble gravels (Gco) with thin sand interbeds. These gravels are present in the basal 4 m of these mixed sediments, and sample USU-1088 was recovered from one of the sand interbeds (40.4±4.0 ka). Eight metres of weakly stratified diamicton (Dms) overlie these beds. The top meter of these sediments contains thin veins of sand crosscutting the weak stratification at high angles, as well as numerous low-angle fractures. The whole outcrop face is capped by 1.5 m of alternating clast-supported pebble cobble gravels (Gc) and ripple cross-laminated sand (Sr). There is some low-angle fracturing in the cross bedded sands. Sample USU-1089 was recovered from a sand interbed in this unit and yielded an age of 41.6± 4.9 ka.
Interpretation
The basal diamicton is a mass-flow deposit into a standing body of water in a glacier-proximal environment (LFA 3), as reflected by the stratification of the diamicton. Modest sorting, presence of striae, and the faceting of clasts suggest proximal ice. The transition from this lithofacies to the overlying lake beds (LFA 2), which show little evidence of deformation and no evidence of ice proximity near the base, is interpreted as marking a glacial recession upvalley, with the formation of a lake at this site. The preservation of thick sets of laminae suggests that the lake was initially deep (below wave base). As time progressed, the appearance of drop stones and mass flow deposits indicate the gradual approach of an ice front and the gradual infilling of the lake basin. The mass flows, deformation, and increasing energy regime indicate a major change in local environments, and by the time of deposition of the mixed deltaic (LFA 1) and lacustrine (LFA 2) lithofacies associations, ca. 40 ka, the lake had shallowed significantly with a delta building across the basin. Ice was proximal to the site after this time, as reflected in the persistent mass flows and, finally, the evidence for ice over-run recorded in the hydro-fracturing and low-angle shearing at the top of the mass-flow deposits (LFA 3). The stratified gravels and sands of LFA 4 at the top of the section represent the fill of an ice-marginal channel. The shearing in the sand beds suggests that ice was still active on the channel margin. The age of ca. 42 ka for these beds is problematic, as the beds occupy a surface channel at this location and are clearly associated with a marginal drainage of the last ice retreat. We infer that older sediment may have been reworked into the channel without resetting of the luminescence signal, possibly by bank collapse.
Zig-Zag Track section
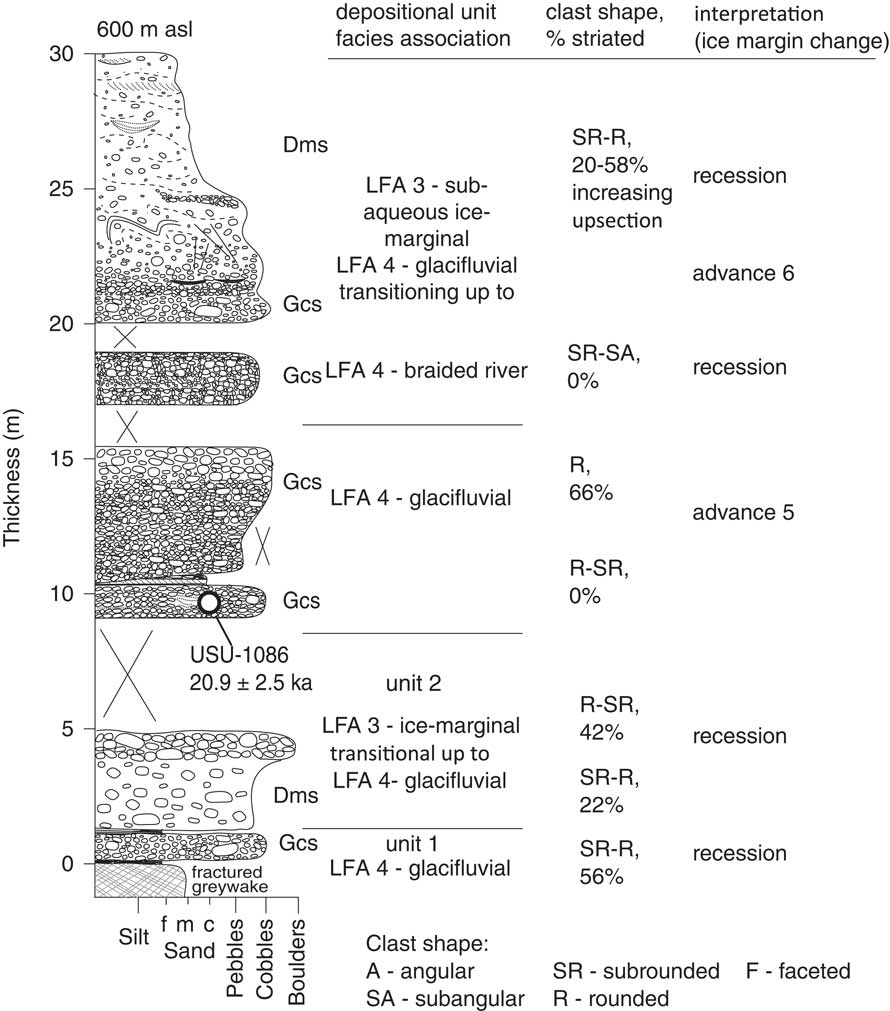
Description
This section crops out on a farm track at 43.6874°S, 170.9224°E (see Fig. 1 and 5, Supplementary Material). The base of the outcrop is marked by crushed greywacke. The greywacke is overlain by about 1 m of gravel rich, strongly striated, weakly stratified diamicton (Dms; Fig. 5). A thin laminated silt separates this diamicton from an additional 2 m of clast-poor diamicton (Dms), which grades upward to 80 cm of stratified very coarse Gcs which include many striated clasts (22–42%).
Stratigraphic log for Zig-Zag Track.
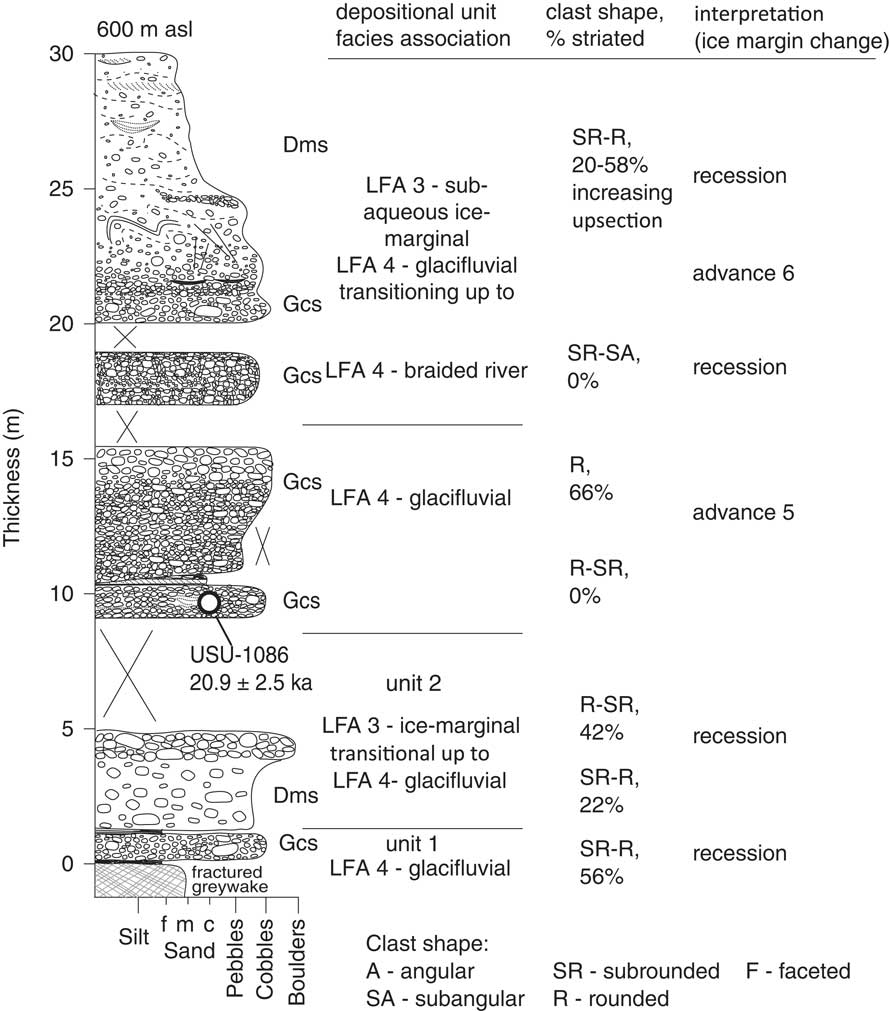
The overlying 10 m is composed of stratified, dominantly clast-supported gravel (Gcs). The upward coarsening gravel contains over 60% striated clasts. There are interbeds of up to 0.30 m of cross-bedded sands (Sr) in the base of the unit. These sands contain many fluid-escape structures. An OSL sample from near the base of this unit yielded an age of 20.9 ± 2.5 ka (USU-1086; see Fig. 5).
The top 10 m of the outcrop comprises 3 m of basal clast-rich diamicton (Dms) with thin interbeds of laminated sands and silts (Fl) that display many small-scale folds and faults (Unit 4). Twenty percent of clasts are striated. The upper 7 m of the outcrop comprises a clast-poor stratified diamicton (Dms) that displays extensive small-scale folding and local faulting. Striated-clast content rises to 58% at the top of the outcrop. The unit contains lenses of sorted silt and sand.
Interpretation
There is evidence of at least two phases of glacial advance recorded in this section. Firstly, the lower unit is associated with mass flows into a standing body of water and contains very high percentages (40%) of striated clasts (e.g., Evans et al., Reference Evans, Rother, Hyatt and Shulmeister2013). They display relatively little deformation and are likely to be proglacial but ice-proximal. This advance is undated but occurred prior to ca. 21 ka. The sediments are dominated by aggradation (braidplain) gravels in the middle section of the outcrop. The very high numbers of striated clasts clearly mark this as an ice-proximal environment. Though there is a gap in exposure, we provisionally regard the diamicton at the top of the outcrop as associated with the aggradation gravels in the middle section. From our observations elsewhere in the Rangitata and Rakaia Valleys striated clasts rarely exceed 20–30% even in ice contact settings. The very high levels of striated clasts (20–58%) suggest that this is a subglacial mass-flow deposit. The increase in striated clasts at the top of the section indicates a final pulse of glaciation recorded at the outcrop.
DISCUSSION
Age control
Until recently, successful applications of luminescence dating to New Zealand sediments were largely through the use of IRSL, including some success with glacigenic sediments (e.g., Rother et al., Reference Rother, Shulmeister and Reiser2010; Shulmeister et al., Reference Shulmeister, Thackray, Rieser, Hyatt, Rother, Smart and Evans2010b; Hyatt et al., Reference Hyatt, Shulmeister, Evans, Thackray and Rieser2012; Thackray et al., Reference Thackray, Shulmeister, Hyatt, Wang and Rieser2017). This study represents one of the first applications of quartz OSL for dating glacial sediments in New Zealand. The only previously published use was by Preusser et al. (Reference Preusser, Andersen, Denton and Schlüchter2005) from the West Coast and it was associated with the publication of a technical paper (Preusser et al., Reference Preusser, Ramseyer and Schlüchter2006) that identified a problem of very “dim” quartz in West Coast New Zealand samples. More recently, Rowan et al. (Reference Rowan, Roberts, Jones, Duller, Covey-Crump and Brocklehurst2012) have dated outwash deposits on the Canterbury Plain coastline using OSL, indicating that at least well-zeroed sediments of greywacke origin derived from Canterbury valleys, including the Rangitata, can be successfully dated using this technique. The results presented here suggest that reliable chronologies can be derived from glacial and paraglacial sequences in Canterbury using OSL in complex stratigraphies with well-constrained process sedimentology.
Depositional environments
The stratigraphic sequences reported here are located in an intramontane basin between the uplifting headwaters of the Havelock and Clyde rivers with their deeply incised glacial troughs and the Rangitata Gorge, which constricts downvalley width. The Havelock and Clyde merge 8.5 km upstream from the basin, and the combination of the valley merger and the widening at the upstream end of the intermontane basin controls both glacial and fluvial processes in this valley reach. The basin is dominated by sheet-like sedimentary beds of broad continuity as a result of this geometry. Three factors come into play: (1) coalescent valley floor fan deposits were derived from the valley sides at times when the basin was not fully occupied by ice; (2) a piedmont-like expansion of ice into the basin from the upper Rangitata drainage resulted in the low angle fan-like deposits being constrained along the basin margins; and (3) obstructions (whether moraines, fan heads, or landslide deposits) downstream in the gorge generated accommodation space, by raising the local base level and resulted in packages of lake and alluvial sediments being deposited in the valley reach being studied.
The glacial divergence at the start of the basin, with an eastward distributary (Clearwater) lobe entering the Ashburton Basin and the remaining ice widening westward into the Butler and Brabazon downs, would reduce ice thickness, which would have limited glacial scour and increased the preservation potential of the sediments. Significant incision was limited to periods of fluvial activity and was largely confined to the axis of the Rangitata Valley, because of the orientation of flow and gradient between the upstream, bedrock controlled reach, the gorge, and the Canterbury Plains.
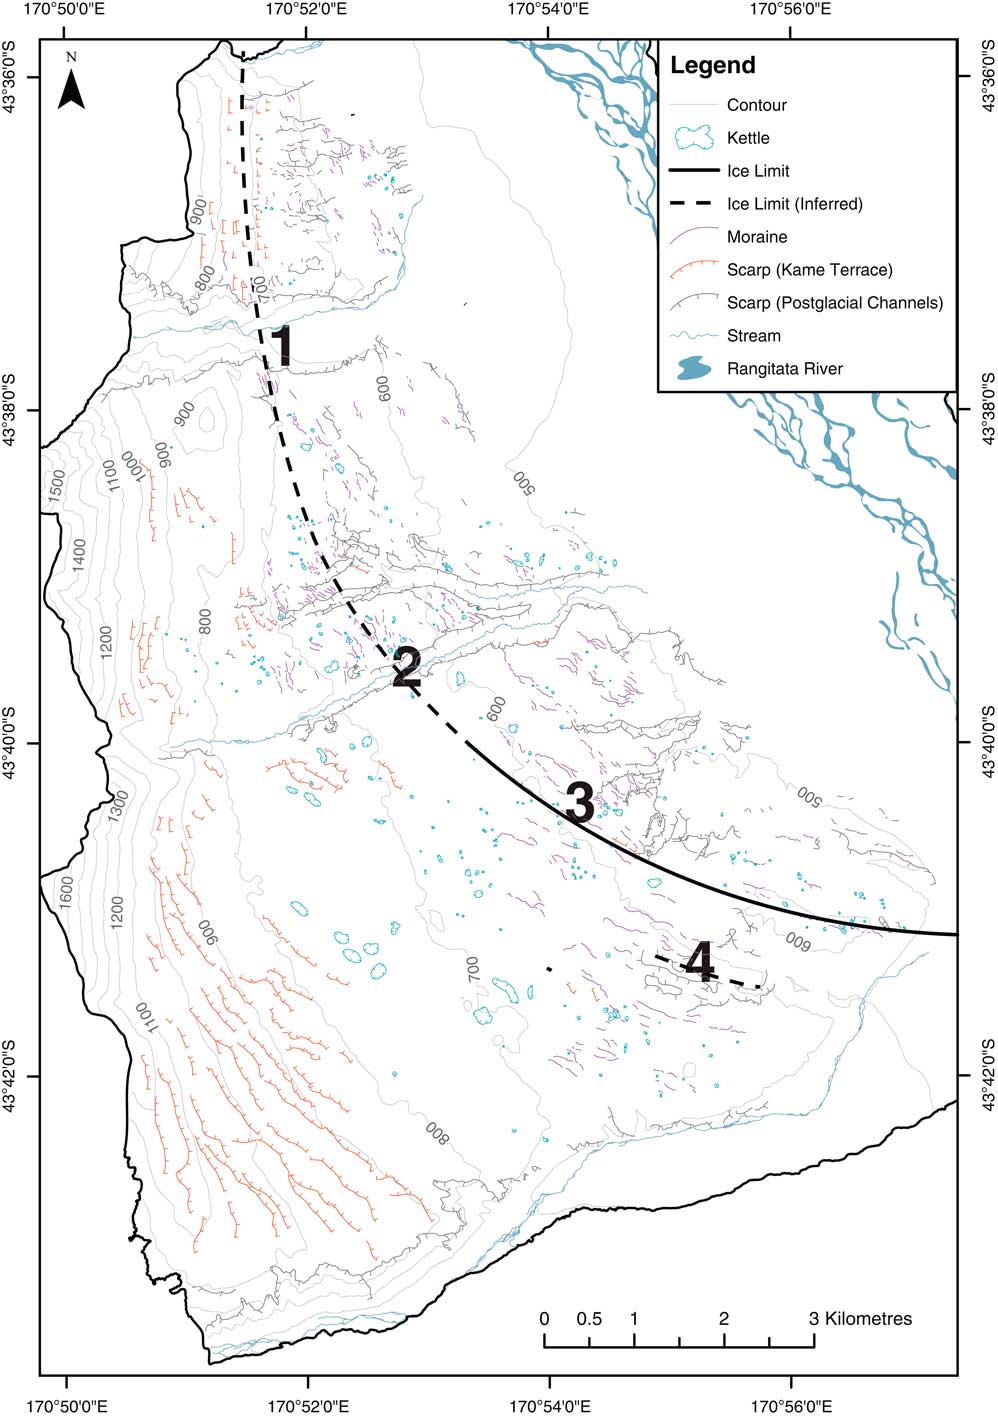
The surface expression of glaciation on the downs is reflected in prominent kame terraces, drainage channels, moraines, and melt-out features. These features are aligned in broad concentric loops stepping down slope and upvalley (Fig. 6). Their morphology and sediment content reflect ice-marginal accumulation and ice-marginal drainages, and the alignment indicates that they preserve a recessional sequence. We do not yet have chronological evidence to determine if this is a single continuous recession, as has been observed in the Clearwater lobe of the Rangitata Glacier (Evans, Reference Evans2008; Rother et al., Reference Rother, Fink, Shulmeister, Mifsud, Evans and Pugh2014), or represents a series of retreats from advances of different sizes. It is likely that the lower parts of the downs preserve the morphology of the last deglaciation event, as all the features are fresh. From the stratigraphic outcrop, we can resolve that the surface features have little continuity into the subsurface stratigraphy. At least on the lower slopes, they indicate the last phase of activity in the area.
Geomorphic features of the Butler Downs (modified from Borsellino et al., Reference Borsellino, Shulmeister and Winkler2017). The numbers refer to the stratigraphic outcrops; (1) Bush Stream, (2) Scour Stream, (3) Tui Lake, and (4) Zig-Zag Track. Brown lines are kame terraces; Blue represents water features such as drainage channels and kettles; and magenta lines represent moraine ridges. The heavy lines show the ice limits (dashed where inferred) at the locations of the stratigraphic investigations. The surface outcrops of at three sites (Bush Stream, Scour Stream, and Tui Lake lie along the same ice margin, while Zig-Zag Track lies on a slightly older margin. Based on the near surface ages from all the outcrops, these glacial limits occurred at about 19–18 ka. (For interpretation of the references to color in this figure legend, the reader is referred to the web version of this article.)

We envision three broad conditions in the upper Rangitata Valley during the last glacial cycle. When glaciers advanced into the tectonic basin of this valley reach, fan-head gravels were deposited in advance of the glacier and recycled as the fan was overridden (e.g., Shulmeister et al., Reference Shulmeister, Thackray, Rieser, Hyatt, Rother, Smart and Evans2010b; Shulmeister, Reference Shulmeister2017). This is represented in our sections by LFA 4 and is prominent in all sections.
The second major depositional environment is lacustrine. Lakes can form behind an abandoned fan head, as in Lake Pukaki (Evans et al., Reference Evans, Rother, Hyatt and Shulmeister2013), by ice impoundment of a side valley (e.g., Post and Mayo, Reference Post and Mayo1971) or because of a landslide obstruction. The Rangitata Gorge is a key constriction in this catchment and, anytime it is blocked, there is an opportunity for a large lake to form in the basin. There is no obvious evidence for landslide obstructions so, in the main, we envision fan heads blocking the outlet, as is common in many New Zealand glacial settings (e.g., Shulmeister, Reference Shulmeister2017). Smaller lakes may form between a glacier sitting in the valley and the basin margin. Lithofacies associations 1 and 2 represent this depositional context and are observed at Tui Stream and Bush Stream.
Ice-proximal lacustrine settings are commonly associated with sub-aqueous mass flows. These mass flows are typical of wet-based temperate glaciers with plentiful sediment supplies, and are pervasive in New Zealand (Evans et al., Reference Evans, Rother, Hyatt and Shulmeister2013). These are the main stratified diamictons of LFA 3.
In addition to these widespread environments, supraglacial melt-out is locally preserved (LFA 5). In addition, we also recognise ice-contact environments through shearing and hydro-fracturing of underlying beds. We now apply these lithofacies and their environmental associations to reconstruct ice oscillations in the Rangitata.
Glaciations of the upper Rangitata over the last 60 ka
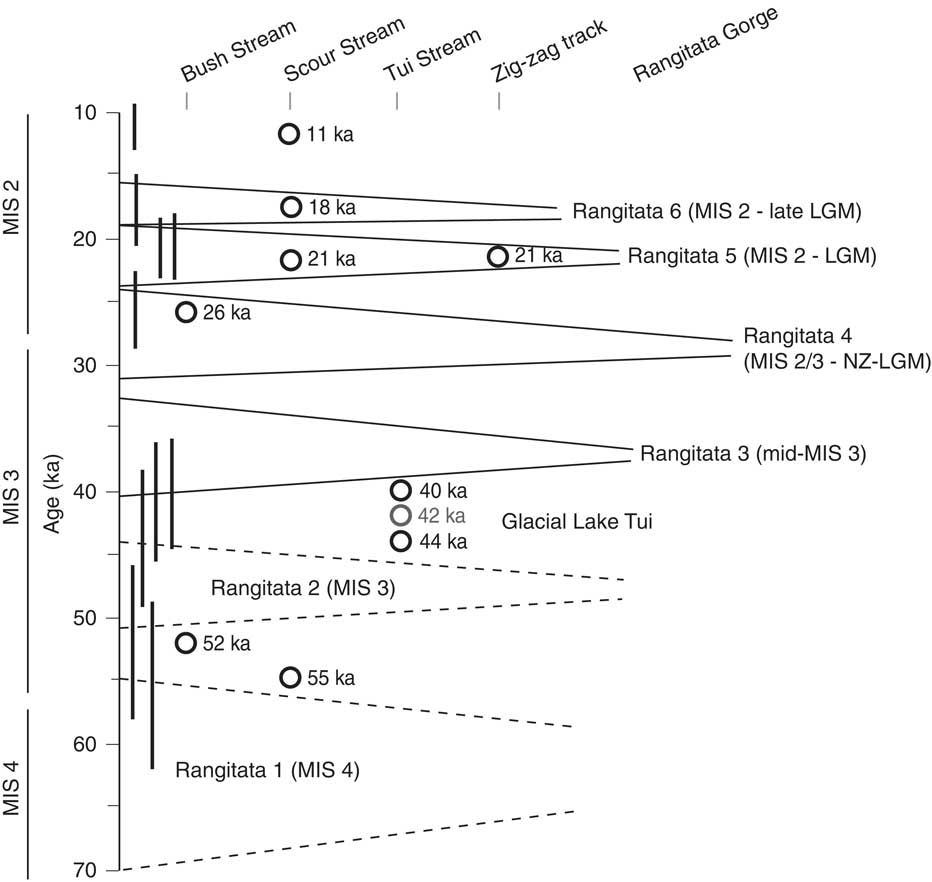
The key site for this section of the upper Rangitata is the Bush Stream section. Because of its position in the lee of a bedrock obstruction that has protected the site from erosion, it preserves the most complete record of the available stratigraphic exposures. The remaining three sites provide detail around individual advances and, in the case of Tui Stream, evidence for the presence of a deep lake in the valley floor. We summarise the record as follows (Fig. 7).
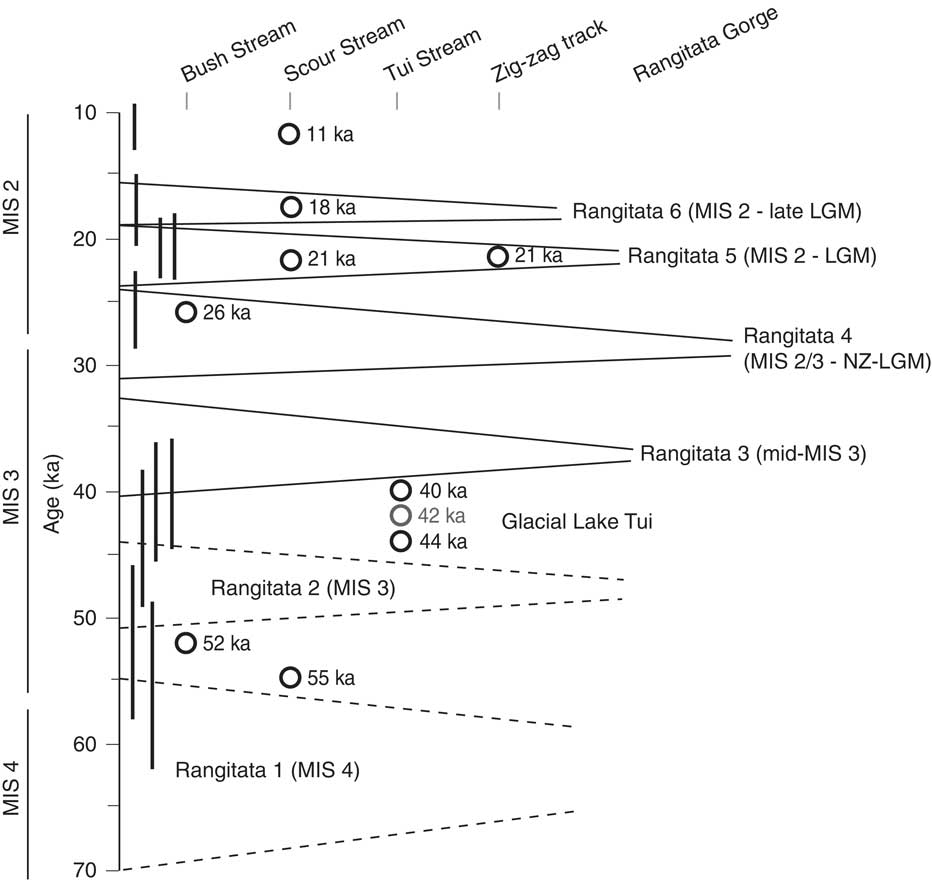
Summary chronology and scale of advances and retreats in the upper Rangitata Valley. Note the inferred long duration of ice occupation of this valley reach in the latter half of MIS 3. There are also three distinct glacial events recorded in the broadly defined glacial maximum (32–18 ka). The bars along the y-axis are the luminescence ages with 1-sigma error bars. Note that, while the individual error bars may in some cases overlap more than one glacial event, stratigraphic constraints separate the individual advances.
Rangitata 1 advance (MIS4/3, pre-ca. 55 ka)
Evidence for a MIS4/early MIS 3 advance followed by an early MIS 3 retreat exists at Scour Stream, where an early advance is recorded from aggradation gravel overlain by a stratified diamicton that has been dated to ca. 55 ka. We interpret LFA 3 as recording an ice-contact environment. The ice retreated upvalley beyond the intramontane basin shortly thereafter, as evidenced by the presence of a non-glacial lacustrine sequence dated to ca. 52 ka at the base of the Bush Stream section near the northern margin of the basin.
This early advance technically has only minimum age constraint but stratigraphically and sedimentologically we argue that it represents an advance in the mid-50s ka to low-to-mid-60s ka. Though Sutherland et al. (Reference Sutherland, Kim, Zondervan and McSaveney2007) recognised an advance at ca. 58 ka from moraine ages in the Cascade Plateau in southwest New Zealand, their ages were calculated using a higher production rate for 10Be than is now applied (Putnam et al., Reference Putnam, Schaefer, Barrell, Vandergoes, Denton, Kaplan, Finkel, Schwartz, Goehring and Kelley2010). Consequently, the ages need to be increased by at least 15%, making their advance a mid-to-high 60 ka advance. Advances in early to mid-MIS 4 (72–64 ka) are also recognised at Pukaki (Barrell, Reference Barrell2014; Schaefer et al., Reference Schaefer, Putnam, Denton, Kaplan, Birkel, Doughty and Kelley2015), in the Boulder Lake area of northwest Nelson (McCarthy et al., Reference McCarthy, Mackintosh, Rieser and Fink2008), and at Te Anau and Aurora Cave in southern South Island (Williams et al., Reference Williams, McGlone, Neil and Zhao2015). Williams et al. (Reference Williams, McGlone, Neil and Zhao2015) argued that this earlier advance was the largest of the last glacial cycle. We conclude that the earliest advance recorded in this Rangitata sequence most likely reflects an MIS 4 event between 60–70 ka.
Rangitata 2 advance (mid-MIS 3, post 50 ka, pre 38 ka)
Evidence for an early to mid-MIS 3 advance, is manifest in the diamicton that underlies the main lake sequence at Tui Stream. The upper lake sequence dates to 44.0 ± 5.7 ka and the presence of a substantial lake in the valley at this time (which we term Glacial Lake Tui), as represented by at least 30 vertical m of sediment, requires the downstream blockage of the valley. We interpret the lake as forming after the retreat of an earlier advance, most likely by blockage of the gorge section by aggraded gravels. The dated lake sediments provide a poor minimum age for the underlying diamicton and the advance that likely deposited it, but we infer the advance to be of mid-MIS 3 age.
Evidence for an advance and retreat sequence at Bush Stream occur as an aggradation gravel and a thick stratified diamicton, which is undated but clearly from MIS 3 based on bracketing ages of 52 and 26 ka (Fig. 2; table 1). The presence of 20 m of the stratified Dms at Bush Stream indicates substantial mass flows off an ice margin into a deep basin created by ice withdrawal.
Elsewhere in New Zealand, glacial advances dating to 48–46 ka and 41–40 ka have been recorded from Te Anau (Williams, Reference Williams1996) and at ca. 48 ka and ca. 40 ka in the Rakaia Valley (Shulmeister et al., Reference Shulmeister, Thackray, Rieser, Hyatt, Rother, Smart and Evans2010b). An advance age of about 50–45 ka was also determined from luminescence dating in South Westland (Almond et al., Reference Almond, Moar and Lian2001). A cluster of ages around 42–41 ka is recorded from the outer part of the Mount John sequence at Lake Pukaki (Kelley et al., Reference Kelley, Kaplan, Schaefer, Andersen, Barrell, Putnam, Denton, Schwartz, Finkel and Doughty2014; Doughty et al., Reference Doughty, Schaefer, Putnam, Denton, Kaplan, Barrell, Andersen, Kelley, Finkel and Schwartz2015).
Rangitata 3 advance (MIS 3, ca. 38–36 ka)
The ca. 40 ka age at the top of Tui Stream lacustrine sequence (Glacial Lake Tui) was determined from sediments reflecting a delta prograding into the lake at a phase where stratified Dms become common, indicating a proximal ice margin. We infer this advance to have occurred soon after ca. 40 ka based on an onlapping relationship between the diamicton-rich lakebeds and the delta foresets. We interpret this advance to be significant, on the basis of the deep-water, ice-distal facies in the lower 20 m of Glacial Lake Tui, indicating a substantial downvalley advance after a significant ice withdrawal.
We infer that, from this time onward until the final deglaciation, the Rangitata Glacier extended through this intramontane basin at least as far as the Rangitata Gorge. We know that ice extended beyond this valley reach from the dated ice margins of the Clearwater Lobe of the Rangitata Glacier from 28 ka to 16 ka (Rother et al., Reference Rother, Fink, Shulmeister, Mifsud, Evans and Pugh2014) and that Rakaia ice to the north advanced to the Rakaia Gorge (i.e., was at nearly full glacial extent) between 35–30 ka (Thackray et al., Reference Thackray, Shulmeister, Hyatt, Wang and Rieser2017). We also note that the sediments in the upper parts of all the outcrops are consistent with ice-marginal environments, rather than containing evidence of non-glacial facies.
Advances shortly after 40 ka are not widely recorded in New Zealand, but Doughty et al., (Reference Doughty, Schaefer, Putnam, Denton, Kaplan, Barrell, Andersen, Kelley, Finkel and Schwartz2015) record an advance at about 36 ka at Pukaki. The other data that may relate to this event are ages of 41–40 ka for ice advances at Aurora Cave in Fiordland (Williams, Reference Williams1996) and a 40 ka age from a till in the Rakaia (Shulmeister et al., Reference Shulmeister, Thackray, Rieser, Hyatt, Rother, Smart and Evans2010b). Both may be coeval with this advance but are equally likely to be related to the Rangitata 2 advance.
Rangitata 4 advance (MIS 3/2 local LGM, ca. 26 ka)
An ice-marginal oscillation is recorded from Bush Stream at ca. 26 ka. The evidence comes from an aggradation gravel capped by a supraglacial melt-out deposit. Evidence of ice advances in the 30–25 ka period is now becoming common from cosmogenic radionuclide data from New Zealand. An age of 32.1 ± 2.6 ka from a silt interbed below an aggradation gravel in the Hope Valley that is capped by LGM moraines (Rother et al., Reference Rother, Jol and Shulmeister2007) provided a possible maximum age constraint for this event, while Rother et al. (Reference Rother, Shulmeister, Fink, Alexander and Bell2015) indicated an age of about 26 ka for the Otarama Moraine in the Waimakariri Valley. Shulmeister et al. (Reference Shulmeister, Fink, Hyatt, Thackray and Rother2010a) dated the main last glacial advance in the Rakaia to ca. 28 ka (ages re-calculated using the CRONUS 10Be / 26Al exposure age calculator (Balco et al., Reference Balco, Stone, Lifton and Dunai2008; version 2.3, 2016). Thackray et al. (Reference Thackray, Shulmeister, Hyatt, Wang and Rieser2017) dated a near-maximum glacial ice limit in the Rakaia to ca. 35 ka using IRSL dating of ice melt-out sediments. Barrows et al. (Reference Barrows, Almond, Rose, Fifield, Mills and Tims2013) recorded a similar morphology and age structure from moraines in western South Island. Putnam et al. (Reference Putnam, Schaefer, Denton, Barrell, Birkel, Andersen, Kaplan, Finkel, Schwartz and Doughty2013) recognised moraines at ca. 32 ka and ca. 27 ka from Lake Ohau in the Mackenzie Basin. We recognise these advances as representing the NZ LGM.
Rangitata 5 advance (MIS 2, LGM, ca. 22–21 ka)
We have evidence from Scour Stream and Zig-Zag Track for ice-marginal deposits dating to the global LGM (ca. 22–21 ka). These data include a thick aggradation and diamicton sequence from Zig-Zag Track and a glacially deformed fluvial sand deposit at Scour Stream. At Bush Stream we observe a thin gravel and a stratified glacial diamicton that is stratigraphically younger than the main NZ LGM advance and broadly consistent with the (global) LGM event.
While many New Zealand sites designated as correlative with the LGM have now been determined to be older (local LGM) in age, the global LGM is still well represented and now well secured through cosmogenic radionuclide ages on terminal moraines. LGM positions are preserved on North Island in the Tararuas (Brook et al., Reference Brook, Shulmeister, Crow and Zondervan2008). On South Island, systems with LGM terminal moraines include the Cobb Valley (Shulmeister et al., Reference Shulmeister, Fink and Augustinus2005) and Boulder Lake systems (McCarthy et al., Reference McCarthy, Mackintosh, Rieser and Fink2008) in northwest Nelson; the Bayfield Moraines in the Rakaia (Shulmeister et al., Reference Shulmeister, Fink, Hyatt, Thackray and Rother2010a); the terminal moraines at the end of Lake Pukaki in the Tasman/Pukaki system (Schaefer et al., Reference Schaefer, Denton, Barrell, Ivy-Ochs, Kubik, Andersen, Phillips, Lowell and Schlüchter2006); and terminal moraines at the end of Lake Ohau (Putnam et al., Reference Putnam, Schaefer, Denton, Barrell, Birkel, Andersen, Kaplan, Finkel, Schwartz and Doughty2013).
Rangitata 6 advance (MIS 2 late LGM: ca. 18 ka)
At all sites in the field area there is evidence for minor late-stage ice fluctuations in the upper parts of the stratigraphic sections. Incised drainages and small constructional ridges are visible at the top of Bush Stream (Fig. 6). At Scour Stream, a complex of a Dms, ice-marginal channel sands and supraglacial debris reflect a fluctuating ice margin. The channel sands yielded an age of 18 ka, which we interpret as dating the last activity at this site.
The 18 ka age for final ice fluctuation at Scour Stream is consistent with cosmogenic ages of ice retreat from both the main Rangitata and the Clearwater drainage. The increase in striated clasts at the top of the Zig-Zag section also suggests a similar story. The final deglaciation of this section of the Rangitata started at about 17 ka based on ages near the upper end of the gorge from Rother et al. (Reference Rother, Fink, Shulmeister, Mifsud, Evans and Pugh2014, their Site 9) and similar ages for the abandonment of LGM limits in the Clearwater lobe (Rother et al., Reference Rother, Fink, Shulmeister, Mifsud, Evans and Pugh2014, their sites 3 and 6) also at about 17 ka. Putnam et al., (Reference Putnam, Schaefer, Denton, Barrell, Birkel, Andersen, Kaplan, Finkel, Schwartz and Doughty2013) also recognised an 18.2 ka limit at Lake Ohau.
Glacial and climatic implications
A salient point is the frequency with which ice reached the middle Rangitata during the last glaciation. We have documented six separate advances with all but one of these in the second half of the glaciation (MIS 3 or MIS 2; Fig. 7). The fragmentary preservation of glacial and paraglacial sediments means that this record represents only a portion of the overall history of the last glaciation for the Rangitata. Though our field sites are some 25 km upvalley from the inferred terminal moraines of the NZ LGM, the narrowness of the Rangitata gorge means that any ice that penetrated to the end of this basin, some 45 km from the upvalley-most cirques, had a strong likelihood of extending through the gorge. Very little additional ice is needed to occupy the gorge reach. In short, these advances are significant glacial advances representing a scale of glaciation, in terms of ice volume, nearly as large as the maximum glacial events. In addition to the frequency of occupation, the apparent ice occupation of this part of the valley for most of the period from ca. 38 ka to at least 18 ka, highlights that near-maximum conditions were the norm rather than the exception in the latter half of the last glaciation. A very similar inference has been made from the Mackenzie Basin (Doughty et al., Reference Doughty, Schaefer, Putnam, Denton, Kaplan, Barrell, Andersen, Kelley, Finkel and Schwartz2015) and these studies reinforce evidence for an extended NZ LGM extending from late MIS 3 and through much of MIS 2 (e.g., Pillans et al., Reference Pillans, McGlone, Palmer, Mildenhall, Alloway and Berger1993; Alloway et al., Reference Alloway, Lowe, Barrell, Newnham, Almond, Augustinus and Bertler2007) in New Zealand.
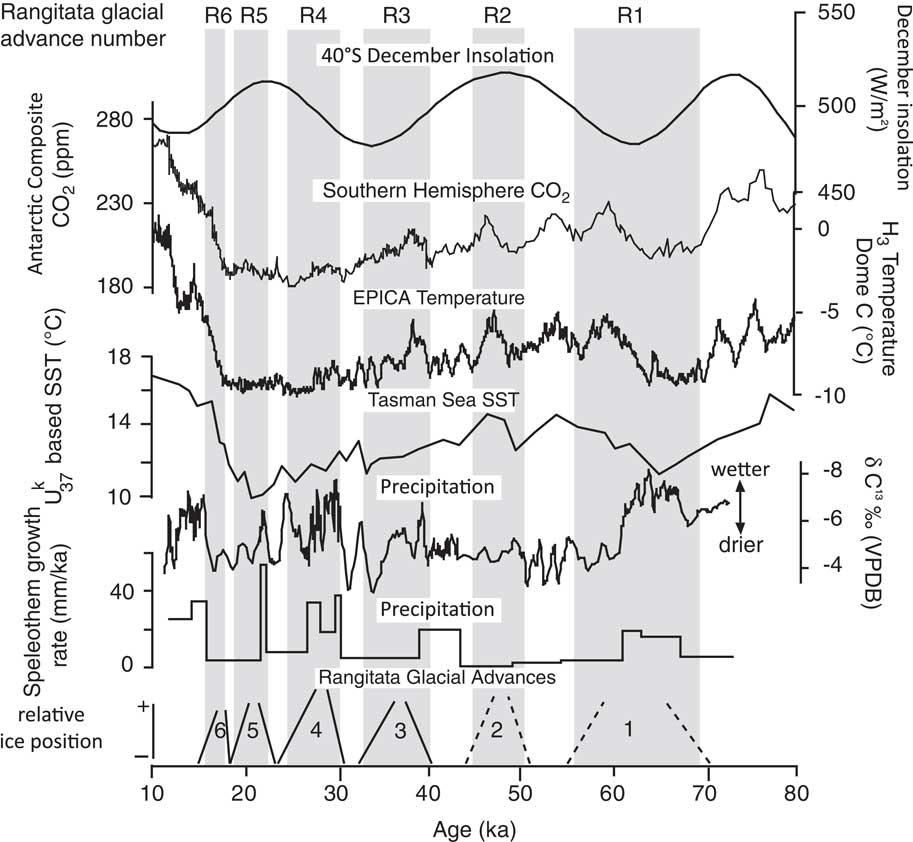
New Zealand glacial advances have been attributed to a variety of climatic factors, including: (1) transmission of Northern Hemisphere cooling to the Southern Hemisphere via either greenhouse gases or ocean thermohaline circulation; (2) local (Southern Hemisphere) insolation forcing (e.g., Vandergoes et al., Reference Vandergoes, Newnham, Preusser, Hendy, Lowell, Fitzsimons, Hogg, Kasper and Schlüchter2005); and (3) CO2 fluctuations in the Southern Ocean and changes in sea surface temperatures (SSTs; e.g., Doughty et al., Reference Doughty, Schaefer, Putnam, Denton, Kaplan, Barrell, Andersen, Kelley, Finkel and Schwartz2015). To examine possible correlations, we plot the timings of our advances against key climate forcing agents (Fig. 8, namely: Southern Hemisphere insolation to examine the effects of seasonality (Berger and Loutre, Reference Berger and Loutre1991); CO2 fluctuations to examine greenhouse forcing (Bereiter et al., Reference Bereiter, Eggleston, Schmitt, Nehrbass-Ahles, Stocker, Fischer, Kipfstuhl and Chappellaz2015); Antarctic temperatures to compare against regional (Antarctic) cooling (Jouzel et al., Reference Jouzel, Masson-Delmotte, Cattani, Dreyfus, Falourd, Hoffman and Minster2007); a Tasman Sea temperature record (Barrows et al., Reference Barrows, Juggins, DeDeckker, Calvo and Pelejero2007); and a New Zealand precipitation proxy from speleothems (Whittaker et al., Reference Whittaker, Hendy and Hellstrom2011). A broad coherence is apparent between periods of lower temperature and glacial extent, although no single forcing factor correlates with all advances.
Comparison of timing of glacial events in the Middle Rangitata with (A) Southern Hemisphere insolation (Berger and Loutre, Reference Berger and Loutre1991); (B) CO2 fluctuations from EPICA Dome C (Bereiter et al., Reference Bereiter, Eggleston, Schmitt, Nehrbass-Ahles, Stocker, Fischer, Kipfstuhl and Chappellaz2015); (C) Antarctic temperatures (Jouzel et al., Reference Jouzel, Masson-Delmotte, Cattani, Dreyfus, Falourd, Hoffman and Minster2007); (D) SSTs off the west coast of South Island, New Zealand (Barrows et al., Reference Barrows, Juggins, DeDeckker, Calvo and Pelejero2007); and (E) precipitation proxies from speleothem records from Hollywood Cave, South Island, NZ (Whittaker et al., Reference Whittaker, Hendy and Hellstrom2011). There is reasonable correspondence with Antarctic temperature but not all advances can be explained this way. We infer that northward migration of the westerlies during MIS 3 caused the onset of significant glaciation. Increasing summer insolation after 32 ka and especially after 28 ka triggered a gradual deglaciation. The glacial advances/stillstands during the LGM (ca. 21 ka and ca. 18 ka) reflect cool events.
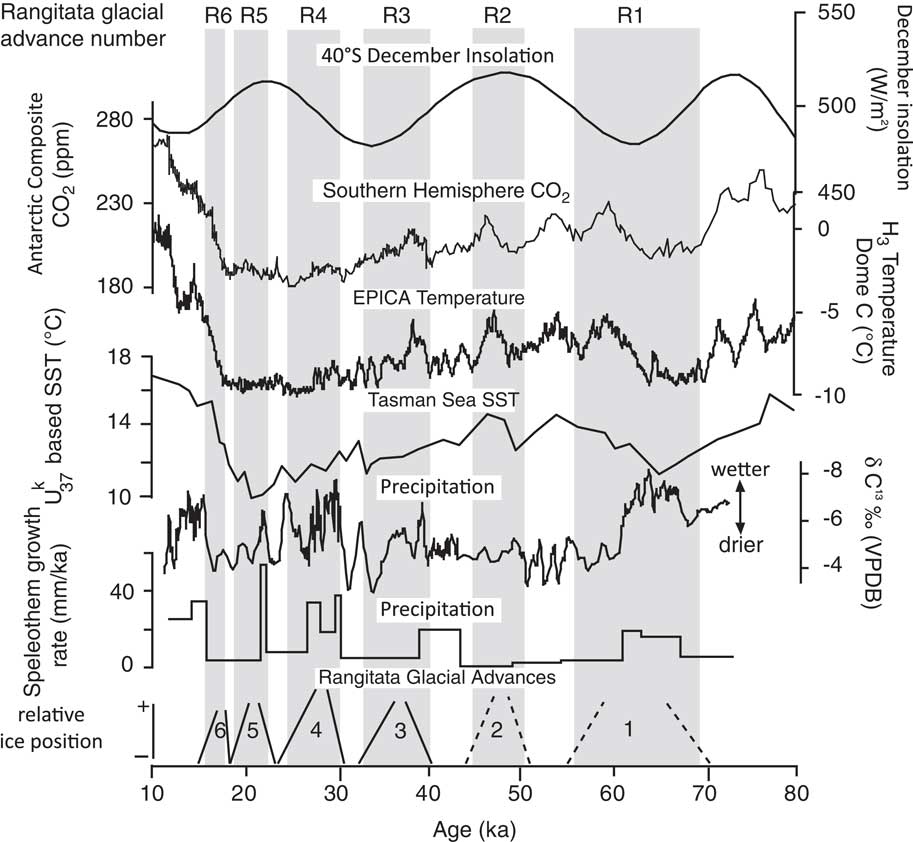
The timing of middle Rangitata ice advances is inconsistent with summer insolation minima as the primary forcing effect on New Zealand glaciation. All of the four younger advances for which we have reasonable age control occur during summer insolation maxima or on shoulder times. We note, however, that the peak glaciation at ca. 32 ka does align with an insolation minimum. We concur with Doughty et al. (Reference Doughty, Schaefer, Putnam, Denton, Kaplan, Barrell, Andersen, Kelley, Finkel and Schwartz2015) that glacial advances in New Zealand appear to occur at all phases of the regional insolation curve within the 38–18 ka interval, but as we outline below, we believe that local insolation still plays a role.
However, we see no simple relationship to SSTs (cf. Doughty et al., Reference Doughty, Schaefer, Putnam, Denton, Kaplan, Barrell, Andersen, Kelley, Finkel and Schwartz2015). If SSTs from core SO136-GC3 (Barrows et al., Reference Barrows, Juggins, DeDeckker, Calvo and Pelejero2007) from off the West Coast of South Island are used for comparison to the glacial record, on the grounds that this is a core immediately upwind of the glaciers, there is an inverse relationship between temperature and glacial advances over the period from 38 ka to 21ka. We prefer this record to core MD97-2120 (also from Barrows et al., Reference Barrows, Juggins, DeDeckker, Calvo and Pelejero2007) as used in Doughty et al. (Reference Doughty, Schaefer, Putnam, Denton, Kaplan, Barrell, Andersen, Kelley, Finkel and Schwartz2015) because MD97-2120 is downwind of New Zealand and has little relationship to temperatures in terrestrial New Zealand. It is in an area of known exceptional cooling because of the northward migration of the sub-polar front to the Chatham Rise, which is not matched by an equivalent migration in the Tasman Sea sector. Simply put, if Tasman Sea SSTs were the dominant force, the global LGM would be the biggest advance. It is not. Antarctic temperature is more promising but while the final three advances (ca. 27 ka, ca. 21 ka, and ca. 18 ka) correlate very well with the timing of peak cooling in Antarctica, the older events clearly occur at times of lesser cooling.
The ca. 38–36 ka event, occurs at a time when cooling was 40% from modern (ca. 2–3°C), relative to cooling during the LGM in New Zealand. This ca. 38–36 ka advance was nearly as extensive as the NZ LGM and implies either that amplified cooling occurred that was specific to the New Zealand region, or that the advance occurred under milder (though still cold) temperature conditions, which suggests that other factors such as sustained precipitation and/or more persistent SW flow (e.g., Hooker and Fitzharris, Reference Hooker and Fitzharris1999) could enhance thermal effects.
The timings of our advances match rather well with inferred periods of enhanced westerlies from a speleothem record in NW South Island New Zealand (Whittaker et al., Reference Whittaker, Hendy and Hellstrom2011; see Fig. 8). The Southern Hemisphere westerlies are regarded as major drivers of global climate change through the mechanism of ventilation of deep water in the Southern Ocean and the impact that this ventilation has on global CO2, through either enhanced drawdown or through degassing to the atmosphere. A model for what may happen during glaciations and deglaciations has been proposed. Togweiller (Reference Toggweiler2009) and Togweiler and Russell (Reference Toggweiler and Russell2008) suggested alternating glacial and interglacial conditions with an equatorward movement of the main track of the westerlies during glacial times. This model is consistent with work on the glacial-interglacial change in the latitude of the highest rates of erosion from Chile (Herman and Brandon, Reference Herman and Brandon2015). At present, the main track of the westerlies at near-surface elevations passes to the south of New Zealand (e.g., Shulmeister et al., Reference Shulmeister, Goodwin, Renwick, Harle, Armand, McGlone and Cook2004).
If we use Core SO136-GC3 as our local temperature reference point, it is likely that the core of the westerlies was close to its modern position during early MIS 3 (60–50 ka). Northward contraction of the westerly belt as temperatures cooled initiated glacial re-advances with glaciers reaching near LGM positions by ca. 38 ka and their regional maxima at ca. 32 ka, when a local summer insolation minimum amplified the westerly signal (e.g., Vandergoes et al., Reference Vandergoes, Newnham, Preusser, Hendy, Lowell, Fitzsimons, Hogg, Kasper and Schlüchter2005). Thereafter, gradually intensifying summer insolation began to work against the westerly signal, such that by 28 ka a gradual glacial retreat was under way (Rother et al., Reference Rother, Fink, Shulmeister, Mifsud, Evans and Pugh2014) even though global temperatures remained cold. This overall retreat continued through to the deglaciation, interrupted only by abrupt cold events including the peak of the LGM.
CONCLUSIONS
This paper utilizes evidence from glacial stratigraphy and OSL dating to document significant glacial advances during MIS 3 and MIS 2 in South Island, New Zealand, evidence that is complementary to regional cosmogenic radionuclide glacial chronologies. These advances are close to the scale of the LGM advance and indicate that conditions suitable for extended glaciation occurred continuously from ca. 38–36 ka to at least 18 ka. Given that the earlier part of this period (pre-28 ka) was not as cold regionally or globally as the LGM, it implies either enhanced local cooling in this part of the SW Pacific, or cool but wet conditions, probably preconditioned by the northward displacement of the main track of the Southern Hemisphere westerlies. We infer that increased snowfall under these cooler conditions drove this glacial expansion. We challenge the hypothesis that summer insolation minima are the lone significant driver of New Zealand glaciations, as our advances do not coincide with the minima. This broader chronologic pattern of glaciation suggests that either inter-hemispheric transmission of cooling or Southern Ocean Westerly wind dynamics play a major role in New Zealand glaciation.
ACKNOWLEDGMENTS
This project was supported by a US National Science Foundation grant entitled “Collaborative Research: Interhemispheric linkages of Late Pleistocene climate change” to GDT, TR, and JS (NSF EAR 1024657 and 10248500. We thank Sue and Malcom Prouting of Mesopotamia Station for access to numerous field sites and for hospitality. We also thank Doug and Mari Harpur and Roger Johnston of Forest Creek Station for access to key sites at Tui Stream and Zig-Zag Track. Cianna Wyshnytzky, Katherine Marshall, and Amie Staley assisted with field data collection and sampling. This paper was partially written while JS was a visitor at Durham University. We thank Alan Gillespie and Dave Evans for reviewing the manuscript and suggesting numerous improvements.
SUPPLEMENTARY MATERIAL
To view supplementary material for this article, please visit https://doi.org/10.1017/qua.2017.108