Implications
The present results indicate that selection using the beef carcass index (BCI) does not have any adverse effects on important and desirable traits (such as live animal muscularity, carcass meat proportion and carcass value) in beef production, and greater emphasis on indicators of carcass meat proportion (i.e. conformation and fat scores) should be included in the BCI.
Introduction
Genetic improvement programmes for beef cattle are becoming increasingly important in order to increase economic returns for producers through production of carcasses with higher meat yield that better meet market demands. European market requirements demand lean carcasses of good conformation. Carcasses of high lean meat yield command the higher prices and therefore, breeding to achieve these targets is vital for long-term sustainability of the Irish beef industry (Drennan et al., Reference Drennan, Keane and McGee2007). The Irish Cattle Breeding Federation (ICBF) launched economically weighted genetic selection indices for beef cattle in 2005 to aid farmers in comparing animals on genetic merit for the expected profitability of their progeny. The beef carcass index (BCI) estimates the genetic potential of a sire to generate profitable progeny for slaughter. Genetic evaluations in Ireland use purebred and crossbred data and expected progeny differences (EPD) are expressed across breeds.
The BCI is composed of five economically weighted traits (weaning weight, dry matter (DM) intake, carcass weight, carcass conformation score and carcass fat score). The efficacy of this economic index was first examined under a controlled environment in contrasting production systems, and results showed that the observed differences in profitability of progeny of sires differing in BCI were in good agreement with the expected values (Clarke et al., Reference Clarke, Drennan, McGee, Kenny, Evans and Berry2009). Furthermore, for each unit increase in sire EPD for weaning weight, DM intake, carcass weight, carcass conformation score and carcass fat score, progeny performance increased for each of the respective traits by 1.0, 1.1, 1.3 kg, 0.9 (scale 1 to 15) and 1.0 (scale 1 to 15); none of which differed from the theoretical expectation of unity.
Carcass meat yield and distribution are the ultimate indicators of carcass value and are therefore imperative to genetic improvement programmes. Live animal indicators of carcass meat yield and distribution include visual muscularity and skeletal scores (Drennan et al., Reference Drennan, McGee and Keane2008). These indicators are particularly important in pedigree breeding programmes because carcass data will not be available on those animals. Linear muscularity and skeletal scoring (visual assessment) is envisaged to form an integral part of early carcass merit prediction in the BCI (Evans et al., Reference Evans, Pabiou, Cromie, Kearney and Wickham2007). Consequently, the correlated responses to selection on the BCI for live animal measurements and carcass composition should be investigated. Because energy metabolism in skeletal muscle is under strong endocrinological control (Florini et al., Reference Florini, Ewton and Coolican1997) the use of systemic concentrations of key metabolic hormones and metabolites may be of potential use to increase the accuracy of genetic selection for growth and meat quality (Hocquette et al., Reference Hocquette, Ortigues-Marty, Pethick, Herpin and Fernandez1998). For example, circulating concentrations of insulin-like growth factor (IGF)-1 has been positively associated with feed efficiency (Stick et al., Reference Stick, Davis, Loerch and Simmen1998; Arthur and Herd, Reference Arthur and Herd2005), weaning weight and post-weaning gain (Davis and Simmen, Reference Davis and Simmen1997; Stick et al., Reference Stick, Davis, Loerch and Simmen1998).
The objective of this study was to quantify the effect of sire genetic merit for BCI on live animal scores, carcass composition and plasma hormone and metabolite concentrations in their progeny reared under either bull or steer production systems.
Material and methods
Study design
Male progeny from 22 late-maturing beef breed sires selected as either high (n = 11) or low (n = 11) for the Irish genetic index, BCI, were purchased between October 2005 and January 2006. The BCI of a sire is the sum of the product of the economic weight and respective EPD for each of the five individual traits and thus, is related to the expected profitability of the progeny at slaughter. Traits (relative emphasis with sign of economic weight included in parenthesis) included in the BCI in 2008 were weaning weight (+0.24), DM intake (−0.12), carcass weight (+0.46), carcass conformation score (+0.11) and carcass fat score (−0.07).
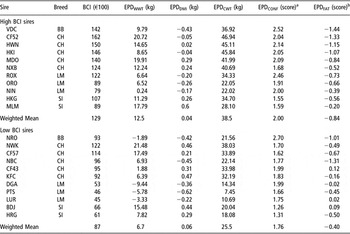
Within both the high and low genetic merit groups, there were five Charolais, three Limousin, two Simmental and one Belgian Blue sires (Table 1). Details of the BCI values for each sire and the EPD for weaning weight (EPDWWT), DM intake (EPDDMI), carcass weight (EPDCWT), carcass conformation score (EPDCONF) and carcass fat score (EPDFAT) are summarised in Table 1. The values used are from the ICBF February 2008 genetic evaluation run. EPD are expressed in their units of measurement with weaning weight, daily DM intake and carcass weight measured in kg, and both carcass conformation and fat score measured separately according to the EU beef carcass classification scheme (Commission of the European Communities, 1982) on a scale of 1 (poor conformation and low fat cover) to 15 (good conformation and high fat cover) as outlined by Hickey et al. (Reference Hickey, Keane, Kenny, Cromie and Veerkamp2007). The weighted mean difference in BCI between the high and low genetic merit sires was €42. On average, the advantage of the high over the low BCI sires was 6 kg in sire EPDWWT, −0.02 kg in sire EPDDMI, 13 kg in sire EPDCWT, 0.24 in sire EPDCONF and −0.44 in sire EPDFAT. All sires were proven in Ireland and had reliabilities associated with their BCI values ranging from 91% to 99% with a mean value of 96%. Reliability of sire EPD for the individual traits ranged from 78% to 99% with a mean value of 93%.
Values for the beef carcass index (BCI), expected progeny differences for weaning weight (EPDWWT), dry matter intake (EPDDMI), carcass weight (EPDCWT), carcass conformation score (EPDCONF) and carcass fat score (EPDFAT) for sires of high and low BCI used in the study

BB = Belgian Blue; CH = Charolais; LM = Limousin; SI = Simmental.
aEU Beef Carcass Classification Scheme scale 1 (poorest) to 15 (best).
bEU Beef Classification Scheme scale 1 (leanest) to 15 (fattest).
The progeny originated from 28 commercial suckler beef herds with the number of purchased progeny per herd varying from 1 to 10. Animals were primarily born in spring to a multiparous dam and reared on their dam at pasture until weaning at approximately 8 months of age. For the purpose of the analysis in the present study, breed of dam was separated into four groups: (1) Limousin and Limousin cross, (2) Simmental and Simmental cross, (3) Aberdeen Angus and Hereford with their associated crosses, and (4) Belgian Blue and Charolais with their associated crosses.
The purchased weanlings were assembled at the Grange Beef Research Centre, where they remained for the duration of the study until slaughter. Paternal verification of each animal purchased was determined using 11 DNA-markers including the 9 microsatellite markers recommended by the International Society of Animal Genetics (International Society of Animal Genetics, 2008) and only animals with a positive paternal test outcome were retained. A total of 107 animals were included in the study. Number of progeny per sire varied from 1 to 10 with a mean number of 5.
Animal management
Upon arrival at the research centre, all animals were vaccinated as a prophylaxis against respiratory disease, and treated for the control of ecto- and endo-parasites. They were offered grass silage ad libitum plus 2 kg of supplementary concentrate over the pre-experimental period. While trying to maintain an equal number of progeny per sire, each animal was randomly allocated to one of two production systems, an ‘intensive’ bull production system with slaughter age at approximately 16 months, or an ‘extensive’ steer production system with slaughter at approximately 24 months. As some animals were already castrated on arrival, castration of the remaining animals destined for the steer production system took place at this time. A total of 50 bulls and 57 steers were used in the study.
Bulls were individually offered a barley-based concentrate diet ad libitum using Calan-Broadbent gates (American Calan, Northwood, New Hampshire, USA) until slaughter on 26 June 2006 as described by Clarke et al. (Reference Clarke, Drennan, McGee, Kenny, Evans and Berry2009). Steers were offered grass silage ad libitum and a concentrate supplement for most of the winter, and were turned out to pasture on 18 April. They remained at pasture until 18 October 2006 when they were re-housed and individually offered grass silage until 22 December 2006. Concentrates were then introduced to the diet and this diet was available ad libitum in addition to 1 kg of grass silage DM per head, daily from January 2007 until slaughter on 13 or 27 April 2007 as described by Clarke et al. (Reference Clarke, Drennan, McGee, Kenny, Evans and Berry2009). The steers were slaughtered in two groups for logistical reasons, and were balanced for genetic merit and, as far as possible, for sire on each slaughter date. Slaughter of all animals was carried out in the same commercial meat plant.
Animal measurements
Animals were weighed on 5 January 2006, having received a standard diet from the time of arrival at the research centre. This weight is referred to as live weight after weaning. Bulls were subsequently weighed at 28-day intervals from then until slaughter resulting in a total of seven weight records per bull. Steers were also weighed at 28-day intervals from the initial weight to housing in October 2006, after which they were weighed every 14 days until slaughter in April 2007 resulting in a total of 27 weight records per steer. Weighing always occurred prior to the morning feeding or when at pasture prior to movement to the next paddock in the rotation.
Both bulls and steers were visually assessed for muscularity traits using the Signet (Allen, Reference Allen1990) and ICBF (ICBF, 2002) scoring procedures in January 2006. Skeletal scores were also recorded at the same time using the ICBF linear scoring system (ICBF, 2002). These scores were taken to represent weanling live score assessments. Each animal was also scored for the same traits in the week pre-slaughter. The Signet scoring system assigns visual muscularity scores to each animal at three different locations, namely roundness of hind-quarter, width of rump and the thickness/width at the loin. The system uses a scale of 1 to 15 where 1 represents low and 15 represents high degree of muscularity. Each location was given a single score and then the three scores were averaged to give a single value for muscularity, both after weaning and pre-slaughter by the same assessor.
Muscularity scores using the ICBF linear scoring system involved visual assessment at six different locations, namely width at withers, width behind withers, loin development, development of hind-quarter, width at hind-quarter and development of the inner thigh. The muscularity traits were again scored on a scale of 1 to 15, with 1 for poor and 15 for excellent muscularity development. These muscularity scores were then averaged to give one overall muscularity score. The three skeletal traits assessed were height at withers, length of back and pelvic length. The skeletal traits were scored on a scale of 1 (short) to 10 (extended). The ICBF muscularity and skeletal scores were all carried out by one person.
At the same time as muscularity scoring, each animal was ultrasonically scanned to obtain longissimus dorsi muscle depth and depth of back fat using a dynamic imaging ultrasound scanner (Concept MLV, with 3.5 MHz head; Dynamic Imaging Ltd, Livingston, Scotland). Muscle depth was measured at the 3rd lumbar vertebra. Four fat depth measurements were taken at the 13th rib and a further three at the 3rd lumbar vertebra. These values were subsequently combined and an average value calculated.
The bulls were blood sampled by jugular venipunture on three occasions (1 February, 17 May and 21 June 2006 which corresponds to day −14, 94 and 129 of the concentrate feed intake period) when offered a high level of concentrates (day −14) or concentrates ad libitum (days 94 and 129). The steers were also blood sampled three times during the ad libitum concentrate feeding period (1 February, 6 March and 29 March 2007 which corresponds to days 11, 44 and 67 of the ad libitum concentrate feeding period). On each sampling occasion, four samples were taken from each animal using three lithium heparin (9 ml) and one sodium fluoride (4 ml) evacuated blood collection vials. Samples were centrifuged at ∼2000 × g for 15 min, and the resulting plasma poured into plastic 5 ml borosilicate glass scintillation vials and stored at −20°C until analysis. Plasma urea, glucose, non-esterified fatty acids (NEFA), cholesterol and beta-hydroxybutyrate (βHB) concentrations were measured on an automatic analyser (Olympus AU 400, Tokyo, Japan) using the reagent kits supplied by Olympus. Plasma concentrations of insulin were quantified using fluoro-immunoassay (AutoDELFIA, PerkinElmer LIfe and Analytical Sciences, Turku, Finland). Intra-assay coefficients of variation (CV) for insulin in bull samples were 6.6%, 4.4% and 2.5% for the low, medium and high standards, respectively, and only one assay was required in the bull analysis. Intra-assay CVs for insulin in steer samples were 4.4%, 4.6% and 4.3% for the low, medium and high standards, respectively. Corresponding, inter-assay CVs were 4.5%, 4.6% and 4.3%. Plasma concentrations of IGF-1 were quantified using radio-immunoassay following an acid–ethanol extraction. Intra-assay CVs for IGF-1 in bull and steer samples were 16.7%, 10.6% and 12.9% for low, medium and high standards, respectively. Inter-assay CVs were 17.2%, 10.9% and 12.9% for low, medium and high standards, respectively.
At slaughter, kidney and channel fat was removed from each carcass and weighed. Hot carcass weight was then recorded and cold carcass weight was taken as 0.98 of hot weight. After 24 h at 4°C, the right side of each carcass was dissected into meat, fat and bone. The side was quartered at the 5th rib into an eight-rib hind-quarter (pistola) and a fore-quarter. The hind-quarter consisted of 13 cuts (silverside, topside, knuckle, rump, cap of rump, tail of rump, fillet, striploin, cube roll, leg, heel, cap of rib and eye of round) and the fore-quarter consisted of 11 cuts (braising muscle, bladesteak, clod, chuck tender, brisket, front shin, flat ribs (rib 1 to 5), plate, chuck, neck and m. triceps brachii). All dissectible fat was removed and where applicable, bones were also removed and cleaned of all adhering tissue. Each meat cut was weighed and recorded separately. Bone, fat and lean trim (small pieces of meat cut away from bone and fat in the dissection process) were recorded separately for the fore- and hind-quarters. Lean trim was subsequently combined with the meat cuts to give meat yield. The combined weights of meat in the fillet, striploin and cube roll was taken to represent the high-value cuts (HVC) in the carcass. This was expressed both as a proportion of the half carcass weight (HVCC) and as a proportion of the half carcass meat weight (HVCM). Calculated carcass value, expressed as cent per kg carcass, was the sum of the commercial value of each meat cut (cent/kg multiplied by the corresponding weight of the cut) with a small deduction for bone expressed as a proportion of the half carcass weight. Estimated animal value (€) was calculated as cold carcass weight (kg) multiplied by calculated carcass value (cent/kg) divided by 100.
Using the five individual traits of the BCI, the observed phenotypic profit measure (€) was calculated for each individual animal using the following series of steps. The phenotypic performance for all five BCI traits of one random animal from the experiment were taken and all animals were then expressed relative to the performance of this animal by subtraction of the chosen animal’s performance from all the trial animals. These new relative performances for each trait were then multiplied by the economic value for the trait as used in the BCI and summed to yield the actual relative profit (€). Thus, the chosen animal’s performance became the basis of comparison with a zero for all traits. The economic values used in this calculation were the same as those used in the February 2008 release of proofs for the calculation of the BCI. These were €1.04 per kg increase in weaning weight, −€21.94 per kg increase in DM intake consumed, €2.34 per kg increase in cold carcass weight, €10.74 per unit increase in carcass conformation score (scale of 1 to 15) and −€6.08 per kg increase in carcass fat score (scale of 1 to 15). The observed difference in value for the progeny of the high and low BCI sires, for each of the five component traits was then expressed as a proportion of the total difference in value. The same analysis was carried out on the sire EPD (as in Table 1) with the expected difference in value between the high and low EPDs for each of the five component traits also was expressed as a proportion of the total difference in value.
Statistical analysis
The associations among genetic merit for BCI, production system and the live animal measurement and carcass trait variables were determined using a fixed effect linear model in PROC GLM (SAS, 2008). Both genetic merit and production system were treated as class variables. Confounding variables adjusted for in the model of analyses, where significant (P < 0.05), were sire breed, dam breed, dam parity and age at the time of the measurement centered within production system. Age centered within production system was treated as a continuous variable.
Preliminary analyses of the plasma hormone and metabolite data revealed that some of the variables were not normally distributed. Therefore, the natural logarithm transformation of insulin, glucose, βHB and IGF-1 were used to normalise the distributions. The associations among genetic merit for BCI, production system and hormone and metabolite variables was determined using mixed models (SAS, 2008), with animal included as a repeated effect. A compound symmetry covariance structure was assumed among records within animal. Confounding variables adjusted for in the model were the same as those already applied, except day of blood sampling nested within production system.
Non-linear associations between age and the dependent variables as well as the possible existence of an interaction between genetic merit and production system were also tested for in the models.
An additional series of analyses was undertaken whereby the independent variable, genetic merit, was included as a continuous variable, with genetic merit defined as one of each of the following: sire BCI, EPDWWT, EPDDMI, EPDCWT, EPDCONF and EPDFAT. Where the dependent variable was live animal measurements or carcass traits, a fixed effect linear model was used. A mixed model was used to quantify the association between sire EPD for the different traits, and the plasma hormone and metabolites with animal included as a repeated effect. Non-linear associations between genetic merit and the dependent variable, and interactions between genetic merit and production system were also investigated. Sire breed was not included in these analyses as genetic evaluations in Ireland are undertaken and presented across breeds.
Results
Live animal measurements
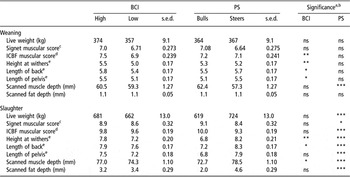
The effect of BCI, when treated as a class variable and production system (bulls and steers) on live animal measurements after weaning and pre-slaughter is summarised in Table 2. The effect of BCI on live animal traits was consistent across both production systems. Progeny of high BCI sires had greater (P < 0.01) ICBF muscularity scores and greater (P < 0.05) skeletal scores after weaning. There was no significant difference in Signet muscularity score or scanned muscle and fat depths between high and low BCI progeny after weaning. Pre-slaughter, there was no significant difference in Signet and ICBF muscularity scores, length of pelvis or scanned fat depth between high and low BCI progeny. However, height at withers, length of back and scanned muscle depth was greater (P < 0.05) for progeny of high BCI sires than those of low BCI sires.
Effect of sire beef carcass index (BCI) and production system (PS) on live animal measurements after weaning and before slaughter

aSignificance levels: ***P < 0.001, **P < 0.01, *P < 0.05, ns = P > 0.05.
bThere were no significant BCI × PS interactions.
cSignet Scoring Procedure; average of three locations, scale 1 (hollow, narrow conformation) to 15 (wide, thick muscled).
dIrish Cattle Breeding Federation muscular scoring system; average of six locations, scale 1 (hollow, narrow conformation) to 15 (wide, thick muscled).
eSkeletal scores, scale 1 (short) to 10 (extended).
Bulls had greater (P < 0.001) scanned muscle depth than steers, however there was no significant difference in any of the other traits measured after weaning. Pre-slaughter, bulls had lower (P < 0.001) live weight, skeletal scores and scanned muscle and fat depths but greater (P < 0.001) muscularity scores than steers.
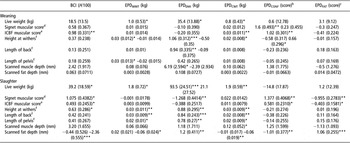
The effect of a €100 increase in sire BCI and a unit increase in sire EPDWWT, EPDDMI, EPDCWT, EPDCONF and EPDFAT on progeny live animal measurements are summarised in Table 3. There were no non-linear effects between any genetic merit traits (BCI and EPDs) and live animal scores observed although the associations sometimes differed between bulls and steers. The ICBF muscularity score after weaning, and Signet and ICBF muscularity scores and height at withers pre-slaughter, increased (P < 0.05) with increasing BCI. The effect of BCI on scanned fat depth pre-slaughter differed with production system with no significant association observed in bulls and a negative (P < 0.001) association in steers. There was no significant effect of BCI on Signet muscularity score, skeletal scores and scanned muscle and fat depths after weaning or on length of back, length of pelvis and scanned muscle depth pre-slaughter.
Regression co-efficients (s.e.) for beef carcass index (BCI), expected progeny differences for weaning weight (EPDWWT), dry matter intake (EPDDMI), carcass weight (EPDCWT), conformation score (EPDCONF) and fat score (EPDFAT) on live animal measurements after weaning and before slaughterFootnote a

a Where the associations differed significantly by system, the solutions are both presented as bulls and steers from left to right.
b EU Beef Carcass Classification Scheme scale 1 (leanest) to 15 (best).
c EU Beef Carcass Classification Scheme scale 1 (poorest) to 15 (fattest).
d Signet Scoring Procedure; an average of three locations, scale 1 (hollow, narrow conformation) to 15 (wide, thick muscled).
e Irish Cattle Breeding Federation muscular scoring system; an average of six locations, scale 1 (hollow, narrow conformation) to 15 (wide, thick muscled).
f Skeletal scores, scale 1(short) to 10 (long).
Pre-slaughter skeletal scores increased (P < 0.05) with increasing sire EPDWWT. The effect of sire EPDWWT on height at withers and length of pelvis after weaning differed with production system with a positive (P < 0.05) effect in bulls and no significant effect in steers. Scanned fat depth pre-slaughter also differed with production system with no significant effect in bulls and a negative (P < 0.05) effect in steers. Pre-slaughter skeletal scores and scanned fat depth increased (P < 0.01), and Signet muscularity score decreased (P < 0.01) with increasing sire EPDDMI. The effect of increasing sire EPDDMI on height at withers, length of back and scanned muscle depth after weaning were significant in bulls but not in steers.
The ICBF muscularity score and height at withers after weaning, and skeletal scores and scanned muscle depth pre-slaughter increased (P < 0.05) with increasing sire EPDCWT. Sire EPDCWT was not significantly associated with pre-slaughter scanned fat depth in bulls but was negatively (P < 0.01) associated in steers. The ICBF muscularity score after weaning and pre-slaughter, and the Signet score pre-slaughter increased (P < 0.05), whereas scanned fat depth pre-slaughter decreased (P < 0.01) with increasing sire EPDCONF. After weaning, the effect of sire EPDCONF on Signet muscularity score differed with production system, with a positive (P < 0.01) effect in bulls and no significant effect in steers. Height at withers, measured at weaning, also differed with production system with increasing sire EPDCONF, in that there was no significant effect in bulls and a positive effect (P < 0.05) in steers. Pre-slaughter, Signet and ICBF muscularity scores decreased (P < 0.05), whereas scanned fat depth increased (P < 0.001) with increasing sire EPDFAT in both production systems.
Carcass composition
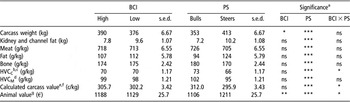
The effect of BCI, when treated as a class variable and production system on progeny carcass composition are summarised in Table 4. Animal value of progeny of high BCI sires was €59 higher (P < 0.05) than the progeny of low BCI sires. There was no significant difference between the two genetic groups (high or low BCI) for kidney and channel fat, carcass meat, fat or bone proportions, HVCC and HVCM or calculated carcass value. Bulls had lower (P < 0.001) kidney and channel fat, carcass fat proportion and animal value, and higher (P < 0.001) carcass meat and bone proportions, HVCC, HVCM and calculated carcass value than steers. The effect of BCI on carcass traits was consistent across both production systems with the exception of HVCC, calculated carcass value and animal value. The significant BCI by production system interaction for these three traits was due to the steer progeny of low BCI sires having lower HVCC, carcass value and animal value than the steer progeny of high BCI sires, while the opposite occurred in bulls.
Effect of sire beef carcass index (BCI) and production system (PS) on carcass composition and value

aSignificance levels: ***P < 0.001, *P < 0.05, ns = P > 0.05.
bHigh-value cuts expressed as a proportion of the carcass.
cBCI × PS interaction values: high BCI, 72 and 67; and low BCI, 74 and 64 for bulls and steers, respectively.
dHigh-value cuts expressed as a proportion of the meat (i.e., excluding bone and fat).
eThe sum of the commercial value of each meat cut with a small deduction for bone expressed as a proportion of the half carcass weight.
fBCI × PS interaction values: high BCI, 310 and 300; and low BCI, 313 and 290 for bulls and steers, respectively.
gBCI × PS interaction values: high BCI, 1106 and 1262; and low BCI, 1107 and 1152 for bulls and steers, respectively.
The effect of a €100 increase in sire BCI and a unit increase in sire EPDWWT, EPDDMI, EPDCWT, EPDCONF and EPDFAT on progeny carcass composition are summarised in Table 5. The effect of BCI on carcass meat proportion, HVCC, calculated carcass value and estimated animal value differed with production system with no significant effect in bulls and a positive (P < 0.01) effect in steers. Carcass fat proportion also differed with production system with no significant effect of BCI in bulls and a negative (P < 0.01) effect in steers.
Regression co-efficients (s.e.) for beef carcass index (BCI), expected progeny differences for weaning weight (EPDWWT), dry matter intake (EPDDMI), carcass weight (EPDCWT), conformation score (EPDCONF) and fat score (EPDFAT) on carcass composition and valueFootnote a

a Where the associations differed significantly by system, the solutions are both presented as bulls and steers from left to right.
b EU Beef Carcass Classification Scheme scale 1 (leanest) to 15 (best).
c EU Beef Carcass Classification Scheme scale 1 (poorest) to 15 (fattest).
d High-value cuts expressed as a proportion of the carcass.
e High-value cuts expressed as a proportion of the meat (i.e., excluding bone and no value on fat).
f The sum of the commercial value of each meat cut with a small deduction for bone expressed as a proportion of the half carcass weight.
Sire EPDWWT was negatively (P < 0.05) associated with calculated carcass value in bulls, whereas there was no significant effect in steers. Kidney and channel fat, and carcass fat and bone proportions increased (P < 0.05), whereas carcass meat proportion, HVCC and calculated carcass value decreased (P < 0.05) with increasing EPDDMI.
The effect of sire EPDCWT on carcass meat proportion, HVCC, HVCM, calculated carcass value and estimated animal value differed with production system with no significant effect of BCI in bulls and a positive (P < 0.05) effect in steers, and on carcass fat proportion with no significant effect in bulls and a negative (P < 0.05) effect in steers.
Kidney and channel fat, and carcass fat and bone proportions decreased (P < 0.05), whereas carcass meat proportion, HVCC, calculated carcass value and estimated animal value increased (P < 0.05) with increasing sire EPDCONF.
Carcass meat proportion, HVCC and calculated carcass value decreased (P < 0.05), whereas carcass fat proportion increased (P < 0.01) with increasing sire EPDFAT. The effect of sire EPDFAT on estimated animal value differed with production system with no significant effect in bulls and a negative (P < 0.05) effect in steers.
Plasma metabolites and hormones
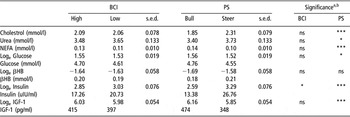
Progeny of high BCI sires had lower (P < 0.05) insulin concentrations than progeny of low BCI sires (Table 6). There was no difference in plasma cholesterol, urea, NEFA, glucose, βHB or IGF-1 concentrations between the two genetic groups (high or low BCI). Bulls had higher (P < 0.05) glucose, NEFA and IGF-1 concentrations and lower (P < 0.05) cholesterol, urea and insulin concentrations compared with steers. There was no difference in βHB concentration between bulls and steers.
Effect of sire beef carcass index (BCI) and production system (PS) on plasma metabolites and hormones

NEFA = non-esterified fatty acids; βHB = beta-hydroxybutyrate; IGF-1 = insulin-like growth factor.
Back transformed least square means are presented where appropriate.
aSignificance levels: ***P < 0.001, *P < 0.05, ns = P > 0.05.
bThere were no significant BCI × PS interactions.
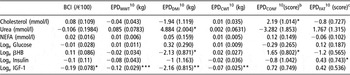
There were no significant associations between BCI, EPDWWT or EPDCWT and plasma cholesterol, urea NEFA, glucose, βHB or insulin concentrations (Table 7). Urea concentrations increased, whereas βHB concentrations decreased with increasing sire EPDDMI. Cholesterol and βHB increased (P < 0.05) with increasing sire EPDCONF, whereas βHB decreased (P < 0.05) with increasing sire EPDFAT. IGF-1 concentrations decreased (P < 0.05) with increasing BCI, EPDWWT, EPDDMI and EPDCWT.
Regression co-efficient (s.e.) for beef carcass sub index, expected progeny differences for carcass weight (EPDCWT), conformation (EPDCONF) and fat (EPDFAT) on plasma metabolites and hormonesFootnote a

NEFA = non-esterified fatty acids; βHB = beta-hydroxybutyrate; IGF-1 = insulin-like growth factor.
a The associations did not differ with production system.
b EU Beef Carcass Classification Scheme scale 1 (leanest) to 15 (best).
c EU Beef Carcass Classification Scheme scale 1 (poorest) to 15 (fattest).
Discussion
In genetic improvement programmes for beef cattle it is of paramount importance to evaluate the effect of selecting for a given trait or index on other economically important traits such as carcass meat yield, (or indicators of meat yield such as ultrasonically scanned muscle and muscularity scores in the live animal) to ensure no unfavourable correlated responses to selection. One method of quantifying the response to selection in traits such as meat yield, that are difficult to measure and require large resources in order to measure them (such as the traits measured in the current study) is a controlled experiment. The regression of these traits on the individual EPDs making up the index is also of interest as the direction and magnitude of the regression coefficient permits the effect of selection on these traits to be estimated.
The main objective of this study, therefore, was to quantify the association between sire BCI (and other measures of genetic merit) and skeletal and muscularity scores, carcass composition as well as plasma concentrations of hormones and metabolites and make inferences as to the potential impact of selection for BCI on these traits.
There were a number of BCI and EPD × production system interactions. These were mainly associated with the effects of BCI on the carcass composition traits. In these interactions, there were significant effects for traits such as carcass meat and fat proportions, proportion of HVC in the carcass, carcass and animal value in steers but not in bulls. One possible explanation is the fact that the sires used in the present study were evaluated in Ireland where 88% of males slaughtered are steers and only 12% are young bulls (Department of Agriculture, Food and Fisheries, 2008). As a result, the genetic evaluations are primarily based on information collected on steers. Also, there is a paucity of information published on the effect of EPD on carcass traits especially direct measurements of meat, fat and bone proportions. Studies are mainly confined to ultrasonic scanning of muscle and fat development and similar measurements.
Beef carcass index
The greater carcass weight of the progeny of the high compared with the low BCI sires was in line with expectations, given the positive and relatively large emphasis within the index on carcass weight which increased by 31 kg per €100 increase in BCI (Table 5). In comparing the progeny of high and low BCI sires the expected profit difference was €42, while the observed profit difference in the progeny was €53, calculated using the phenotypic performance for all five BCI traits (Clarke et al., Reference Clarke, Drennan, McGee, Kenny, Evans and Berry2009). When partitioned across the five individual traits making up the BCI, the expected difference of €42 between the two genetic groups (high and low BCI) comprised proportionately of 0.14 weaning weight, 0.02 DM intake, 0.72 carcass weight, 0.06 carcass conformation score and 0.06 carcass fat score. The corresponding observed profit differences (€53) expressed in the progeny were 0.20, 0.02, 0.65, 0.07 and 0.06, respectively (Clarke et al., Reference Clarke, Drennan, McGee, Kenny, Evans and Berry2009). Thus, the carcass component (weight, conformation score and fat score) contributed 0.78 of the observed profit difference (€53) in the BCI, of which 0.83 was due to carcass weight and the remainder (0.17) due to conformation and fatness.
However, when using the carcass meat yield data, the resulting mean difference in animal value between progeny of high and low BCI sires was found to be €59, of which 0.75 was due to carcass weight and the remainder (0.25) due to carcass meat yield, the indicators of which are conformation and fat scores. Therefore, the proportion contributed by carcass conformation and fat score in the BCI was only two-thirds that obtained when using carcass dissection data. This indicates that for these three traits in the index, greater emphasis should be placed on carcass meat proportion as represented in the index by carcass conformation and fatness. In the long term, increased carcass meat proportion should be the imperative goal for genetic selection of terminal sires in beef cattle production. In this context, Crews et al. (Reference Crews, Enns, Rumoh and Pollak2008) showed that retail product percentage was strongly associated with longissimus muscle area and subcutaneous fat thickness, and had a heritability of 0.41.
While the effect of increasing BCI on its constitutive five traits did not differ with production system (Clarke et al., Reference Clarke, Drennan, McGee, Kenny, Evans and Berry2009), there were interactions between increasing BCI with carcass composition and directly related traits with production system, as already discussed. With increasing BCI, the direction of the associations of the individual traits in steers were all desirable, relative to market requirements, with increases in the proportions of meat and HVC in the carcass, and calculated carcass and animal values. Generally, as carcass weight increases fat content also increases (Keane and Allen, Reference Keane and Allen1999; Drennan et al., Reference Drennan, McGee and Keane2005; Kirkland et al., Reference Kirkland, Keady, Patterson, Kilpatrick and Steen2006), but the results in the present study indicate that selection on BCI leads to increased weight but decreased fat content, which is desirable. One likely explanation is, while there is a positive genetic correlation between carcass weight and fatness (Marshall, Reference Marshall1994; Gregory et al., Reference Gregory, Cundiff and Koch1995; Bertrand et al., Reference Bertrand, Green, Herring and Moser2001; Hickey et al., Reference Hickey, Keane, Kenny, Cromie and Veerkamp2007) the directions of the economic values assigned to each trait in the index differ so that, in this case, selection response is positive for carcass weight and negative for fat. Also, some of these interactions, e.g. fat content, can be explained through the biological differences between steers and bulls. Steers are known to have greater carcass fat proportions than bulls (McGee et al., Reference McGee, Keane, Neilan, Moloney and Caffrey2005) and thus, their fat content may be more responsive to changes in carcass weight than bulls. In addition, as carcass fat proportion increases with increasing carcass weight (Drennan et al., Reference Drennan, McGee and Keane2005; Kirkland et al., Reference Kirkland, Keady, Patterson, Kilpatrick and Steen2006) the fact that bull carcasses averaged 60 kg lighter than steers their rate of fat deposition would be considerably lower.
Although the associations of the live animal and carcass traits with sire BCI in the regression analyses were positive in terms of the desirable beef traits such as carcass meat proportion and the proportion of HVC, most were not significantly different from zero. Indeed, Conroy et al. (Reference Conroy, Drennan, Kenny and McGee2009) reported positive phenotypic correlations of muscularity scores with carcass meat proportion and the proportion of HVC in the carcass. Furthermore, Crews et al. (Reference Crews, Pollack, Weaber, Quaas and Lipsey2003) reported positive genetic correlations between carcass traits (such as longissimus muscle area and fat thickness) and corresponding live animal ultrasound measurements, and concluded that genetic evaluations of carcass traits would be enhanced by the inclusion of live animal ultrasound data on potential replacements.
Muscle development and rapid growth are associated with decreased plasma concentrations of insulin (Hocquette et al., Reference Hocquette, Ortigues-Marty, Pethick, Herpin and Fernandez1998). This agrees with the findings of the present study in that selection for increased BCI resulted in a decrease in concentration of insulin. Findings reported by Moore et al. (Reference Moore, Johnston, Graser and Herd2005) suggested that selection for lower IGF-1 concentrations would result in cattle that have lower feed intake, increased growth and have leaner carcasses. The negative association between IGF-1 concentrations and increasing BCI in the present study are in agreement with findings of Moore et al. (Reference Moore, Johnston, Graser and Herd2005). The lack of a significant effect of increasing sire BCI on the plasma analytes measured such as glucose, cholesterol, NEFA, βHB or urea is consistent with Michel et al. (Reference Michel, McCutcheon, Mackenzie, Tait and Wickham1991), in that, systemic concentrations of these metabolites are more under environmental (i.e. diet, energy status) rather than genetic control.
Expected progeny differences
Weaning weight
Changes in EPDWWT, which accounts for 24% of the total BCI, did not have any important effects on either the live animal scores/measurements or the carcass traits. The higher skeletal scores at slaughter in animals sired by bulls with high EPDWWT are consistent with increased slaughter weight. The only other effects of increased EPDWWT were minimal decreases in carcass meat proportion and carcass value in bulls, and while undesirable, were not of economic importance.
Feed intake
An increase in EPDDMI was associated with increased carcass weight, which is desirable, but also with decreased carcass meat proportion and increased fat and bone proportions, all three of which are undesirable. The significant negative relationship between sire EPDDMI with carcass meat proportion is consistent with the findings in dairy and late-maturing beef breed cross comparisons, whereby Holstein/Friesian cattle were shown to have higher intake and lower carcass meat proportion than similarly managed Charolais cattle (Keane et al., Reference Keane, More O’Ferrall, Connolly and Allen1990; McGee et al., Reference McGee, Keane, Neilan, Moloney and Caffrey2005). Furthermore, Schenkel et al. (Reference Schenkel, Miller and Wilton2004) reported a significant genetic correlation of 0.24 between feed intake and ultrasonically measured back fat thickness, which is consistent with the increases in scanned fat depth and carcass fat proportion per unit increase in sire EPDDMI observed in the present study. Clarke et al. (Reference Clarke, Drennan, McGee, Kenny, Evans and Berry2009) reported an increase in DM intake with increasing sire EPDDMI. The increase in urea concentrations with increased EPDDMI is as expected because urea concentrations are positively associated with dietary nitrogen intake (Walsh et al., Reference Walsh, O’Kiely, Moloney and Boland2008), and systemic concentrations of urea are less influenced by the timing of postprandial blood sampling than other metabolites such as glucose.
Carcass weight
Because carcass weight accounts for a large percentage of the weightings in BCI, trends in the results for EPDCWT were very similar to BCI for carcass composition traits, as already discussed. The increase in scanned muscle depth and carcass meat proportion (in steers only) with increasing EPDCWT is in general agreement with Van Groningen et al. (Reference Van Groningen, Devitt, Wilton and Cranfield2006), who concluded that scanned muscle area is an indicator of size of retail steaks and hence, carcass meat proportion. There were production system interactions for carcass meat proportion, proportion of HVC in the carcass and meat, and carcass value, all of which, showed no effect in bulls but a positive effect in steers. Drennan and McGee (Reference Drennan and McGee2009) reported no significant association between pistola meat and fat proportions and EPDCWT using bull and heifer progeny. Trends in carcass meat proportion in the steers were as expected, in that as growth potential increases, meat proportion increases and fat proportion decreases (McGee et al., Reference McGee, Keane, Neilan, Moloney and Caffrey2005). Because of the method of calculation, carcass value is a reflection of meat proportion in the carcass and as carcass meat proportion increases, value would also be expected to increase accordingly. Furthermore, earlier studies (Delfa et al., Reference Delfa, Ripoll, Panea, Joy and Alberti2007; Drennan et al., Reference Drennan, Keane and McGee2007) have shown that carcass meat proportion, plus the carcass value traits are positively correlated, whereas carcass fat and bone proportions are negatively correlated with carcass weight.
Conformation score
The positive association between sire EPDCONF and live animal muscularity score in the progeny is in agreement with the findings of Drennan et al. (Reference Drennan, Keane and McGee2007) where phenotypic correlations between conformation score and muscularity scores pre-slaughter ranged from 0.81 to 0.87 using different scoring procedures. Similarly, Perry et al. (Reference Perry, McKiernan and Yeats1993) reported a phenotypic correlation of 0.84 between a live animal muscle score and visually assessed carcass conformation score. Using bull and heifer progeny, Drennan and McGee (Reference Drennan and McGee2009) reported that carcass meat proportion increased by 19 g/kg per unit increase in sire EPDCONF, which is in agreement with the present study. The positive associations between meat proportion and carcass value with sire EPDCONF recorded in the current study are also in agreement with the findings of Perry et al. (Reference Perry, McKiernan and Yeats1993). Based on the results of these studies and the present study, selection for EPDCONF should increase meat proportion in the carcass and result in higher value carcasses. In the current study, there was a positive association between sire EPDCONF and plasma concentrations of cholesterol in the progeny. This is in agreement with the findings of Clinquart et al. (Reference Clinquart, Van Eenaeme, Mayombo, Gauthier and Istasse1995) who reported a trend towards higher plasma concentrations of cholesterol in double-muscled Belgian Blue compared with Holstein/Friesian bulls. Furthermore, Crews (Reference Crews2002) reported a regression co-efficient of 1.23 for muscle area and 0.84 for percent lean yield between progeny phenotypic performance and the corresponding sire EPD’s which did not differ from the theoretical expectation of one.
Fat score
The negative association with carcass meat proportion (−16 g/kg) and positive association with fat proportion (14 g/kg), with increases in sire EPDFAT, concurs with corresponding values of −11 g/kg and 6 g/kg per unit increase in carcass fat score, respectively, reported by Drennan and McGee (Reference Drennan and McGee2009) using data containing information from bull and heifer progeny. The decrease in Signet muscularity score at slaughter with increasing EPDFAT is as expected because live animal muscularity score, which is a reflection of conformation score, also decreased as sire EPDFAT increased (Clarke et al., Reference Clarke, Drennan, McGee, Kenny, Evans and Berry2009). The increase of 1.06 mm in scanned fat depth in live animals immediately pre-slaughter per one unit increase in EPDFAT, is consistent with the findings of Hamlin et al. (Reference Hamlin, Green, Cundiff, Wheeler and Dikeman1995) who obtained a significant correlation of 0.80 between scanned fat depth and percentage fat in the carcass. Similarly, Crews (Reference Crews2002) reported a 1.27 mm increase in fat thickness of steer progeny for every 1 mm increase in sire EPD for subcutaneous fat thickness, and 1.26 (score) increase in marbling score for every 1 score increase in sire EPD for marbling score. This and other studies (Crews et al., Reference Crews, Pollak and Quaas2004) showed that selection for carcass traits using EPD would be expected to result in changes in carcass traits of the progeny.
Production system
Production system was confounded with age in that bulls and steers were slaughtered on average at 480 and 720 days of age, respectively. Only traits measured near weaning were taken at comparable ages for steers and bulls, after adjusting for age in the statistical model. Therefore, the general lack of a significant difference in weaning traits between the production systems observed in the present study was not surprising.
In accordance with the present findings, when compared to bulls, skeletal scores taken prior to slaughter were greater in steers (McGee et al., Reference McGee, Keane, Neilan, Moloney and Caffrey2007). Muscularity scores, which are highly correlated with conformation score (Drennan et al., Reference Drennan, McGee and Keane2008), were greater in bulls than steers and consistent with the findings of Keane and Allen (Reference Keane and Allen1998) for carcass conformation. Fat depth, carcass fat proportion (McGee et al., Reference McGee, Keane, Neilan, Moloney and Caffrey2005) and kidney and channel fat (Tanner et al., Reference Tanner, Frahm, Willham and Whiteman1970) was lower, and carcass meat proportion was higher in bulls than steers. Furthermore, the lower plasma concentrations of urea recorded for the bulls reflect the greater conversion of dietary nitrogen to muscle growth and thus, carcass meat proportion. The higher insulin concentrations recorded for steers are indicative of higher body fat (Istasse et al., Reference Istasse, Van Eenaeme, Evrard, Gabriel, Baldwin, Maghuin-Rogister and Bienfait1990) of those animals.
Conclusions
In conclusion, results from this study show that selection using the BCI had a positive effect on live animal muscularity scores, carcass meat proportion, proportion of HVCC and carcass value in steer progeny, which are all very desirable traits in beef production, and no effect on the plasma metabolites measured. Based on carcass meat proportion, the indicators of which in the BCI are conformation and fat scores, findings in the present study would suggest that they should receive greater weightings within beef cattle genetic selection indices such as the BCI.