1 Introduction
The term structure of interest rates, also known as the yield curve, refers to the relationship between bonds of different terms. When interest rates of bonds are plotted against their terms, this is called the yield curve. Constructed by graphing the yield to maturity and the respective outstanding terms of benchmark fixed-income securities, the yield curve is a measure of the market's expectations of future interest rates given the current market conditions.
The Bank of England (2002) estimates two kinds of yield curves for the United Kingdom on a daily basis. One set is based on yields on UK government bonds and on yields in the general collateral repo market. It includes nominal and real yield curves and the implied inflation term structure for the UK. The other set is based on sterling interbank rates (LIBOR) and on instruments related to LIBOR (short sterling futures contracts, forward rate agreements and LIBOR-related interest rate swaps). These commercial bank liability curves are nominal only.
The published figures are estimated spot zero-coupon yields, assuming continuous compounding. Over the period since 1970 a number of different methods have been used to construct these yield curves, always based on the market prices of actual coupon bonds. The current methodology used to construct the yield curves is described in the Bank of England Quarterly Bulletin article by Anderson and Sleath (Reference Anderson and Sleath1999) and a detailed technical description can be found in Anderson and Sleath (Reference Anderson and Sleath2001).
Term structure modelling is influenced by the two different approaches of macroeconomists and of financial economists. While macroeconomists focus on the role of expectations of inflation and future real economic activity in the determination of yields, financial economists avoid any explicit role for such determinants. There are various recent papers which aim to bridge the gap caused by these different approaches by formulating and estimating a yield curve model that integrates macroeconomic and financial factors (Ang and Piazzesi (Reference Ang and Piazzesi2003), Hördahl et al. (Reference Hördahl, Tristani and Vestin2006), Wu (Reference Wu2002), Evans and Marshall (Reference Evans and Marshall1998, Reference Evans and Marshall2001), Kozicki and Tinsley (Reference Kozicki and Tinsley2001), Ang and Bekaert (Reference Ang and Bekaert2003), Dai and Philippon (Reference Dai and Philippon2005), Dewachter and Lyrio (Reference Dewachter and Lyrio2006), Rudebusch and Wu (Reference Rudebusch and Wu2008), Diebold, Piazzesi and Rudebusch (Reference Diebold, Piazzesi and Rudebusch2004), Diebold, Rudebusch and Aruoba (Reference Diebold, Rudebusch and Aruoba2006), Diebold and Li (Reference Diebold and Li2006), Diebold, Li and Yue (Reference Diebold, Li and Yue2008), Lildholdt, Panigirtzoglou and Peacock (Reference Lildholdt, Panigirtzoglou and Peacock2007), Ang, Bekaert and Wei (Reference Ang, Bekaert and Wei2008), Ang, Piazzesi and Wei (Reference Ang, Piazzesi and Wei2006), Kaminska (Reference Kaminska2008)). Most of these papers use US data or data from other countries but Diebold, Li and Yue (Reference Diebold, Li and Yue2008), Lildholdt, Panigirtzoglou and Peacock (Reference Lildholdt, Panigirtzoglou and Peacock2007) and Kaminska (Reference Kaminska2008) use the UK data. This study is a first step towards term structure modelling for actuarial applications by considering the three term structures simultaneously, using the UK data. The objective of this paper is to construct a benchmark yield curve model using nominal, real and implied inflation spot rates provided by the Bank of England. Since we exclude the effect of the macroeconomic factors on the UK yield curves we call the model we propose a ‘yield-only’ model.
Section 2 introduces the term structure data by describing it more fully and presenting some descriptive statistics.
In order to use all available maturities we fit the Cairns model (Cairns, Reference Cairns1998) as a descriptive yield curve model to fill in the gaps in the term structures. Section 3 introduces the Cairns model and discusses the choice of the exponential rate parameter sets by comparing different values for the fixed parameters and the parameter sets which have been obtained by using a least squares method and minimax method with a penalty function.
In Section 4 we describe and estimate the ‘yield-only’ model. To estimate this model, we apply principal component analysis (PCA) in order to decrease the dimension of the data sets by extracting uncorrelated variables from highly correlated yield curves. Using the first three principal components (PCs) of each yield curve we explore the correlations between the term structures and fit a parsimonious time series model to each component. We also analyse the residuals of the models.
In Section 5 we describe how we derive the term structures using the PCs and examine the one-month ahead forecasts by constructing 95% confidence intervals for the forecasts.
In Section 6 we check whether our one-month ahead forecasts satisfy the Fisher relation and whether we can forecast one of the yield curves using the other two. Finally, Section 7 concludes.
2 Data
The Bank of England's nominal government yield curves that we use are available on a daily basis from 2 January 1979, and the real yield curves and implied inflation term structure are available from 2 January 1985 (Bank of England, 2012). The Bank derives the government liability nominal yield curves from UK gilt prices and General Collateral (GC) repo rates. The real yield curves are derived from UK index-linked bond prices. Using the Fisher relationship, the implied inflation term structure is calculated as the difference between instantaneous nominal forward rates and instantaneous real forward rates.
There are many missing values in the data provided by the Bank, due to the existence of non-trading days (weekends and holidays) - which we ignore, maturities outside the range covered by existing gilts and the absence of the shortest and longest market instruments for which reliable prices are available. There is also one missing day for the real and implied inflation curves, Friday 27 September 1996; it is not obvious why this day is missing.
There are missing values at the end of the nominal yield curve because the Bank of England restricts the longest maturity quoted to the longest available single-dated stock; it has not used the prices of “double dated’’ gilts (which give the government an option to repay at any of a number of dates between two fixed dates). In January 1979 there were a considerable number of double-dated stocks, some 31, including six “irredeemable’’, out of 79 stocks quoted; by 2009 there was only one (31/2% War Stock) that was not deemed by the Debt Management Office to be a “rump” stock, too small to have a reliable price, so presumably excluded by the Bank of England.
In January 1979 the longest single-dated stock was 10% Treasury 1999, repayable on 19 May 1999, so the longest yield quoted in the first few months of 1979 was for 20 years, shortening to 19.5 years on 24 May 1979, a few days later. On 25 June 1980 a new stock, 13% Treasury 2000, repayable on 14 July 2000, was issued, so the longest yield quoted increased to 20 years for a few days, then reduced again on 18 July 1980. The term of the longest quoted yields increased as further stocks were issued and then reduced again as their term reduced, with a maximum term of 25 years, which has been maintained since 6% Treasury 2028 was issued on 29 January 1998, followed by even longer stocks, the longest at present being 4% Treasury Gilt 2060, issued on 22 October 2009 and repayable on 22 January 2060. The shortest that the quoted long end has been is 16 years, for a short period in 1984.
At the short end of the Bank's nominal yield curve, yields for 1 year have almost always been quoted, with a few short gaps, but yields for 0.5 years only sporadically, though continuously since 4 January 2000. Before then the Bank did not use stocks of less than three months maturity, so quoted a six month yield only when there was a stock whose maturity was between three and six months away. Since 1997 repo rates have been included in the data used, so shorter terms have almost always been available.
For the real yield curve, which is based on the prices of index-linked stocks, the longest yield given is also 25 years, but in 1985 and 1986 there were periods when it was as short as 16 years. The shortest yield given is 2.5 years, but in December 1996 and January 1997 it increased to 4.5 years. The number of index-linked stocks in issue is relatively small, and the maturity dates are rather sparse as compared with those of the nominal stocks. Further, the method of indexation means that the real yields on short-dated stocks depend heavily on the assumptions that are necessary for calculating them, so yields for shorter maturities are rather uncertain.
On no day is there a maturity for which there is a real yield quoted but no nominal yield, so the implied inflation rates exist for the same periods and terms as the real yields.
We use these nominal government zero-coupon rates extracted from the conventional gilt market, and the real zero-coupon rates and implied inflation spot rates extracted from the index-linked gilt market in our analysis. Unlike previous studies, we use all available maturities i.e. 50 different maturities for nominal rates (from 6 months to 25 years) and 46 maturities for real rates and implied inflation (from 2.5 years to 25 years) to construct the yield curve models.
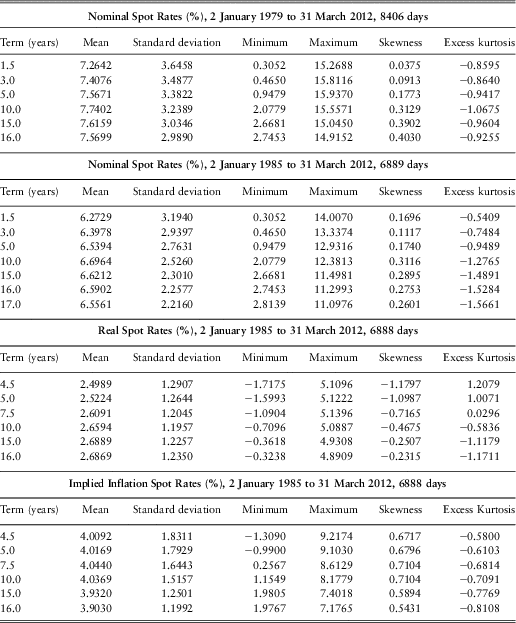
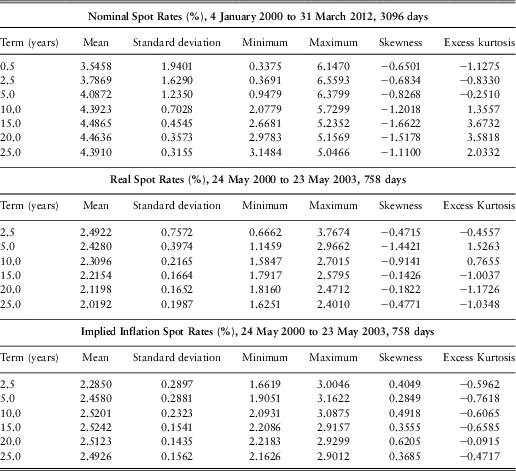
Omitting non-trading days (and the one missing day), we have 8406 daily observations for the nominal zero-coupon rates (from 2 January 1979 to 30 March 2012) and 6888 daily observations for the implied inflation and real spot rates (from 2 January 1985 to 30 March 2012); all are based on half year terms. To begin with, we present some descriptive statistics obtained from the daily rates. However, it would be misleading to quote statistics over different periods for the different terms, so we show in Table 1 statistics for the full range of days that is available and in Table 2 statistics for the longest period with a full range of terms that is available for each term structure (nominal, real and implied inflation). This gives six different sets of statistics. The full range of days is available for Nominal for terms from 1.5 years to 16 years and for Real and Implied Inflation for terms from 4.5 years to 16 years. The longest periods for which the full range of terms is available are, for Nominal, the period from 4 January 2000 to 31 December 2009, 2528 days, and for Real and Implied Inflation only from 24 May 2000 to 23 May 2003, 758 days.
Descriptive Statistics for the Full Range of Days

Descriptive Statistics for the Full Range of Terms
We can see from Table 1 and Table 2 that the means in each set are fairly constant by term, and the standard deviations reduce with term; however, the values are quite different in the different sets. We also see that the skewness is positive for three of the six sets, for each term, and negative for the other three, also for each term. The excess kurtosis is often negative but sometimes positive and sometimes the different terms have different signs. It is worth noting that the real zero-coupon rates recently for shorter terms have been negative.
The series of yields for different terms, for the full range of days, are very highly correlated with each other. For all classes of yield neighbouring terms have correlation coefficients as high as 0.9999 and the furthest apart terms have coefficients of 0.9 for nominal yields and implied inflation, and over 0.86 for real yields. For the shorter periods when full range of terms is available some correlation coefficients are negative. For nominal yields, at the beginning of 2000 short yields were just over 6% and long were about 4.3%. By 2009 short yields had dropped to less than 0.5% and long had risen to 4.5%. The correlation coefficient between the values at the extreme ends was −0.19. There is a similar feature for the rather short period for which real and implied inflation rates are available for the full range of terms.
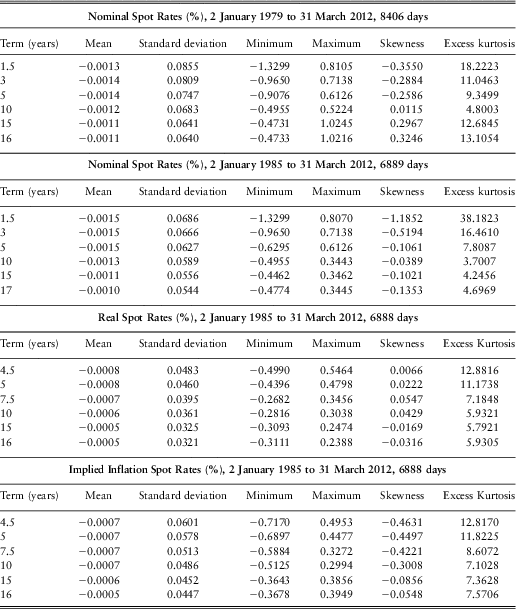
We also calculate the daily differences of the rates, and calculate the same statistics for them, but only for the full range of days, which we show in Table 3.
Descriptive Statistics for Daily Differences for the Full Range of Days
We can see that all the means are small and negative, reflecting the general decline in all rates over the periods. The standard deviations are bigger for shorter terms, and reduce as the term increases. The remarkable feature is the extremely high (excess) kurtosis, and the very large range from lowest to highest observation, as compared with the standard deviation.
Further investigations showed that many of the big jumps in yields have occurred on the day of a change in the UK Bank Base Rate, or the following day or within a few days prior to a change. Such changes in yield curves are not surprising, but this does not account for all the big changes, most of which occur in the period before 1995. There are, however, two artificial reasons why there may be large jumps in the yield curves, beside the natural one of large changes in actual yields on the stocks.
First, in the years prior to about 1995, the taxation system in the UK, whereby many investors paid tax only on interest income, at different rates, but not on capital gains, meant that wealthy individuals, with a high tax rate, preferred low coupon stocks standing at a discount, and pension funds, with zero tax liability, were happy with high coupon stocks, even if standing above par. Investors, such as life offices, with an intermediate tax rate, found stocks with an intermediate coupon acceptable. There was therefore a very strong coupon effect on redemption yields. See Clarkson (Reference Clarkson1979) and Dobbie and Wilkie (Reference Dobbie and Wilkie1978). On 31 December 1978, the day before the observed series starts, the 15-year redemption yields on stocks in the high, medium and low coupon bands as shown in the FT-Actuaries Indices were 14.30%, 13.81% and 12.18%, a substantial variation.
No single yield curve can represent accurately such a market, which is why the FTSE-Actuaries BGS Indices at that time split stocks into three coupon bands. If a single yield curve is used, when a new high coupon stock is added, the average yields rise; when a new low coupon stock is issued, the average falls; the reverse happens when stocks are redeemed, or otherwise are excluded from the indices. Some of the large jumps in the Bank of England's yield curve may be because of this feature. In 1995 the tax basis for many investors was changed to a total return format, and the differential coupon effect disappeared, as can be confirmed from the FTSE-Actuaries BGS Indices.
A second point is that certain mathematical forms which might be used to represent a yield curve may have, as shown by Cairns (Reference Cairns1998), multiple optimum positions. It is possible that on successive days the curve jumps from one local optimum to another, with a consequent change in the shape of the resulting curve. It is possible that some other jumps in the Bank of England's curves are because of this.
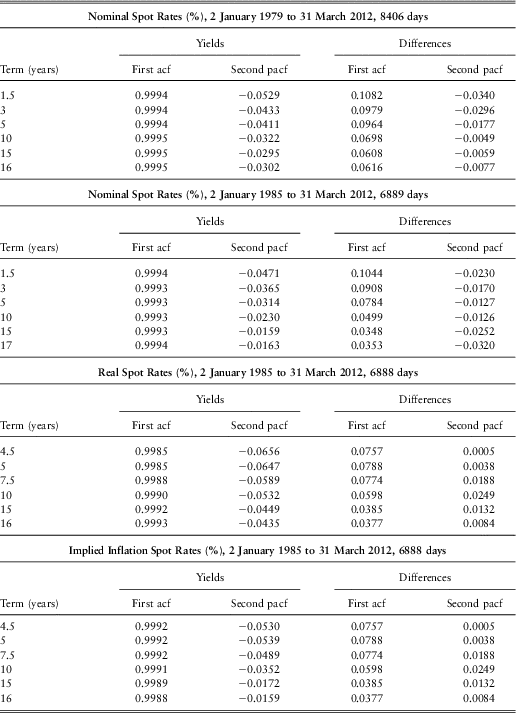
We have also calculated the autocorrelation coefficients and the partial autocorrelation coefficients of the daily values and of the daily differences. In Table 4 we show, for the full range of days, the first autocorrelation coefficient (which is the same as the first partial autocorrelation coefficient) and the second partial autocorrelation coefficient, for the daily yields and for the daily differences.
Autocorrelation coefficients for Yields and Differences, for Full Range
We see that the first autocorrelation coefficients for all the yields are very high, around 0.999 for most terms for each series. This would tempt one to think that the series can each be modelled as having a unit root, so that the first differences should be analysed, rather than the basic values. But we know from other sources, e.g. Homer & Sylla (Reference Homer and Sylla1963) that interest rates are stationary in the long run, so it would be inappropriate to assume that we can safely round 0.999 to unity. The second partial for the yields is, in most cases, negative and quite significant. We note that the standard error of the partials, assuming normality, is  $$${1 \mathord{\left/ {\vphantom {1 {\sqrt n }}} \right. \kern-\nulldelimiterspace} {\sqrt n }} $$$
, where n is the number of cases. For the nominal yields this is 0.0113, for the real yields and implied inflation it is 0.0126. The third and higher partials all show no more significant values than one would expect.
For the differences, the first autocorrelation coefficient is positive, and significant, but never very large, 0.1082 at the highest. These observations indicate that there is very strong first autocorrelation coefficient in the data and a rather weak second one, so that an AR(2) model for the yields or an AR(1) model for the differences might be appropriate if we were interested in a daily model.
However, our objective is to construct a longer term model, so in due course we switch to values at monthly intervals, using the last working day of each month. Further calculations (not shown) indicate that if we take differences of the monthly series the extreme kurtosis is considerably reduced, but not to zero. For nominal yields it is now between 1.5 and 3. The large jumps observable in the daily data are diluted. For real yields the excess kurtosis remains high, at over 12 for the shortest terms, but falling to 3 at the longest. This is mainly attributable to a curious feature of the prices of index-linked stocks between October 2008 and January 2009. The real yields for a 2.5 year term at the end of successive months from the end of September 2008 were: 1.83%, 3.22%, 5.61%, 3.13% and 1.35%. For a 25-year term they were 0.85%, 1.12%, 1.05%, 0.67% and 0.81%, not nearly such a large variation. At the extreme, at the end of November implied inflation was −2.9%. This was in the middle of a financial crisis, but it is not obvious why short-term index-linked stocks should have shown such large price movements (which can be confirmed from the Debt Management Office web site - they are not an artefact of the bank's indices).
A further advantage of using the monthly series is that, at least for the nominal yields, they show features of a first order autocorrelated model, with no second order effects as Table 4 indicates. The curious flutter in index-linked stocks, however, does appear to produce a rather high negative second-order autocorrelation coefficient, the large rises in yields in October and November 2008 being reversed in December and January.
3 A Descriptive Yield-Curve Model for the UK Term Structures: The Cairns Model
A descriptive model can be defined as a model which takes a snapshot of the bond market as it is today. A descriptive model, on its own, gives no indication of how the term structure might change in the future. The sole aim is to get a good description of the rates of interest which are implicit in today's prices (Cairns, Reference Cairns2004).
In this section, we discuss the Cairns model as a descriptive parametric model to fit the daily nominal spot rates (January 1979 – March 2012), real spot rates (January 1985 – March 2012) and implied inflation spot rates (January 1985 – March 2012) published on the Bank of England's web page by changing the values of the parameters to find the best set of values for the missing yields for each data set. The overall aim is to fill in the gaps in the nominal, real and implied inflation term structures data.
There are many possible available alternatives in the way we have dealt with fitting the Cairns model. Investigations showed that they made only fairly small differences to the numerical results for the later parts of this paper, and no difference to the substantive conclusions. We describe them as we go along.
First, we have the data for nominal spot rates from 1979, but for real and implied inflation spot rates only from 1985; we could therefore have omitted the data for nominal rates from 1979 to 1984, so that all three series were fitted over the same period; but we have chosen to use all the available years.
Secondly, at a later stage we use only the interest rates for the last working day of each month, so we could have fitted the Cairns model by using only these end-of-month dates; but we have chosen to use all the available daily data.
Thirdly, we observed that the nominal rates for short terms were, on some days, very irregular, with sometimes the rate for 1 year lying either above or below both of the rates for 0.5 and 1.5 years; the irregularities may be because the Bank of England uses different sources for their curves, it is difficult for the exponential curves in the Cairns model to fit such data readily, so for these days the errors at low durations are rather large; however, we have used all the data.
We shall indicate further choices we made later on.
The forward-rate curve model proposed by Cairns (Reference Cairns1998) is designed to give an indication of what interest rates are currently implied by the market. Thus, it does not provide an arbitrage-free framework within which derivatives can be priced on their own. The curve introduced below is designed to model fixed-interest bond prices. Cairns (Reference Cairns1998) defines f(t, t + s) to be the instantaneous forward rate observed at time t for payments to be made at time t+s, and he expresses f(t, t+s) as a function of t, s, five parameters, b 0(t), b 1(t), b 2(t), b 3(t) and b 4(t), which vary with t, and four parameters, c 1, c 2, c 3 and c 4, which could vary with t or could be taken as the same for all t:
 $$f\left( {t,\,t\, + \,s} \right)\, = \,{{b}_0}\left( t \right)\, + \,{{b}_1}\left( t \right){{e}^{{\rm{ - }}{{c}_1}s}} \, + \,{{b}_2}\left( t \right){{e}^{{\rm{ - }}{{c}_2}s}} \, + \,{{b}_3}\left( t \right){{e}^{{\rm{ - }}{{c}_3}s}} \, + \,{{b}_4}\left( t \right){{e}^{{\rm{ - }}{{c}_4}s}} $$
The curve is a flexible model with four exponential terms and nine parameters in total. However, four of these parameters (the exponential rates) may be fixed. Cairns (Reference Cairns1998) has shown that with such a formula there may well be various local minima when we attempt to optimise for every day. If we keep the same values of the “c” parameters for all days, this reduces the risk of multiple solutions, or at least ensures that we use the same one for each day. If the value of ci, where i = 1,2,3,4, is small then the relevant value of bi affects all durations whereas if ci is large then the relevant value of bi primarily affects the shortest durations. Considering several choices for the vector C = (c 1, c 2, c 3, c 4), Cairns (Reference Cairns1998) suggested using C = (0.2, 0.4, 0.8, 1.6) values which he found to give good results over the period investigated.
Since we fit the curve to spot zero-coupon rates, R(t, t + s), rather than forward rates, we use the representation below of the model which is specified by Cairns (Reference Cairns1998).
 $${ R\left( {t,\,t\, + \,s} \right)\, & = \,\frac{{\rm{1}}}{s}{\int}_{\!\!\!\!{\rm{0}}}^{s} {f\left( {t,\,t\, + \,u} \right)du} \cr &= \,{{b}_0}(t)\, + \,{{b}_1}(t)\frac{{1\,{\rm{ - }}\,{{e}^{{\rm{ - }}{{c}_1}s}} }}{{{{c}_1}s}}\, + \,{{b}_2}(t)\frac{{1\,{\rm{ - }}\,{{e}^{{\rm{ - }}{{c}_2}s}} }}{{{{c}_2}s}}\, + \,{{b}_3}(t)\frac{{1\,{\rm{ - }}\,{{e}^{{\rm{ - }}{{c}_3}s}} }}{{{{c}_3}s}}\, + \,{{b}_4}(t)\frac{{1\,{\rm{ - }}\,{{e}^{{\rm{ - }}{{c}_4}s}} }}{{{{c}_4}s}} \cr}$$
Let Rjk represent the daily nominal zero-coupon rate for term j on day k. On some trading days, yields are not available for all terms as explained in Section 2, and therefore on day k, j takes values from jlo(k) to jhi(k), where jlo(k) and jhi(k) are the lowest and highest terms for which data is available on day k.
For nominal rates kN = 1 to KN = 8406 (2 January 1979 to 30 March 2012), jN = 1 to jN = 50 at the most, and the term tN (j) = jN/2 years. For real rates and implied inflation kR = 1 to KR = 6888 (2 January 1985 to 30 March 2012), jR = 1 to JR = 46 at the most, and the term tR(j) = 2 + j/2 years. We omit subscripts N and R where they are obvious in the context.
We also denote the number of terms for each day as  $$$n(k)\, = \,jhi(k)\,{\rm{ - }}\,jlo(k)\, + \,1 $$$
.
We can rewrite the model for each day as:
 $${ {{{\widehat{R}}}_{jk}}\, = & \,{{b}_{\rm{0}}}(k)\, + \,{{b}_{\rm{1}}}(k)\frac{{{\rm{1}}\,{\rm{ - }}\,{{e}^{{\rm{ - }}{{c}_1}t}} }}{{{{c}_1}t}}\, + \,{{b}_2}(t)\frac{{{\rm{1}}\,{\rm{ - }}\,{{e}^{{\rm{ - }}{{c}_2}t}} }}{{{{c}_2}t}}\, + \,{{b}_3}(k)\frac{{{\rm{1}}\,{\rm{ - }}\,{{e}^{{\rm{ - }}{{c}_3}t}} }}{{{{c}_3}t}}\, \cr & \, + \,{{b}_4}(k)\frac{{{\rm{1}}\,{\rm{ - }}\,{{e}^{{\rm{ - }}{{c}_4}t}} }}{{{{c}_4}t}} \cr}$$
where t = t (j)
There are three approaches we can take to fitting the parameters:
(1) we could fix the values of the c's and optimise the values of the b's for each day;
(2) we could optimise the values for one set of c's, the same for all days, and optimise the values of the b's for each day;
(3) we could optimise the values of the b's and c's jointly for each day
We then need to decide on a criterion for optimising the b's for each day and the c's overall, or both for each day. For the b's we could use either
(a) least squares: for day k we minimise the sum of square of differences between the actual and the estimated rates:
 $$ LS(k)\, = \,\mathop{\sum}\limits_{j\, = \,jlo(k)}^{jhi(k)} {{{{\left( {{{R}_{jk}}\,{\rm{ - }}\,{{{\widehat{R}}}_{jk}}} \right)}}^{\rm{2}}} } $$
(b) minimax: for each day k we minimise the maximum absolute difference between the actual and the estimated rates:
 $$MM(k)\, = \,Max_{{j\, = \,jlo(k)}}^{{jhi(k)}} \left| {{{R}_{jk}}\,{\rm{ - }}\,{{{\widehat{R}}}_{jk}}} \right|$$
The least squares solution would be appropriate if the errors could be thought of as random and possibly normally distributed. But we already have a function fitted by the Bank of England to the source data, and our objective is to replicate this function as best we can, so it can be argued that the minimax solution might be considered more appropriate.
If the values of the c's are fixed, we can find the least squares solution for the b's analytically by inverting a matrix, which is a function of the c's and is the same for each day that has the same range of terms. To find the minimax solution we have to use a search procedure, but once we have found the least squares solution we could first improve it by adjusting the constant term, b 0(k), so that the maximum positive and maximum negative deviations have the same magnitude, and then use these values of the b's as the starting values for the search procedure.
When we wish to optimise the values of the c's overall, keeping them the same for each day, we could use either a least squares or a minimax approach. For least squares we first calculate the root mean square error for each day:
 $$RMS\,(k)\, = \,\sqrt {LS(k/n(k))} $$
and then calculate the mean value of the root mean square error:
 $$MeanRMS\, = \,\mathop{\sum}\limits_{k\, = \,{\rm{1}}}^K {RMS(k)/K} $$
We then choose values of the c parameters that minimise MeanRMS.
For the minimax approach we could optimise either the maximum error over all days, or the mean maximum error over all days, thus either:
 $$ MaxMM(k) $$
or
 $$ MeanMM\, = \,\mathop{\sum}\limits_{k\, = \,{\rm{1}}}^K {MM(k)/K} $$
again choosing values of the c parameters to minimise the chosen function.
However, if we optimise any either of these functions on its own, we can run into difficulties, because the values of c can become negative, or too close to zero, or too close to each other, in which case the matrix mentioned above can become singular or nearly so, or the values of the b's can be unstable. To avoid this we could apply either a penalty rule:
 $$ \matrix{ \!\!\!\!\!\!\!\!\!\!\!\!\!{{c}_1}\, \gt \, \epsi \cr\ {{c}_2}\, \gt \,c1\, + \, \epsi \cr\ {{c}_3}\, \gt \,c2\, + \, \epsi \cr\ \, {{c}_4}\, \gt \,c3\, + \, \epsi \end{} $$
where  $$$\epsi$$$
is suitably small value. In practice it would need to be as big as 0.0001 to avoid numerical problems.
Alternatively we could apply a penalty function:
 $$ P(\underline{c} )\, = \,\gamma \,\times \,\left\{ {\left[ {{{c}_1}\, + \,\frac{{{{c}_2}}}{{{{c}_1}}}\, + \,\frac{{{{c}_3}}}{{{{c}_2}}}\, + \,\frac{{{{c}_4}}}{{{{c}_3}}}} \right]\,{\rm{ - }}\,2\,\times \,log\left[ {{{c}_1}\,\times \,\left( {\frac{{{{c}_2}}}{{{{c}_1}}}\,{\rm{ - }}\,1} \right)\,\times \,\left( {\frac{{{{c}_3}}}{{{{c}_2}}}\,{\rm{ - }}\,1} \right)\,\times \,\left( {\frac{{{{c}_4}}}{{{{c}_3}}}\,{\rm{ - }}\,1} \right)} \right.} \right\} $$
with the condition that 0 < c 1 < c 2 < c 3 < c 4 and with γ = 0.0001
We then minimise MeanRMS + P(c) to find the best overall values of the c's.
After trying different values of γ (0.0001, 0.00001, 0.000001 and 0.0000001) to decrease the effect of the penalty function to see how much it dominates the original optimisation equation, we decided to use 0.0001 since decreasing the number makes the c values closer. However, the penalty rule noted above, or an alternative penalty function would give slightly different results.
We found that, with approach (3), optimising the values of the b's and c's jointly on each day, the values are extremely unstable, and on some days it is difficult to find a satisfactory solution, so we did not proceed further with this approach; but we used both of the first two.
By investigating both the least squares and the minimax method with fixed values of the c parameters, we found that the differences in the results by the two methods are quite small, so we used the least squares method, which is computationally very much faster.
We started by trying three fixed parameter sets which have been suggested by (Cairns, Reference Cairns1998) and Cairns and Pritchard (Reference Cairns and Pritchard2001), and then we used the least squares criterion with the penalty to find the optimised set of parameters for each set of yield curve data.
The three fixed sets of the C parameters are: (C1 = (0.2, 0.4, 0.8, 1.6), C2 = (0.1, 0.2, 0.4, 0.8), and C3 = (0.2, 0.4, 0.6, 0.8). We then optimise for each set of spot rates separately and obtain the optimal results: COpt(Nom) = (0.15, 0.24, 0.40, 0.87), COpt(Real) = (0.07, 0.19, 0.57, 1.40) and COpt(Imp) = (0.09, 0.15, 0.25, 0.43). In each case we optimise the b parameters for every day using each set.
We compare these models by examining the root mean squared errors, fitted values for some specific dates and fitted values for short (6 months to 5 years), medium (5.5 to 15 years) and long (15.5 to 25 years) term maturities for each yield curve to choose the best set of C parameters (see Sahin (Reference Sahin2010)). We present only the root mean squared errors analysis to compare the performance of these four different models in this paper.
Table 5 shows that optimised parameter sets (C Opt) displayed as Model 4 give the lowest mean RMS for all three yield curves. The optimised parameter sets also give the lowest values when we use Maximum RMS method for nominal and implied inflation spot rates while Model 2 gives the minimum value for the real spot rates. Thus, we use optimised parameter sets to fill in the gaps in all three yield curves.
Mean RMS and Maximum RMS for Different C Parameter Sets for Nominal, Real and Implied Inflation Spot Rates

4 The ‘Yield-Only’ Model
Once we fit the Cairns model to the UK yield curves we apply the PCA to the hybrid data to decrease the dimension of the data. The aim is to reduce the dimension of the yield curves in order to obtain uncorrelated variables from highly correlated data to construct yield curve models.
Instead of using the original Bank of England yield curve data to apply the PCA, we use hybrid data which are constructed by using the original values and the fitted Cairns values for the missing data in order to consider a full range of maturities in our analysis. If we used the original yield curves we would eliminate the maturities which include missing values and this would lead us to continue our analysis without the short end and long end of the yield curves. It is convenient to use hybrid data to model the term structures as the Cairns model fits the yield curve data quite well. However, it should also be mentioned that using the hybrid data might have influences on the shape of the principal components through the fitted values produced by the Cairns model; particularly for the long end of the yield curves because of the missing data.
We use monthly data to construct the UK ‘yield-only’ model.
4.1 Applying PCA to the UK Term Structures
We apply the PCA to the mean adjusted monthly hybrid data to decrease the dimension of the data by extracting uncorrelated components. This approach was first applied to bond yields by Litterman and Scheinkman (Reference Litterman and Scheinkman1991), who found three common factors that influenced the returns on all treasury bonds. When we apply PCA we see that the first three principal components explain almost all the variability in the data sets.
The first factor, level, accounts for about 96%, 95% and 94% for the nominal, real and implied inflation spot rates respectively. Slope factors account for about 4%, 5% and 5% and curvatures account for less than 1% for all yield curves. Thus, the first three principal components explain more than 99% of the variability in the term structures. Although the curvature factors seem to explain very little amount, it is important to include this component to capture the hump shape of the yield curves for some specific dates.
Figure 1 shows the loadings of the first three principal components for the monthly fitted yield curves. The first factor, level is relatively flat and represents an approximately parallel shift in the yield curve; the second factor, slope takes negative values on the short maturities and positive values on the long maturities to capture the slope of the curve and the third factor, curvature takes negative values for the short and long maturities and positive values for the medium maturities to give the hump shape to the yield curve.
Loadings of the PCs for the Daily Hybrid Yield Curves
4.2 Correlations between the Yield Curve Factors
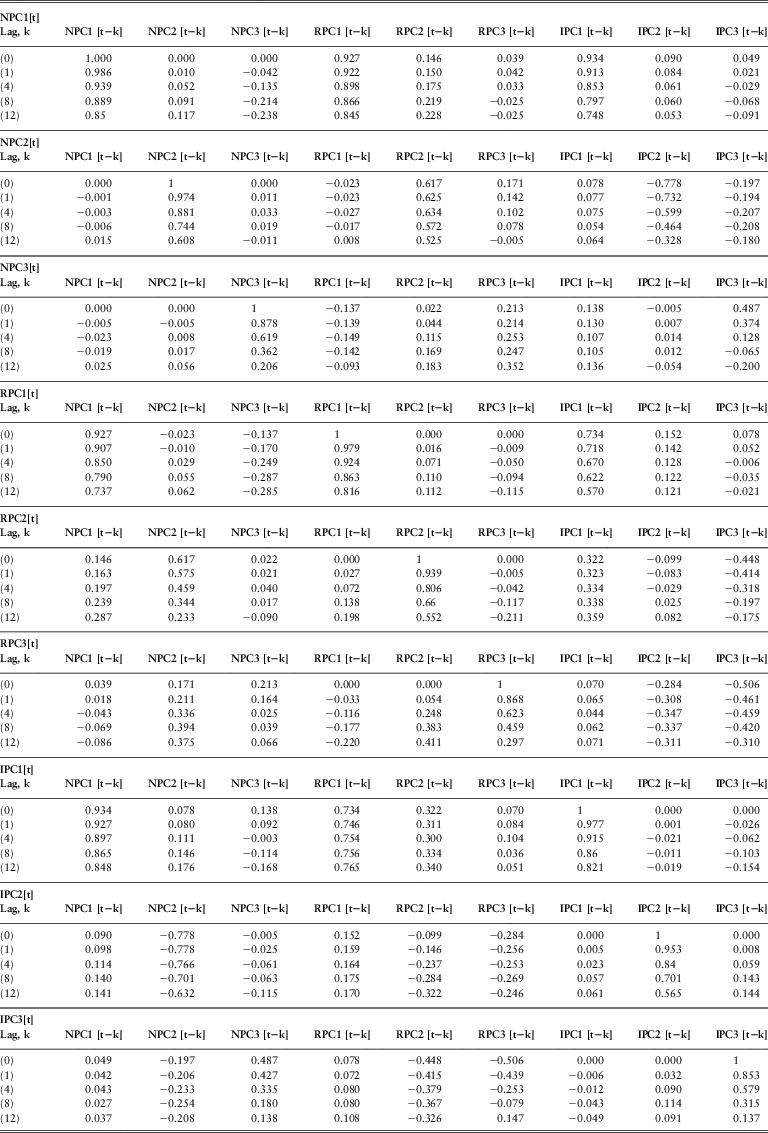
Table 6 shows the lagged correlations between the PCs of the three yield curves. The lag k value in the tables is the correlation between x[t] and y[t − k] where x[t] is the variable whose autocorrelation function has been calculated and y[t − k] represents all the other variables. We use N, R and I as the abbreviations for the nominal spot rates, real spot rates and implied inflation respectively. PC represents the principal component.
Lagged Correlations between the Monthly Yield Curves
As seen from the tables below, all PCs have strong auto-correlations. The auto-correlation functions of the first PCs (NPC1, RPC1 and IPC1) decay very slowly and even for the lag 12 the auto-correlation coefficients are higher than 0.80. This might indicate non-stationarity in the data. However we assume that the variables are stationary. It is more an economic assumption rather than a statistical one. We do not have a sufficiently long period of data here to justify the stationarity of the yield curves, but observation over far longer periods shows that yields must be stationary (Homer, 1963)
We also take the first difference of each PC and calculate the correlation coefficients. Taking the difference removes the auto-correlations and produce stationary ‘random walk’ series. Since modelling the yield curves using AR processes is economically reasonable we will continue our study by using the yield curve data themselves instead of the changes.
The high auto-correlations in the first PCs indicate that the level of the spot rates highly depends on the level of the previous month rates.
The lagged cross-correlations between the first PCs of the yield curves are quite high. This is consistent with the Fisher relation which defines the nominal interest rates as the sum of the expected future inflation (implied inflation) and real interest rates. The second PCs (slope factors) and the third PCs (curvature factors) of the yield curves also have significant simultaneous and lagged cross-correlations.
4.3 Fitting AR(1) Models to the Monthly PCs
Once we examine the correlations between the PCs of the yield curves we get an intuition for a possible vector autoregressive model for the series. Initially we start with a vector autoregressive model for each PC but after eliminating the insignificant variables we find that the AR(1) process is the most appropriate model for each of them.
Before introducing the models we describe how we obtain the PCs of the yield curves as time series in formulas.
Let XM be the matrix of monthly yield curve data for the period 1985–2012 where:
 $$${{X}_{{{M}_N}}}$$$
: Nominal spot rates (327 × 49)
 $$${{X}_{{{M}_R}}}$$$
: Real spot rates (327 × 46)
 $$${{X}_{{{M}_I}}}$$$
: Implied inflation spot rates (327 × 46)
The first three PCs can be obtained by decomposing the covariance matrix into the eigenvectors and eigenvalues. This decomposition can be shown for the nominal spot rates as below:
 $$ U_{N}^{t} {{C}_N}{{U}_N}\, = \,{{L}_N} $$
where
CN: covariance matrix of the nominal spot rates (49 × 49)
UN: matrix of eigenvector of CN (49 × 3)
LN: eigenvalues of CN (3 × 3) (diagonal matrix)
The eigenvectors extracted using Equation 6 are called the loadings of the PCs. Using first three loadings which explain more than 99% of the variability in the data and the nominal yield curve data we obtain the first three PCs for the nominal rates.
 $${{M}_N}\, = \,{{X}_{{{M}_N}}}{{U}_N}$$
where
MN: principal components of the monthly nominal spot rates (327 ×3)
Let M be the matrix of the monthly PCs where:
 $$${{M}_{{{N}_L}}}$$$
: level component of the nominal spot rates (327 × 1)
 $$${{M}_{{{N}_S}}}$$$
: slope component of the nominal spot rates (327 × 1)
 $$$ {{M}_{{{N}_C}}} $$$
: curvature component of the nominal spot rates (327 × 1)
 $$${{M}_{{{R}_L}}}$$$
: level component of the real spot rates (327 × 1)
 $$${{M}_{{{R}_S}}}$$$
: slope component of the real spot rates (327 × 1)
 $$${{M}_{{{R}_C}}}$$$
: curvature component of the real spot rates (327 × 1)
 $$${{M}_{{{I}_L}}}$$$
: level component of the implied inflation spot rates (327 × 1)
 $$${{M}_{{{I}_S}}}$$$
: slope component of the implied inflation spot rates (327 × 1)
 $$${{M}_{{{I}_C}}}$$$
: curvature component of the implied inflation spot rates (327 × 1)
The structure of the ‘yield-only’ model is as below:
 $$ M[t]\,{\rm{ - }}\,{{\mu }_M}\, = \,A\left( {M[t\,{\rm{ - }}\,1]\,{\rm{ - }}\,{{\mu }_M}} \right)\, + \,{{ \epsi }_M}[t] $$
where:
μM is the matrix of long run mean of the variables, A is the coefficient matrix for the first lag of the explanatory variables and  $$${{ \epsi }_M}[t]\, \sim \,\left( {0,\,{{\sum }_M}} \right) $$$
, i.e. the residuals with zero mean and ∑M variance-covariance matrix. The autoregressive coefficients in matrix A are very close to 1 particularly for level factors which indicates that the models are close to random walk models. However, when we examine the standard errors of the parameters we see that except for the nominal level, slope and real level factors, all the coefficients are significantly different from 1, i.e. they are at least two standard errors far from 1. For the three models mentioned the parameters are 1 standard error away from 1.
 $$M\, = \,\left[ \matrix {{{{M}_{{{N}_L}}}} \cr\ {{{M}_{{{N}_S}}}} \cr\ {{{M}_{{{N}_C}}}} \cr\ {{{M}_{{{R}_L}}}} \cr\ {{{M}_{{{R}_S}}}} \cr\ {{{M}_{{{R}_C}}}} \cr\ {{{M}_{{{I}_L}}}} \cr\ {{{M}_{{{I}_S}}}} \cr\ {{{M}_{{{I}_C}}}} \\\end{}} \right]$$
 $$ \limits{\widehat\mu }_{M}^{t}} = \left[ \matrix{ 0 &#x0026; 0 &#x0026; 0 &#x0026; 0 &#x0026; 0 &#x0026; 0 &#x0026; 0 &#x0026; 0 &#x0026; 0 \\\end{}} \right] $$
 $$ \mathop{\widehat{A}}\, = \,\left[ \matrix { {0.995} &#x0026; 0 &#x0026; 0 &#x0026; 0 &#x0026; 0 &#x0026; 0 &#x0026; 0 &#x0026; 0 &#x0026; 0 \cr\ 0 &#x0026; {0.977} &#x0026; 0 &#x0026; 0 &#x0026; 0 &#x0026; 0 &#x0026; 0 &#x0026; 0 &#x0026; 0 \cr\ 0 &#x0026; 0 &#x0026; {0.882} &#x0026; 0 &#x0026; 0 &#x0026; 0 &#x0026; 0 &#x0026; 0 &#x0026; 0 \cr\ 0 &#x0026; 0 &#x0026; 0 &#x0026; {0.998} &#x0026; 0 &#x0026; 0 &#x0026; 0 &#x0026; 0 &#x0026; 0 \cr\ 0 &#x0026; 0 &#x0026; 0 &#x0026; 0 &#x0026; {0.952} &#x0026; 0 &#x0026; 0 &#x0026; 0 &#x0026; 0 \cr\ 0 &#x0026; 0 &#x0026; 0 &#x0026; 0 &#x0026; 0 &#x0026; {0.874} &#x0026; 0 &#x0026; 0 &#x0026; 0 \cr\ 0 &#x0026; 0 &#x0026; 0 &#x0026; 0 &#x0026; 0 &#x0026; 0 &#x0026; {0.979} &#x0026; 0 &#x0026; 0 \cr\ 0 &#x0026; 0 &#x0026; 0 &#x0026; 0 &#x0026; 0 &#x0026; 0 &#x0026; 0 &#x0026; {0.954} &#x0026; 0 \cr\ 0 &#x0026; 0 &#x0026; 0 &#x0026; 0 &#x0026; 0 &#x0026; 0 &#x0026; 0 &#x0026; 0 &#x0026; {0.858} \\\end{}} \right] $$
 $${{\mathop{\widehat\rSigma }}_M}\, = \,\left[ \matrix { {{\rm{3}}{\rm{.06}}} &#x0026; {} &#x0026; {} &#x0026; {} &#x0026; {} &#x0026; {} &#x0026; {} &#x0026; {} &#x0026; {} \cr\ {{\rm{ - 0}}{\rm{.38}}} &#x0026; {{\rm{0}}{\rm{.57}}} &#x0026; {} &#x0026; {} &#x0026; {} &#x0026; {} &#x0026; {} &#x0026; {} &#x0026; {} \cr\ {{\rm{0}}{\rm{.26}}} &#x0026; {{\rm{ - 0}}{\rm{.01}}} &#x0026; {{\rm{0}}{\rm{.09}}} &#x0026; {} &#x0026; {} &#x0026; {} &#x0026; {} &#x0026; {} &#x0026; {} \cr\ {{\rm{1}}{\rm{.06}}} &#x0026; {{\rm{ - 0}}{\rm{.24}}} &#x0026; {{\rm{0}}{\rm{.10}}} &#x0026; {{\rm{1}}{\rm{.42}}} &#x0026; {} &#x0026; {} &#x0026; {} &#x0026; {} &#x0026; {} \cr\ {{\rm{ - 0}}{\rm{.04}}} &#x0026; {{\rm{0}}{\rm{.16}}} &#x0026; {{\rm{0}}{\rm{.01}}} &#x0026; {{\rm{ - 0}}{\rm{.40}}} &#x0026; {{\rm{0}}{\rm{.40}}} &#x0026; {} &#x0026; {} &#x0026; {} &#x0026; {} \cr\ {{\rm{0}}{\rm{.03}}} &#x0026; {{\rm{ - 0}}{\rm{.01}}} &#x0026; {{\rm{0}}{\rm{.01}}} &#x0026; {{\rm{0}}{\rm{.07}}} &#x0026; {{\rm{ - 0}}{\rm{.02}}} &#x0026; {{\rm{0}}{\rm{.05}}} &#x0026; {} &#x0026; {} &#x0026; {} \cr\ {{\rm{1}}{\rm{.91}}} &#x0026; {{\rm{ - 0}}{\rm{.07}}} &#x0026; {{\rm{0}}{\rm{.17}}} &#x0026; {{\rm{ - 0}}{\rm{.41}}} &#x0026; {{\rm{0}}{\rm{.4}}} &#x0026; {{\rm{ - 0}}{\rm{.04}}} &#x0026; {{\rm{2}}{\rm{.29}}} &#x0026; {} &#x0026; {} \cr\ {{\rm{0}}{\rm{.39}}} &#x0026; {{\rm{ - 0}}{\rm{.33}}} &#x0026; {{\rm{0}}{\rm{.06}}} &#x0026; {{\rm{ - 0}}{\rm{.07}}} &#x0026; {{\rm{0}}{\rm{.22}}} &#x0026; {{\rm{ - 0}}{\rm{.02}}} &#x0026; {{\rm{0}}{\rm{.43}}} &#x0026; {{\rm{0}}{\rm{.48}}} &#x0026; {} \cr\ {{\rm{ - 0}}{\rm{.10}}} &#x0026; {{\rm{ - 0}}{\rm{.03}}} &#x0026; {{\rm{ - 0}}{\rm{.05}}} &#x0026; {{\rm{ - 0}}{\rm{.07}}} &#x0026; {{\rm{0}}{\rm{.05}}} &#x0026; {{\rm{0}}{\rm{.03}}} &#x0026; {{\rm{ - 0}}{\rm{.03}}} &#x0026; {{\rm{0}}{\rm{.04}}} &#x0026; {{\rm{0}}{\rm{.09}}} \\\end{}} \right]$$
We display the correlation matrix,  $$$\widehat{\rho }_M $$$
, for the residuals below. We assume that the coefficients which are greater or less than three standard errors (0.17) are significant (Chatfield, Reference Chatfield2004). Therefore, we see several significant correlations between the residuals in the matrix
 $$$\widehat{\rho }_M $$$
. These significant correlations may be caused by various reasons. One reason is that we exclude the simultaneous explanatory variables in the modelling work. As we observe in Table 6 there are very strong simultaneous correlations particularly between the corresponding PCs of the three yield curves. The high correlations between the residuals for the level and slope factor models may be due to these strong simultaneous correlations between the level and slope components.
 $$ \mathop{\widehat\rho _M}\, = \,\left[ \matrix { {{\rm{1}}{\rm{.00}}} &#x0026; {} &#x0026; {} &#x0026; {} &#x0026; {} &#x0026; {} &#x0026; {} &#x0026; {} &#x0026; {} \cr\ {{\rm{ - 0}}{\rm{.29}}} &#x0026; {{\rm{1}}{\rm{.00}}} &#x0026; {} &#x0026; {} &#x0026; {} &#x0026; {} &#x0026; {} &#x0026; {} &#x0026; {} \cr\ {{\bf {{0}}}{\bf {{.51}}}} &#x0026; {{\rm{ - }}0.04} &#x0026; {1.00} &#x0026; {} &#x0026; {} &#x0026; {} &#x0026; {} &#x0026; {} &#x0026; {} \cr\ {\bf{0.51}} &#x0026; { - 0.26} &#x0026; {0.29} &#x0026; {1.00} &#x0026; {} &#x0026; {} &#x0026; {} &#x0026; {} &#x0026; {} \cr\ {{\rm{ - 0}}{\rm{.04}}} &#x0026; {{\rm{0}}{\rm{.34}}} &#x0026; {{\rm{0}}{\rm{.06}}} &#x0026; {{\bf {{ - 0}}}{\bf {{.53}}}} &#x0026; {{\rm{1}}{\rm{.00}}} &#x0026; {} &#x0026; {} &#x0026; {} &#x0026; {} \cr\ {{\rm{0}}{\rm{.09}}} &#x0026; {{\rm{ - 0}}{\rm{.05}}} &#x0026; {{\rm{0}}{\rm{.16}}} &#x0026; {{\rm{0}}{\rm{.28}}} &#x0026; {{\rm{ - 0}}{\rm{.17}}} &#x0026; {{\rm{1}}{\rm{.00}}} &#x0026; {} &#x0026; {} &#x0026; {} \cr\ {{\bf {{0}}}{\bf {{.72}}}} &#x0026; {{\rm{ - 0}}{\rm{.06}}} &#x0026; {{\rm{0}}{\rm{.37}}} &#x0026; {{\rm{ - 0}}{\rm{.23}}} &#x0026; {{\bf {{0}}}{\bf {{.42}}}} &#x0026; {{\rm{ - 0}}{\rm{.13}}} &#x0026; {{\rm{1}}{\rm{.00}}} &#x0026; {} &#x0026; {} \cr\ {{\rm{0}}{\rm{.32}}} &#x0026; {{\bf {{ - 0}}}{\bf {{.62}}}} &#x0026; {{\rm{0}}{\rm{.37}}} &#x0026; {{\rm{ - 0}}{\rm{.23}}} &#x0026; {{\bf {{0}}}{\bf {{.49}}}} &#x0026; {{\rm{ - 0}}{\rm{.13}}} &#x0026; {{\bf {{0}}}{\bf {{.41}}}} &#x0026; {{\rm{1}}{\rm{.00}}} &#x0026; {} \cr\ {{\rm{ - 0}}{\rm{.19}}} &#x0026; {{\rm{ - 0}}{\rm{.14}}} &#x0026; {{\bf {{ - 0}}}{\bf {{.55}}}} &#x0026; {{\rm{ - 0}}{\rm{.19}}} &#x0026; {{\rm{0}}{\rm{.27}}} &#x0026; {{\bf {{0}}}{\bf {{.51}}}} &#x0026; {{\rm{ - 0}}{\rm{.08}}} &#x0026; {{\rm{0}}{\rm{.20}}} &#x0026; {{\rm{1}}{\rm{.00}}} \\\end{}} \right] $$
4.4 Residual Analysis
Once we fit the AR(1) models we obtain the residuals using the estimated parameters and apply some statistical tests on the residuals. To begin with, we inspect whether the residuals are independent and whether there is an ARCH effect. We calculate the auto-correlation coefficients up to lag 36 (i.e. three years) and examine if there is any significant correlations or pattern in the auto-correlation functions. An indication of ARCH is that the residuals will be uncorrelated but the squared residuals will show auto-correlation.
Figure 2 shows the auto-correlation plots for the residuals of the nominal principal components. Although some of the correlation coefficients are slightly significant considering both the residuals and the squared residuals, they are not large. Therefore we can conclude that the residuals can be assumed to be independent and there is no ARCH effect in the data, noting that we use data at monthly intervals; there might be short term, e.g. daily, ARCH effect which we cannot observe.
Auto-correlation Functions for the Nominal Spot Rates Residuals
Figure 3 shows the auto-correlation plots for the residuals of the real principal components. The residuals seem independent although there are some significant auto-correlation coefficients as we have for the nominal residuals. The auto-correlation coefficients for the squared residuals of the slope component indicates that there are two significant correlations and particularly the first lag correlation is quite high (0.752). The partial auto-correlation function of this component also shows two significant and high correlations. As for the other two components, the partical auto-correlation functions indicate some significant but low correlations which might be ignored.
Auto-correlation Functions for the Real Spot Rates Residuals
Figure 4 shows the auto-correlation plots for the residuals of the implied inflation principal components. Some of the auto-correlation coefficients of the residuals are significant. However, they are not large. On the other hand, the auto-correlation coeffients of the squared residuals for the level and the slope factors display some high and significant correlations.
Auto-correlation Functions for the Implied Inflation Spot Rates Residuals
By analysing Figure 2, Figure 3 and Figure 4 which display the auto-correlation coefficients of the squared residuals, we see that the residuals might not be distributed normally. Table 7 shows the descriptive statistics such as mean, standard deviation, skewness and excess kurtosis for each set of residuals. All the means are either zero while the standard deviations vary. The skewness of the slope factors residuals for the nominal and implied inflation models are relatively high. Except for the nominal level and curvature factors residuals all the kurtosis of the residuals are quite high. This supports our doubts about the distribution of the residuals. Since the kurtosis coefficients are high the normal distribution is not suitable to fit these residuals. The Jarque-Bera test results also show that the residuals except for the nominal level factor model are not distributed normally. According to the statistics presented in Table 7, we need a symmetric distribution like a normal distribution with a higher kurtosis for the residuals. We consider two distributions which might be appropriate for the monthly residuals. One distribution is the Student's t distribution and the other is the logistic distribution. Our analysis has shown that the kurtosis of the residuals are too high to be fitted properly by Student's t distribution either. On the other hand, the logistic distribution fits each set of residuals with very close location (close to 0) and scale (close to 0.5) parameters. As seen in Table 7 when we use the Kolmogorov-Smirnov goodness of fit test (KS-test) to decide whether the residuals can be modelled by a logistic distribution in the table, we fail to reject at 3% level that the residuals of the models have a logistic distribution with the given parameters.
Residual Analysis of the Yield-Only Model

5 Forecasting
After modelling the PCs of the yield curves, we test these models by forecasting one-month ahead spot rates using the estimated parameters. In order to compare our forecasts with the fitted spot rates we have fitted the models to the data recursively; starting with the first 24 months and ending with 326 months. As we increase the data period, we apply the PCA, re-fit the model and estimate the parameters for that period. Afterwards, we use the parameters for each period to forecast the next month's level, slope and curvature factors of the spot rates. As a final step, we convert the forecasts for PCs into the spot rates, i.e. we derive the fitted yield curves by using these three PCs. We obtain the fitted spot rates back as below.
 $$ {{\widehat{X}}_N}\, = \,{{Y}_N}U_{N}^{t} $$
where
 $$${{\widehat{X}}_N}$$$
: forecast for the fitted nominal spot rates (i × 3)
YN: principal components of the monthly nominal spot rates (i × 3)
UN: eigenvectors of the covariance of the nominal spot rates (49 × 3)
i = 25, 26, …, 327
We also calculate the variance for forecasts for the nominal spot rates for each maturity of each observation as below:
 $$ { Var\big( {{{{\widehat{X}}}_N}} \big)\, &#x0026; = \,Var\left( {{{Y}_N}U_{N}^{t} } \right) \cr &#x0026; \, = \,{{U}_N}Var\left( {{{Y}_N}} \right)U_{N}^{t} \cr &#x0026; \, = \,{{U}_N}{{\rSigma }_i}U_{N}^{t} \cr} $$
where
Σi: the variance-covariance matrix of the residuals for the fitted nominal spot rates (3 × 3)
We calculate the variance-covariance matrix of the residuals for each set of recursive estimates to construct the confidence intervals for the forecasts.
This sort of ‘in-sample forecasting’ enables us to compare how far our forecasts are from the fitted spot rates. Furthermore, we also calculate the 95% confidence intervals for these forecasts by assuming the residuals have a logistic distribution with the specified parameters discussed above (we use ∓1.83 as the quantiles of the logistic distribution for the 95% confidence intervals). Figure 5, Figure 6, Figure 7, Figure 8, Figure 9 and Figure 10 show one-month ahead forecasts with 95% confidence bands and the forecast erros for the nominal, implied inflation and the real spot rates respectively. One-month ahead forecasts seem quite close to the fitted spot rates for all three yield curves. It is not surprising that the forecasts seem like ‘random walk’ forecasts since the AR(1) coefficients are very close to 1. The confidence intervals shrink as the data period extends. Due to having more information by fitting the models on to longer data sets the residuals and thus the variance of the residuals get smaller. This leads to smaller confidence interval bands. We can examine the performance of our forecasts by calculating the percentage of the fitted spot rates out of the confidence bands for each maturity and each yield curve. Since we construct the 95% confidence intervals we expect about 5% of the fitted values are out of the bands. The ratios for the nominal, real and implied inflation yield curves which are outside the confidence bands are 4.8%, 6.4% and 4.0% respectively. Since these percentages are not far from 5% we can conclude that our forecasts are good enough (see Sahin (Reference Sahin2010) for details). Finally, Figures 6, 8 and 10 show that as the maturity increases the forecast errors decrease.
1-Month Ahead Forecasts with Upper and Lower Confidence Limits for Nominal Spot Rates (%)
Difference Between the Observed and Forecasted Nominal Spot Rates (%)
1-Month Ahead Forecasts with Upper and Lower Confidence Limits for Real Spot Rates (%)
Difference Between the Observed and Forecasted Real Spot Rates (%)
1-Month Ahead Forecasts with Upper and Lower Confidence Limits for Implied Inflation Spot Rates (%)
Difference Between the Observed and Forecasted Implied Inflation Spot Rates (%)
6 Fisher Relation Check
As mentioned in Section 1 nominal interest rates embody the real interest rates plus a compensation for the erosion of the purchasing power of this investment by inflation. The Bank of England uses this decomposition, which is also known as the Fisher relation and nominal and real yield curves to calculate the implied inflation rate factored into nominal interest rates. Since we model these three yield curves separately, we can check whether our one-month ahead forecasts satisfy the Fisher relation. This enables us to test both the consistency of the forecasts with the economic theory used in extracting the implied inflation yield curve and to eliminate one of the yield curves and derive it by only modelling the other two yield curves. To decide which one to eliminate we check for which yield curve the Fisher relation holds better. Figure 11 shows the fitted spot rates (black solid lines), forecasts (red solid lines) and the forecasts obtained using Fisher relation (blue solid line) for different maturities for the nominal spot rates only. The graphs for the implied inflation and the real yield curves can be seen in Sahin (Reference Sahin2010).
Fisher Relation Check for the 1-Month Ahead Nominal Spot Rate Forecasts (%)
We see that the fitted values and the forecasts derived by using the Fisher relation show significant differences in particular for very short and very long maturities for the three yield curves. However, the nominal yield curve forecasts seem better than the other two considering the two ends of the term structures. Since there is a significant decrease in the spot rates over the period examined (1985-2012) we have to draw the graphs on a large scale in order to display the whole period. Therefore, the overlapping solid lines in Figure 11 do not tell much. Taking this drawback into account, we calculate and present the errors between the fitted yield curves and the one-month ahead forecasts and the fitted yield curves and the forecasts derived by the Fisher relation for the nominal term structure in Figure 12.
Errors for the Fisher Relation Check for the 1-Month Ahead Nominal Spot Rate Forecasts (%)
According to Figure 12, the differences between the fitted nominal spot rates and forecasts (both obtained by modelling the nominal PCs and the ones derived from the Fisher relation) decrease as the maturity increases. This might be explained by the higher volatility in the short rates due to being used as a monetary policy instrument. Since the changes in the economy are reflected into the short term interest rates first the short rates are more volatile than the long rates. This feature of the short rates make it relatively difficult to obtain a good fit in terms of modelling. Regardless of maturity, Figure 12 indicates that the forecasts obtained by modelling the nominal rates produce closer values than the forecasts obtained by modelling the real and implied inflation rates to derive the nominal spot rates.
7 Conclusions
In this paper we have specified and estimated a benchmark yield curve model for the UK. First, we fill in the gaps in the three UK term structures (nominal, real and implied inflation spot rates) by fitting the Cairns model with appropriate fixed exponential parameter sets. Although the Bank of England publishes the yield curve data, there are many missing values due to the reasons discussed in Section 1. In order to use all available maturities in yield curve modelling, we needed to replace these missing values by fitting a descriptive yield curve model. We have tried four different fixed parameter sets to apply the Cairns model and decide the ones which fit the yield curves best. One set of these parameters for each yield curve has been obtained by the least squares method with a penalty function discussed in Section 3. The other three parameter sets have been proposed by Cairns (Reference Cairns1998) and Cairns and Pritchard (Reference Cairns and Pritchard2001). We have compared these different parameter sets by examining the root mean squared errors and concluded that the parameter sets obtained from the least squares method provide the best fit for all three yield curves.
Afterwards we have constructed the ‘yield-only’ model using the monthly UK term structures. First we apply the PCA on the three term structures and obtain three most important components to derive the yield curves. Then we examine the relation within and between these components by analysing the auto- and cross-correlation functions. Once we try to fit vector autoregressive models to each component we see that the AR(1) model fits each variable quite well. Although the auto-correlation coefficients in the models are very high and close to 1 we find it economically reasonable to fit AR processes rather than some random walk models to the interest rates. To test our models we examine the residuals which we obtain by using the estimated parameters for each PC. The zero mean and high kurtosis of the residuals show that a distribution which is symmetric like the normal distribution but has a higher kurtosis, such as a logistic distribution, fits the residuals well. We have also found some evidence of an ARCH effect particularly in the level and slope factors of the implied inflation and the real spot rates. As a next step to test our models we have calculated the one-month ahead forecasts with the 95% confidence limits. Our analysis shows that the fitted spot rates are well within the confidence limits for all three yield curves which indicate a good forecast. As a final analysis, we check whether our forecasts satisfy the Fisher relation which might enable us to derive one of the yield curves by using the other two. We have discovered that not for all maturities but for specific ones the Fisher relation can be used to forecast the spot rates.