Implications
When marketing beef cattle, premiums may be paid if the meat is consistently well-marbled. It can therefore be beneficial to develop management strategies for feedlot cattle that will result in improved marbling. A DNA variant in the alcohol dehydrogenase 1 C (ADH1C) gene was previously shown to improve fat traits when vitamin A (VA) was limited in the diet of steers that did not receive growth enhancing hormonal implants. In this study, half of the 2000 steers were administered hormonal implants, and fed either 50% or 100% of the recommended amount of VA. There was an effect between hormonal implant status and genotype on average daily gain (ADG), however, the expected ADH1C and VA association with marbling was not observed. Insufficient restriction of VA or time on the diet may be the cause. Decreasing VA to 25% of recommended did not affect blood cell counts or proliferative responses, and 50% in the feedlot finishing diets did not affect illness or mortality. Implants had a strong effect on production and carcass traits, however, the proposed management strategy utilizing a DNA variant in the ADH1C gene and limiting VA in finishing rations is not ready for commercial application.
Introduction
Marbling within high-end cuts of meat is of value to both the beef industry and consumers. Beef producers and/or feedlots target this trait in breeding and feeding programs because premiums can be paid for well-marbled carcasses if utilizing a marketing grid (DiCostanzo and Dahlen, Reference DiCostanzo and Dahlen2000). Consumers value marbling because they consider it to be a deciding factor in their purchasing decisions, as juiciness and flavor add to the overall enjoyable eating experience (Wheeler et al., Reference Wheeler, Cundiff and Koch1994). A willingness to pay extra for quality beef has also been shown (Killinger et al., Reference Killinger, Calkins, Umbergert, Feuz and Eskridge2004).
The widespread use of hormonal implants in North America, however, has resulted in greater lean tissue deposition at the expense of carcass fat deposition including carcass marbling scores (MARBs) (Wileman et al., Reference Wileman, Thomson, Reinhardt and Renter2009). While use of these products lead to superior gains and more efficient production, there has been a trend by North American cattle feeders to take cattle to heavier slaughter and carcass weights in order to compensate for the potential for reduced quality grades at slaughter in implanted (IMP) cattle (Platter et al., Reference Platter, Tatum, Belk, Scanga and Smith2003). This shift has an economic benefit if cattle are marketed on a live weight basis, however, taking cattle to heavier carcass weights in order to ensure proper marbling levels will also increase overall carcass fatness and lead to higher yield grades, a situation which is undesirable from a consumer’s perspective. In addition, VA is often supplemented above the National Research Council (NRC) (1996) recommendation of 2200 IU/kg dry matter (DM) in North American feedlots. High levels of VA have the potential to impede fat deposition (Kawada et al., Reference Kawada, Kamei and Sugimoto1996; Ohyama et al., Reference Ohyama, Matsuda, Torii, Matsui, Yano, Kawada and Ishihara1998; Kawada et al., Reference Kawada, Kamei, Fujita, Hida, Takanashi, Sugimoto and Fushiki2000; Ziouzenkova et al., Reference Ziouzenkova, Orasanu, Sharlach, Akiyama, Berger, Viereck, Hamilton, Tang, Dolnikowski, Vogel, Duester and Plutzky2007), a situation which is also potentially undesirable from a consumer’s perspective (Killinger et al., Reference Killinger, Calkins, Umbergert, Feuz and Eskridge2004; Platter et al., Reference Platter, Tatum, Belk, Koontz, Chapman and Smith2005). Due to these differences between commercial production practices and consumer demand, there has been an increase in research that focuses on improving beef quality by decreasing dietary VA, with mixed results.
In prior studies, limiting dietary VA led to: significantly increased intramuscular fat (IMF), a negative correlation between serum retinol and MARBs and numerically increased MARBs (Kruk et al., Reference Kruk, Bottema, Davis, Sievert, Harper, Di and Pitchford2008); and increased quality grades and a trend towards increased IMF (Pickworth et al., Reference Pickworth, Loerch and Fluharty2012a), in Angus and Angus crossbred steers, respectively. Research in Wagyu cattle has also shown an increase in marbling with decreased VA intake (Oka et al., Reference Oka, Maruo, Miki, Yamasaki and Saito1998). However, several studies have found evidence to refute these associations. Bryant et al. (Reference Bryant, Wagner, Tatum, Galyean, Anthony and Engle2010) found no difference in MARB, hot carcass weight, longissimus thoracis muscle area and 12th-rib fat thickness (FAT) among all VA supplementation treatment levels (0, 1103, 2205, 4410 and 8820 IU/kg DM) for a group of yearling black feedlot steers. Gorocica-Buenfil et al. (Reference Gorocica-Buenfil, Fluharty and Loerch2008) also found no effect of VA restriction in Angus-based steers on ADG, dry matter intake (DMI), gain to feed ratio, hot carcass weight, FAT, USDA yield grade (YIELD), MARB and IMF measures. Animals that received no supplemental VA had reduced serum (P<0.01) and liver (P<0.01) retinol levels when compared to animals supplemented with the NRC (1996) recommendation, suggesting that the restriction was able to reduce stored and circulating VA within the body (Gorocica-Buenfil et al., Reference Gorocica-Buenfil, Fluharty and Loerch2008). These mixed results are typical in the VA restriction literature and could, in part, be due to the timing and duration of restriction.
Marker-assisted management is the change in management strategies based on genotype to improve upon a specific trait. The limitation of VA in the diets of animals with the TT genotype at the ADH1Cc.-64T>C single nucleotide polymorphism (SNP), to improve beef quality (Ward et al., Reference Ward, McKinnon, Hendrick and Buchanan2012) is an example of marker-assisted management. Steers could be targeted for increased marbling if they were TT, taking advantage of premiums, whereas steers that were CT and CC could be sold based on their weight. By taking advantage of the role of VA and its retinoids in the process of adipogenesis (Heyman et al., Reference Heyman, Mangelsdorf, Dyck, Stein, Eichele, Evans and Thaller1992; Gregoire et al., Reference Gregoire, Smas and Sul1998; Ziouzenkova et al., Reference Ziouzenkova, Orasanu, Sharlach, Akiyama, Berger, Viereck, Hamilton, Tang, Dolnikowski, Vogel, Duester and Plutzky2007), this marker-assisted management strategy could improve profits for feedlots and/or producers. Ward et al. (Reference Ward, McKinnon, Hendrick and Buchanan2012) found that the ADH1Cc.-64T>C SNP removed a transcription factor binding site, decreasing both expression of the ADH1C gene, and the level of IMF in animals with the C allele, when dietary VA was reduced. This improvement in fat traits could increase profits, however, careful avoidance of VA deficiency is crucial.
Immune function is decreased during VA deficiency. Disease also reduces VA uptake and absorption while increasing its excretion (Stephensen, Reference Stephensen2001). These factors create a cyclic relationship that could negatively affect the growth and welfare of feedlot cattle. Clinical signs ranging from decreased ADG to death can all result from VA deficiency (Smith et al., Reference Smith, Levy and Hayes1987; Wolbach and Howe, Reference Wolbach and Howe1925; NRC, 1996). Vitamin A and its retinoids play important roles in vision, reproduction and immune function, in addition to their roles in adipogenesis. Specifically, failures of immune function due to VA deficiency could be catastrophic in a feedlot setting, given that animals enter the feedlot with varying levels of stored VA, and may face several periods of stress and disease challenge throughout the feeding period.
Animal welfare, profitability and consumer eating experience are all concerns for animal producers, and while consistent high MARBs could be beneficial, increased disease and mortality could substantially reduce feedlot profits. The aim of this study, therefore was to feed both the recommended (100% of NRC recommendations) and intermediate (50%) level of VA in finishing rations to TT and CT animals at the ADH1Cc.-64T>C SNP to determine if marbling could be improved in a commercial feedlot setting, while also determining any negative immunological effects that could arise from the ADH1C×VA marker-assisted management strategy in two different feedlot populations. The effect of hormonal implants on the ADH1C×VA marker-assisted management strategy was also investigated. We hypothesized that TT, 50% VA diet animals would have greater MARBs, and that animals with 25% of the NRC (1996) recommendation of VA supplementation would not show diagnosable decreased immune function or symptoms of VA deficiency.
Material and methods
All animals were cared for according to the Guide to the Care and Use of Experimental Animals (Canadian Council on Animal Care, 1993) guidelines. All experimental work involving animals was approved by the University of Saskatchewan Animal Research Ethics Board.
Animals
Two populations of beef cattle were used in this experiment, the first for carcass and health data, and the second solely for immune function analyses. Beef steers (mixed breed, N=2960) were purchased at auction (averaging 274 kg), transported to Cattleland Feedyards Limited (Strathmore, AB, Canada) and were given Pyramid 5+ Presponse SQ (Boehringer Ingelheim Vetmedica Inc., Duluth, GA, USA), Vision 7 somnus (Merck Animal Health Canada, Kirkland, QC, Canada), Vetomectin pour-on (Vétoquinol, Lavaltrie, QC, Canada) and Zuprevo (Merck Animal Health Canada, Kirkland, QC, Canada).
Upon arrival at Cattleland Feedyards Limited, steers were fed a receiving diet that consisted of 48% barley silage, 44% barley grain, 8% supplement (DM basis). The diets were increased in a step-wise fashion to a holding ration that consisted of 21% barley silage, 73% barley grain and 6.6% supplement using a four-step program. Ration changes occurred every 5 to 7 days. The animals were held for a maximum of 60 days on the holding diet while enough animals were accrued for genotyping.
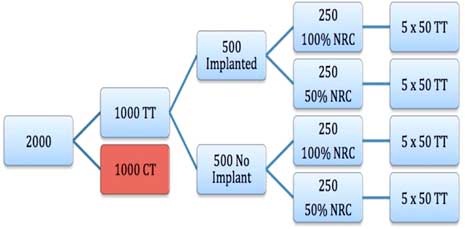
The ear tissue tagging system and DNA extraction method at Quantum Genetix (Saskatoon, SK, Canada) was used to obtain DNA from each animal as described in Kononoff et al. (Reference Kononoff, Defoor, Engler, Swingle, James and Marquess2014). Genotypes were determined in 2960 steers using a PCR-Restriction Fragment Length Polymorphism test for the ADH1C SNP (Ward et al., Reference Ward, McKinnon, Hendrick and Buchanan2012; Krone et al., Reference Krone, Ward, Madder, Hendrick, McKinnon and Buchanan2016). A cohort of 2000 steers were randomly selected and sorted into pens of 50 animals each, based on genotype (either TT or CT; Figure 1). Component TE100 (100 mg trenbolone acetate and 10 mg of estradiol; Elanco, Guelph, ON, Canada) implants were used in half of the pens at sorting, and again at 70 days. Bovi-Shield IBR-PI3 (Zoetis, Parsippany, NJ, USA) was also administered at day 70. Pens were further divided as either receiving 50% or 100% of NRC VA requirement, therefore there were five pens each of: CT genotype, IMP, 50% VA; CT, IMP, 100%; CT, non-implanted (NI), 50%; CT, NI, 100%; TT, IMP, 50%; TT, IMP, 100%; TT, NI, 50%; and TT, NI, 100%. Pen was the statistical unit, as VA supplement was mixed in with the daily ration.
The strategy by which beef steers were sorted into different treatment pens based on ADH1Cc.-64T>C genotype (TT or CT), implant status and vitamin A treatment (percentage of National Research Council (NRC) (1996) recommendations) for the carcass population. The red cell depicts the group of animals that would follow the same pattern as shown for the TT animals, but would have the CT genotype.

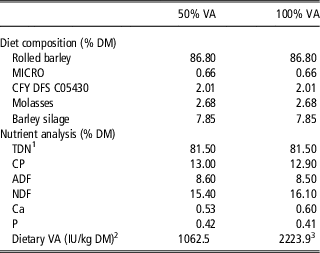
The 2000 steers averaged 340 kg and were moved on to the final finishing diet which consisted of 7.8% barley silage, 86.1% barley grain and 6.1% supplement (DM basis; Table 1). Diets were formulated to meet the nutrient needs of growing and finishing cattle according to the NRC (2000). Steers were provided feed for ad libitum intake once daily. As per the feeding protocol at the participating commercial feedlot, all pens were supplemented at 30 000 IU VA/head per day before sorting. Barley silage fed to the cattle averaged 13 472±1580 IU VA/kg DM over the course of the trial. Based on an average DM intake of 8 kg/head per day and a silage inclusion level of 0.78%, all pens received 8500 IU VA/head per day from the basal ration. Pens assigned the 100% NRC diet received an additional 9290 IU/head of VA supplement mixed in the feed, which equaled the 2200 IU/kg DM recommended by NRC (1996). Since the VA in the basal diet equaled 1062.5 IU VA/kg DM (Table 1), the pens assigned the 50% NRC diet did not receive further VA supplementation. Analysis of β-carotene in representative silage samples was completed by DSM Nutritional Products Inc. (Ayr, ON, Canada), using AOAC official method 974.29 and the DSM Nutritional Products Green Book (2004) as in Gibb et al. (Reference Gibb, Van Herk, Mir, Loerch and McAllister2011). The conversion factor of 400 (NRC, 1970) was used for β-carotene conversions, and VA supplement was adjusted accordingly. For health data, numbers of animals that were removed from their pens for treatment, pulled from the study due to being treated on three occasions, sent to slaughter early as poor-doers, or died prior to slaughter were totaled for each pen. This totaled number was then normalized to a pen of 50 head with the following calculation: (number of sick or dead animals/total number of animals in the pen)×50.
Diet composition and nutrient analysis of 50% and 100% of National Research Council (NRC, 1996) recommended vitamin A (VA) beef steer finishing rations on a dry matter (DM) basis

MICRO=Micro-Cell LA (Lallemand Animal Nutrition, Montreal, QC); CFY DFS C05430=base mineral supplement formulation of macro and trace minerals excluding VA, unique to Cattleland Feedyards Limited (Strathmore, AB); TDN=total digestible nutrients.
1 TDN (%) = tdCP + (tdFA×2.25)+tdNDF−7, where tdCP=total digestible CP; tdFA=total digestible fatty acid; tdNDF=total digestible NDF.
2 Calculated as 400 IU/mg β-carotene (NRC, 1970).
3 VA was supplemented in the 100% Vitamin A diet at 9290 IU/head per day. This level of supplementation was designed to achieve a total daily VA intake of 18 000 IU or 2200 IU/kg DM intake when combined with VA intake from barley silage.
The immune function analysis population (N=18) included three animals of each ADH1C genotype (TT, CT and CC) and VA level (25% and 75% NRC), randomly selected, from a trial that occurred between fall 2012 and summer 2013 (Krone et al., Reference Krone, Ward, Madder, Hendrick, McKinnon and Buchanan2016) at the University of Saskatchewan’s Beef Cattle Research Facility. Upon arrival at the facility, 450 black Angus crossbred steers were administered: Ivomec (Merial Canada, Baie-D’Urfe, QC, Canada), Ultrabac 7/Somubac (Zoetis), Bovi-Shield Gold 5 (Zoetis), One Shot (Zoetis) and Liquamycin LA-200 (Zoetis). Initially, these 450 steers were genotyped at the ADH1C SNP using DNA extracted from tail hair samples, followed by a PCR-Restriction Fragment Length Polymorphism (Krone et al., Reference Krone, Ward, Madder, Hendrick, McKinnon and Buchanan2016). A study population was randomly selected from these animals to consist of 45, 45 and 27 animals of TT, CT and CC genotypes, respectively, and pens were made up of evenly distributed numbers of each combination of variables. Study animals were fed either 25%, 50% or 75% of NRC (1996) recommendations for VA. These VA levels were achieved by administration of a monthly oral gelatin bolus (Torpac Inc., Fairfield, NJ, USA) filled with sugar and the appropriate monthly dose of VA in the form of retinyl palmitate (1×10⁶ IU/g; Adisseo, Antony, France). Daily feed rations were unsupplemented for VA, and the naturally occurring level of VA was used to calculate the appropriate inclusion level of VA in the monthly boluses (Krone et al., Reference Krone, Ward, Madder, Hendrick, McKinnon and Buchanan2016).
Production and carcass data
Weights were collected at the time of sorting, re-implantation and at shipping. Average daily gain (kg per day) was calculated as the difference in weights divided by the number of days between measurements. Dry matter intake data were provided by Cattleland Feedyards Limited. Total days-on-feed was the number of days from sorting date until slaughter. The target slaughter weight per pen for all treatments was 612 kg. When cattle reached this target, they were shipped to JBS Foods (Brooks, AB, Canada). The carcass data obtained at slaughter was: YIELD (scale from 1.0 to 5.9), MARB (scale from 200 to 900), longissimus thoracis muscle area (cm2) and FAT (mm). A VBG 2000 (e+v Technology GmbH & Co. KG, Oranienburg, Germany) vision camera grading system was used to obtain the YIELD, MARB, REA and FAT data.
Blood cell counts and peripheral blood mononuclear cell isolation
Blood samples (24 ml) were drawn from the subset of 18 immune study animals, from two pens (pens 9 and 10), from the jugular vein into vacutainers containing ethylenediaminetetraacetic acid (EDTA). These samples were taken two weeks before slaughter, and 6 ml of the blood drawn from each animal was sent to Prairie Diagnostic Services (Saskatoon, SK, Canada) for complete blood cell count analysis with the use of an Advia 120 Hematology system (Siemens Healthcare Limited, Oakville, ON, Canada). Complete blood cell count analysis can demonstrate the presence of infection and inflammatory disease (Jones and Allison, Reference Jones and Allison2007). The remaining 18 ml of the blood sample from each animal was used for peripheral blood mononuclear cell (PBMC) purification. Samples were separated by centrifugation at 1350 g for 20 min at room temperature; buffy coats were then removed and suspended in 8 ml of phosophate-buffered saline (PBS) containing 2.7 mM EDTA. Solutions were transferred to Ficoll gradients (at a density of 1.077 g/l under PBS; GE Healthcare, Uppsala, Sweden) and centrifuged at 1940×g for 20 min at room temperature. Peripheral blood mononuclear cells were removed from the interface between Ficoll and PBS/EDTA, suspended in 8 ml of the PBS/EDTA solution and centrifuged at 311×g for 10 min at 4°C. Supernatant was removed, cells were resuspended in 10 ml PBS/EDTA solution, and the centrifugation at 311×g and resuspension steps were repeated once more. The suspension was centrifuged one last time at 1000 rpm for 10 min at 4°C, and supernatant was removed. The PBMCs were resuspended in 4 ml Minimum Essential Media (Invitrogen Canada Inc., Burlington, ON, Canada) which contained 10% fetal bovine serum, 50 μM 2-mercaptoethanol, 1% sodium pyruvate, 1% non-essential amino acids and 1% 4-(2-hydroxyethyl)-1-piperazineethanesulfonic acid with 50 μg/ml gentamycin added. A Coulter counter was used to determine cell counts.
Peripheral blood mononuclear cell stimulation and proliferation assay
A concentration of 3.5×10⁶ cells/ml PBMC suspension was achieved by resuspending purified PBMCs in the Minimum Essential Media with 50 μg/ml gentamycin added. A 100 μl volume of this suspension was added in duplicate to the wells of a 96-well tissue culture plate (Corning Inc., Corning, NY, USA). Cells were incubated at 37°C in 5% CO2 for 72 h where one sample from each duplicate pair was incubated in the presence of 1 μg/ml concanavalin A (Sigma-Aldrich, Oakville, ON, Canada). In total, 20 μl of a 0.4 μCi/ml solution of tritiated thymidine (American Radiolabeled Chemicals, St. Louis, MO, USA) was added to each well and plates were then incubated for an additional 18 h. The incorporation of tritiated thymidine into cultured PBMC cells was determined using a liquid scintillation counter (TopCount NXT; Perkin Elmer Inc., Waltham, MA, USA). A stimulation index was calculated by dividing stimulated cell counts by those from unstimulated controls (Lijnen et al., Reference Lijnen, Saavedra and Petrov1997).
Statistical analysis
The mixed model procedure of SAS 9.4 (SAS Version 9.4; SAS Institute Inc., Cary, NC, USA) was used to analyze carcass data as a completely randomized block with a two (TT or CT genotype) by two (50% or 100% NRC recommended VA) by two (IMP or NI) factorial arrangement of treatments. The health data statistics were performed by individually comparing ADH1C genotype (TT or CT), implant status (IMP or NI) and VA treatment (High or Low) against the normalized number of sick or dead animals in each pen. Pen was the experimental unit for this population. Standard errors were adjusted using a Kenward Roger adjustment and means were separated using Tukey’s LSD. Significance was set at P⩽0.05 and trends at 0.05>P⩽0.10.
All immune function marker statistical analyses were performed using IBM SPSS Statistics Package version 23 (SPSS, Chicago, IL, USA). Histograms and data screening were performed using the Explore feature, and data were notably skewed. Group comparisons for VA level (25% v. 75%) and PEN (pen 9 v. 10) were presented graphically as box plots, and differences between groups were tested with the non-parametric Mann–Whitney U test. Group comparisons for ADH1C genotype (TT v. CT v. CC) were presented graphically as box plots, and their differences were tested with the non-parametric Kruskal–Wallis test. Results were considered statistically significant at P⩽0.05 and trends at 0.05>P⩽0.10.
Results
Genotyping at the ADH1Cc.-64T>C SNP determined that the minor allele (C) frequency in the carcass population was 0.26, compared with 0.3 in the Ward et al. (Reference Ward, McKinnon, Hendrick and Buchanan2012) study. An insufficient number of CT animals was obtained therefore, 30 CC animals were used to fill the CT pens. Two prior studies indicated that these two genotypes do not differ significantly with respect to carcass or production data (Ward et al., Reference Ward, McKinnon, Hendrick and Buchanan2012; Krone et al., Reference Krone, Ward, Madder, Hendrick, McKinnon and Buchanan2016). The following number of animals finished the trial: 978 TT and 974 CT/CC.
Production and carcass data
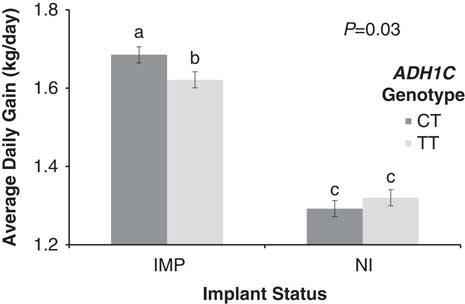
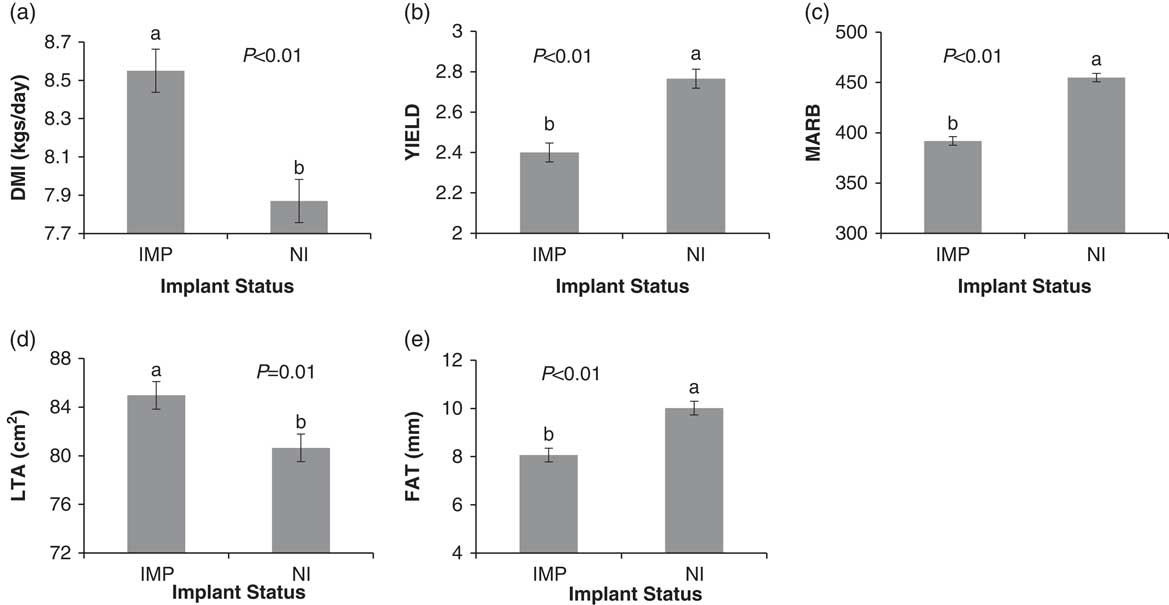
Implanted, CT steers had higher ADG (1.69±0.02 kg/day) over TT (1.62±0.02 kg/day; P=0.03; Figure 2), and both were higher than NI animals (CT=1.29 and TT=1.32±0.02 kg/day). Implant status had an effect on DMI (IMP=8.55 and NI=7.87±0.113 kg; P<0.01) and total days-on-feed (IMP=164.4 and NI 210.5±2.78 days; P<0.01), which equated to IMP steers having an 8.69% increase in DMI (Figure 3a) and requiring 46 fewer days-on-feed compared with NI animals. Implanted animals had a 15.23% decrease in YIELD scores (IMP=2.40 and NI=2.77±0.046; P<0.01; Figure 3b), where a lower score is preferable, and a 5.37% increase in longissimus thoracis muscle area (IMP=85.0 and NI=80.7±1.135 cm2; P=0.01; Figure 3d). Conversely, NI steers had higher values for fat traits. When compared with IMP steers, NI animals displayed a 16.08% increase for MARB scores (IMP=392 and NI=455±4.193; P<0.01; Figure 3c) and a 24.15% increase for FAT (IMP=8.0 and NI 10.0±0.28 mm P<0.01; Figure 3e). The expected ADH1C×VA interaction effect was not observed.
Average daily gain values of beef steers that were implanted (IMP) or non-implanted (NI) and CT or TT genotype at the ADH1Cc.-64T>C variant in the carcass population. Each column symbolizes the mean of 10 pens. Columns with differing letters are significantly different (P<0.05).

Main effects of implant status (implanted (IMP) and non-implanted (NI)) on beef steers (a) dry matter intake (DMI), (b) camera graded yield grade (YIELD), (c) camera graded marbling score (MARB), (d) longissimus thoracis area (LTA) and (e) average fat measurement (FAT) in the carcass population. Each column symbolizes the mean of 20 pens. Columns with differing letters are significantly different (P<0.05).

Health data
Normalized values for the number of treated and dead animals per pen before slaughter in the carcass population were not influenced by treatment. The average number of treated/dead animals per pen for CT pens was 0.8258 and for TT pens it was 0.8041 with an SEM of 0.2861 (P=0.95). Pens with IMP animals averaged 0.9758 treated/dead animals per pen and NI pens averaged 0.6541 with an SEM of 0.2799 (P=0.36). High VA pens had an average of 1.0258 treated/dead animals, and Low VA pens had 0.6041 with an SEM of 0.2754 (P=0.28).
Blood cell counts and peripheral blood mononuclear cell stimulation
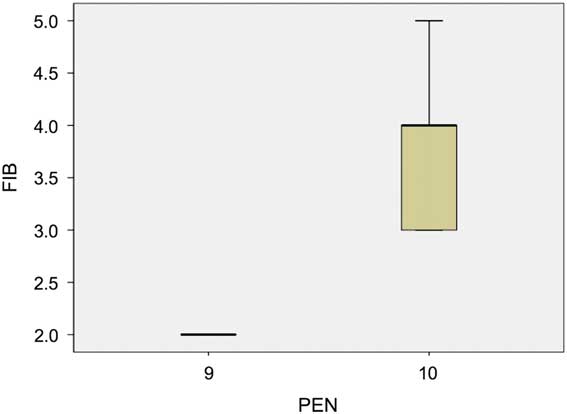
Cell counts for white blood cells (WBCs), segmented cells, band neutrophils, red blood cells, total protein and fibrinogen (FIB) were obtained from the immune analysis animals. The band neutrophils counts have been excluded from further discussion as only two animals (both from Pen #10 with 25% VA, one being CC and the other being TT) had concentrations that were not zero and there were no statistically significant differences. The WBC reference interval reported (provided by Prairie Diagnostic Services) at the time of testing was 4.51 to 12.1 (×109 cells/l), and only one test animal fell out of that range at 13.4 (Pen #10, TT, 25% VA). There was statistical significance of FIB with a PEN effect (Table 2; Figure 4) with measured FIB concentrations ranging from 1 to 5 g/l. No effects were observed for WBC, segmented cells, band neutrophils, red blood cells and stimulation index values (Table 2).
Box plot graph representing the significant main effect of beef cattle pen allocation on fibrinogen (FIB) count in the immune function assay population.

P-values of the effects of ADH1Cc.-64T>C genotype (ADH1C), pen allocation (PEN) and vitamin A (VA) treatment on markers of immune function in the beef cattle immune analysis population

Discussion
Finishing beef animals sooner would benefit feedlots and producers. This change could be accomplished through increases in ADG and decreases in the length of the feeding period. This benefit comes from the management costs, and the economic and animal welfare risks of stress and disease challenge when keeping animals in the feedlot for longer than necessary. The effects observed between IMP and NI animals were expected, as the use of implants increases lean meat yield and decreases the feeding period. An unexpected finding however, was the difference in ADG between CT and TT genotypes within IMP animals. This finding has not been previously reported, however, only NI steers were used in prior nutrigenetic work on the ADH1Cc.-64T>C SNP and VA interaction (Ward et al., Reference Ward, McKinnon, Hendrick and Buchanan2012; Krone et al., Reference Krone, Ward, Madder, Hendrick, McKinnon and Buchanan2016). The leaner of the two genotypes has previously consistently been the CT animals (Ward et al., Reference Ward, McKinnon, Hendrick and Buchanan2012; Krone et al., Reference Krone, Ward, Madder, Hendrick, McKinnon and Buchanan2016), and therefore these animals would also have higher ADG when IMP. This is an area where more research is necessary to confirm or refute this interaction.
Market factors change, although typically USDA yield scores greater than four are discounted, where larger longissimus thoracis muscle area contributes to lower yield scores which are preferable. Our results support the well-known effects of implants in beef cattle, where it is typical of IMP animals to have an increased lean yield. Animals that receive implants can therefore be targeted towards a lean meat yield market. The benefits of using implants come at a cost, however, as yield score is positively correlated with FAT (Kauffman et al., Reference Kauffman, Van Ess, Long and Schaefer1975), where fat traits are diminished as yield traits improve. Depending on marketing situations, carcasses consistently high in marbling, that is, have higher-quality grades, also receive premiums, as do carcasses with the lowest YIELD scores (DiCostanzo and Dahlen, Reference DiCostanzo and Dahlen2000), which contain the highest lean meat content. Consequently, there is a decision to be made as to how cattle will be marketed. When marketing on a grid that pays premiums for marbling, much higher profits can be achieved through carcasses consistently having higher levels of IMF (Feuz, Reference Feuz1999). Flavor and eating experience are enhanced by marbling (Killinger et al., Reference Killinger, Calkins, Umbergert, Feuz and Eskridge2004), which is appreciated by consumers. Marketing beef comes with its challenges, however, because marbling and backfat are positively correlated and by selecting too strongly for marbling, overall carcass fat can become undesirable (Savell et al., Reference Savell, Cross, Francis, Wise, Hale, Wilkes and Smith1989). Too much backfat leads to increased yield grades and discounted prices. Our results show that the significant difference observed between IMP and NI animals for MARB score would change the quality grade from slight (Canada AA/USDA Select) to small (Canada AAA/USDA Choice), respectively. This improvement would lead to increased prices for the NI steers when marketing is based on marbling, however, the increase in price needs to be justifiable when compared with the longer total days-on-feed (46 more days).
The current trial showed no ADH1C × VA treatment interaction effect on fat traits, unlike our previous studies (Ward et al., Reference Ward, McKinnon, Hendrick and Buchanan2012; Krone et al., Reference Krone, Ward, Madder, Hendrick, McKinnon and Buchanan2016). Nor did we observe effects of ADH1C genotype or VA level on any carcass trait. The lack of an ADH1C effect was expected as it was also not observed by either Ward et al. (Reference Ward, McKinnon, Hendrick and Buchanan2012) or Krone et al. (Reference Krone, Ward, Madder, Hendrick, McKinnon and Buchanan2016). Multiple prior studies have shown an effect of dietary VA level on marbling (Oka et al., Reference Oka, Maruo, Miki, Yamasaki and Saito1998; Kruk et al., Reference Kruk, Bottema, Davis, Sievert, Harper, Di and Pitchford2008; Pickworth et al., Reference Pickworth, Loerch and Fluharty2012b), therefore we hypothesize that the low level of VA was either not low enough or was not sustained for a long enough period of time to show an effect on carcass traits. Other studies, where reduced dietary VA was fed for shorter periods (Gorocica-Buenfil et al., Reference Gorocica-Buenfil, Fluharty and Loerch2008; Bryant et al., Reference Bryant, Wagner, Tatum, Galyean, Anthony and Engle2010), have also resulted in no VA effect on carcass traits. However, Kruk et al. (Reference Kruk, Bottema, Davis, Sievert, Harper, Di and Pitchford2008) found that 10 months of feeding unsupplemented VA rations to Angus steers led to increases in fat traits. In addition, they suggested that an even longer period of VA reduction likely would have resulted in a more pronounced effect on MARBs (Kruk et al., Reference Kruk, Bottema, Davis, Sievert, Harper, Di and Pitchford2008). The differences in fat traits (IMF and marbling) achieved by Ward et al. (Reference Ward, McKinnon, Hendrick and Buchanan2012) came as a result of feeding an unsupplemented ration for only 5 months, however, the backgrounding ration, which was fed for 3 months before this, was completely deficient in VA in order to deplete liver VA stores. This is not a practical approach for the beef industry. Therefore, Krone et al. (Reference Krone, Ward, Madder, Hendrick, McKinnon and Buchanan2016) fed a backgrounding diet with 1.7 times the recommended level of VA before finishing the steers on three reduced levels of supplemental VA. The ADH1C × VA interaction was observed with IMF in one treatment, where again the TT genotype had significantly higher levels than CT or CC (Krone et al., Reference Krone, Ward, Madder, Hendrick, McKinnon and Buchanan2016). In comparison, the current study held steers for 2 months on VA 1.9 times the recommended level. These extended periods of time on excess VA may explain why Krone et al. (Reference Krone, Ward, Madder, Hendrick, McKinnon and Buchanan2016) only observed the expected observation at the highest level of VA while we did not observe it at all. Also of consideration in the current study was that IMP steers were on the low or high VA treatments for approximately 5.5 months, whereas NI steers were fed their respective treatments diets for 7 months. The hepatic liver VA stores of steers on the 50% NRC recommended level may not have been reduced enough to observe the expected improvements in fat traits.
In addition to the length of time VA was reduced in the diet, the delivery method and dosage may have been factors affecting the lack of effects in this trial. Monthly doses of VA via an oral bolus were used in both the Ward et al. (Reference Ward, McKinnon, Hendrick and Buchanan2012) and Krone et al. (Reference Krone, Ward, Madder, Hendrick, McKinnon and Buchanan2016) studies, which differed from the daily VA supplementation mixed into the ration for this trial. The exact amount of VA received by each animal therefore was not known and the pen was analyzed as the experimental unit, as opposed to the individual being the unit in Ward et al. (Reference Ward, McKinnon, Hendrick and Buchanan2012) and Krone et al. (Reference Krone, Ward, Madder, Hendrick, McKinnon and Buchanan2016). The absorption of the daily dose of VA from the feed as opposed to a monthly oral bolus may also have altered the effect of limiting the animal’s dietary VA. Breed or coat color may be additional relevant factors as the previous two studies used commercial black Angus steers or crosses (Ward et al., Reference Ward, McKinnon, Hendrick and Buchanan2012; Krone et al., Reference Krone, Ward, Madder, Hendrick, McKinnon and Buchanan2016), while in this study any breed or color was utilized. Recently, Knutson et al. (Reference Knutson, Sun, Fontoura, Gaspers, Liu, Carlin, Bauer, Swanson and Ward2017) found black Angus crossbred steers fed a low VA diet had 16% greater marbling than those on the recommended level or Simmental fed either amount. It is possible that the coat color of the steers may play a role as McLean and Schmutz (Reference McLean and Schmutz2009) have shown carcass differences based on melancortin 1 receptor genotypes.
Feeding VA at half of NRC (1996) recommendations or below was a concern due to possible effects on immune function, which could lead to the potential ADH1C × VA marker-assisted management strategy being detrimental to animal welfare. In previous studies, however, calves fed 3300 IU VA/kg DM or 1100 IU VA/kg DM showed no difference in responses to vaccinations (Jee et al., Reference Jee, Hoet, Azevedo, Vlasova, Loerch, Pickworth, Hanson and Saif2013). Another study showed no difference in responses to vaccinations when supplemented at 0 IU VA/kg DM v. the NRC recommended 2200 IU VA/kg DM per day (Gorocica-Buenfil et al., Reference Gorocica-Buenfil, Fluharty and Loerch2008). A very severe level of VA limitation, and for an extended period of time, is therefore likely necessary to induce deficiency where clinical deficits in immune responses are occurring. Our results showed no evidence of detrimental immune effects or increased disease incidence in animals fed low VA levels for approximately 5 months (Krone et al., Reference Krone, Ward, Madder, Hendrick, McKinnon and Buchanan2016), 5.5 months (IMP pens of carcass and health data population) and 7 months (NI pens of carcass and health data population). As reference intervals constitute the 95% confidence range for animals that are examined as ‘normal’ (i.e. not ill), the PEN effect on the WBC results (Table 2) may be a statistical trend, but only one animal had a WBC count above the reference interval for clinically normal animals. The statistical significance of FIB with a PEN effect (Table 2; Figure 4) is also not of great concern, as the reference interval (provided by Prairie Diagnostic Services) is 1 to 7 g/l and our values ranged from 1 to 5 g/l, and therefore all animals fell within the normal reference interval. Due to these factors, we believe that the effect of PEN on FIB or trend effect of PEN on WBC were not clinically significant.
An increase in WBC, segmented cells, band neutrophils, total protein and FIB counts would all be expected during a period of infection or inflammation, while malnutrition may cause the red blood cells count to decrease (Jones and Allison, Reference Jones and Allison2007). During VA deficiency, it is common for the number of natural killer cells to decrease (Semba, Reference Semba1998; Stephensen, Reference Stephensen2001). While FIB values were found to be higher in Pen 10, they still fell within the given reference interval, which would suggest a normal finding, not an indication of sickness.
Peripheral blood mononuclear cells include all WBC types. During VA deficiency, there is a reduction of neutrophil, macrophage and natural killer cell function (Semba, Reference Semba1998; Stephensen, Reference Stephensen2001). As the stimulation index is calculated by dividing the number of stimulated cells by those that were unstimulated, the lack of differences in stimulation index values would suggest that neither ADH1C genotype, VA level, nor PEN had an effect on the number of cells proliferating or their ability to respond to the mitogen stimulus. If immune responses had been compromised by any of these variables, we would have expected a reduction in the ability of PBMC cells to proliferate when stimulated.
The primary goal of this study was the validation of the ADH1C × VA nutrigenetic approach in the commercial feedlot sector, however, it was not accomplished. At this stage, the suggested marker-assisted management strategy is likely not plausible at a commercial level. The substantial amount of prior research behind the effect of reduced VA on fat traits made the lack of significance of VA unexpected. This lack of significance may, however, be due to the limited length of time the steers spent on their respective VA treatments, or the level of supplementation not allowing depletion of stored VA. There also may be a breed or coat color or delivery mechanism (VA provided in the feed v. in a monthly bolus) effect. The effects of implant status on both production and carcass traits were expected and followed prior research, as well as the purpose of hormonal implants – to accrue lean meat reasonably quickly. The secondary objective of this research was to show that a reduced level of dietary VA would not lead to signs of deficiency. After evaluating health and immune function data, there was no difference between any of the treatments within the ADH1C × VA marker-assisted management strategy, aside from the FIB data which is still consistent with normal cattle physiology. We were unable to discover any concerns relating to the impact of feeding as low as 25% NRC recommendations of VA to finishing feedlot cattle.
Acknowledgments
The research conducted in this manuscript was part of K.M.M.’s MSc thesis (University of Saskatchewan). Alberta Livestock and Meat Agency Ltd funded the carcass and health data population, and the Saskatchewan Ministry of Agriculture and the Canada-Saskatchewan Growing Forward bi-lateral agreement funded the immune analysis steers. Special thanks to the staff at Cattleland Feedyards Ltd and the University of Saskatchewan’s Beef Cattle Research Facility for animal care and data collection. Thank you to VIDO-InterVac and Quantum Genetix for allowing us to complete portions of this research within your facilities.
Declaration of interest
The authors do not know of any potential conflicts of interest resulting from this paper.
Ethics statement
The guidelines of the Guide to the Care and Use of Experimental Animals (CCAC, 1993) were followed when caring for all animals. Approval was received from the University of Saskatchewan Animal Research Ethics Board with respect to all experimental work involving the animals in this study.
Software and data repository resources
The animal data analyzed in this study are not publicly available in a repository at the present time, but are available from the corresponding author upon reasonable request.