1. Introduction
The enhanced role of the private sector in pension provision has led to substantial research on the performance of private systems, but most of the analytical effort has been focused on the accumulation phase of private pension provision. There are fewer empirical analyses of the payout phase, which involves the transformation of the final balance into retirement income through annuities and phased withdrawals. Moreover, most empirical studies of the performance of annuities markets involve the computation of money's worth ratios of annuities (the ratio of the expected present value of annuity payouts to the annuity premium) or a simple comparison of the annuity rate with market interest rates.
These studies provide a measure of the performance of annuity markets but do not analyze the determinants of such performance, particularly the factors related to the structure of the market and the regulation of providers. This is largely due to the absence of sufficient data on annuity rates, payouts, premiums, commissions, the structure of the industry, and the characteristics of annuity providers. The absence of analyses on the performance of the market for annuities is cause for concern, as many countries have introduced mandatory private pillars and will need to face the payout phase in the near future.
Chile provides one of the most relevant experiences for countries that have reformed their pension systems and that face the challenge of developing annuities markets. This is due to its 1981 pension reform, which involved the introduction of a fully funded system operated by the private sector. At the start of its pension reform, Chile was a middle-income country with incipient pension and insurance sectors. Twenty-five years later Chile had reasonably developed markets for retirement products, evidenced by around 320,000 annuity policies and 200,000 phased withdrawals, and 17 life insurance companies managing assets of 20% of GDP. Moreover, Chile's disclosure rules provide access to company data that are not easily obtainable in other countries.
This paper examines the main determinants of annuity rates in Chile, based on company-level data, and identifies the institutional and regulatory factors that have contributed to a good performance of annuities markets. The findings of the paper support the analysis in James, Martinez, and Iglesias (Reference James, Martinez and Iglesias2006), and Thorburn, Rocha, and Morales (Reference Thorburn, Rocha and Morales2006) that show that money's worth ratios in Chile have been high by international comparison, especially in the case of indexed annuities.
The paper is structured as follows. The second section reviews briefly the evolution of the Chilean annuities market in the 1990s and early 2000s. The third section presents an equation of the annuity rate that includes as determinants market rates, commissions, the portfolio characteristics of providers, and elements of market structure. The fourth section provides an analysis of the data used in the regressions. The fifth section discusses a number of preliminary tests designed to identify the most appropriate estimation model. The sixth section presents and discusses the estimation results. The last section summarizes the main findings and conclusions.
2. A brief review of the evolution of the Chilean marketFootnote 1
Chile's market for retirement products has its origins in the well-known pension reform implemented in 1981, involving the replacement of the PAYG system by a private and FF system that operates on a defined contribution (DC) basis. At the time of retirement, workers use their accumulated balances to purchase an annuity from an insurance company or a phased withdrawal from a pension fund manager. Disabled and survivor pensioners can also choose between annuities and PWs. As participation in the pension system is mandatory, the State provides some guarantees, including a minimum pension guarantee that has been set around 25% of the average covered wage, and a partial guarantee in the case of provider bankruptcy.
Workers can retire from the pension system at the normal retirement age of 65 and 60 for men and women, respectively. A worker can retire early if he or she has accumulated a sufficient balance in his or her account. This was defined as the balance needed to generate a pension equal at least to 50% of his or her average real wage in the past 10 years, and at least 110% of the minimum pension. A new Pension Law adopted in 2004 raised these parameters to 70 and 150%, respectively.
Retiring workers can take a partial lump-sum subject to strict conditions, and can also choose among three retirement products: an annuity, a phased withdrawal (PW), and a withdrawal combined with a deferred annuity. Relatively few workers draw partial lump-sums and the amounts are generally small. Annuities are provided by life insurance companies and are freely priced. Workers can choose among licensed companies upon retirement. Until recently, all annuities were fixed in UFs (Unidades de Fomento), an account unit indexed to the consumer price index.
The number of pensioners under the new system has increased significantly, reaching 520,000 in 2004. Roughly 60% of pensioners have chosen annuities, implying one of the highest rates of annuitization in the world. There is a strong association between annuitization and early retirement in Chile – 60% of all annuitants are early retirees and only 15% are normal age retirees. The remainder includes disabled retirees and survivors. The high rate of annuitization in Chile and its relation to early retirement have been analyzed in detail in James, Martinez, and Iglesias (Reference James, Martinez and Iglesias2006), and Rocha and Thorburn (Reference Rocha and Thorburn2006). For the purposes of this paper it suffices to say that annuities issued to early retirees (i.e., workers retiring below the normal retirement age of 65/60) constitute the largest segment of the annuities market.
The performance of annuities markets is frequently assessed through the computation of money's worth ratios (MWRs), or the ratio of the expected present value of annuity payments to the annuity premium. The MWR formula for a single immediate life annuity issued to a person aged x is as set out in Equation (1)

where:
MWRis the money's worth ratio;
Ais the monthly annuity payment, measured in UF (i.e. fixed in real terms);
wis the ultimate assumed age in the mortality table;
tp xis the probability that a life aged x at commencement is still alive attime t, that is after t months in this case, at age x+(t/12);
i tis the real interest rate used to discount payments at time, based onthe term structure of interest rates;
Pis the single premium payment made for the annuity contract.
MWRs are usually computed with risk-free rates, measured by the interest rates on government or central bank securities. A value for the MWR equal to one is interpreted as an actuarially fair annuity. MWRs significantly lower than one reveal a situation where annuitants do not get a good value for their money, while MWRs significantly higher than one indicate that annuitants get a good value for their premiums, but providers may be running thin margins.
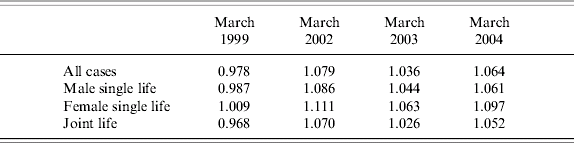
James, Iglesias, and Martinez (Reference James, Martinez and Iglesias2006) and Thorburn, Rocha, and Morales (Reference Thorburn, Rocha and Morales2006) report high MWRs in the Chilean case, indicating that the average annuitant got a good deal for his/her premium. Table 1 reproduces the MWR estimates by Thorburn, Rocha, and Morales (Reference Thorburn, Rocha and Morales2006). These estimates utilize data on actual annuity sales and were computed with an updated cohort mortality table and the yield curve on 20 year central bank instruments (the PRC-20). It is noteworthy that MWRs were slightly lower than one in 1999 but have exceeded one since then.
Money's worth ratios in March of 1999, 2002, 2003, and 2004
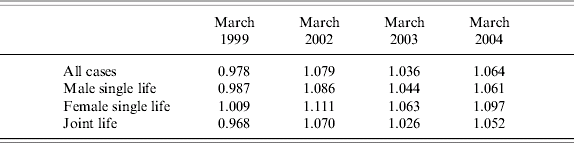
Source: Thorburn, Rocha, and Morales (Reference Thorburn, Rocha and Morales2006).
An alternative way to examine the efficiency of the annuity market is to compare the annuity rate with the risk-free rate. The annuity rate is defined as the internal rate of return on the annuity contract, and computed by solving for ar in Equation (2). All the other terms in Equation (2) are defined as above. An annuity rate equal to the risk-free rate is equivalent to a MWR equal to one and indicates an annuity contract which is fairly priced. An annuity rate significantly higher than the risk-free rate (equivalent to a MWR higher than one) indicates that annuitants get a good deal for their premiums, but the provider may be over-stretched.

As shown in Figure 1, the average annuity rate reported by life insurance companies was lower than the interest rate on 20 year Central Bank bonds during the 1990s, but in the early 2000s the difference between the two rates inverted, and the annuity rate has exceeded the risk-free rate since that year.Footnote 2 This inverted differential implies a good deal for annuitants but raises the question of whether providers have generated profits on their annuity business. Annuity providers can in principle pay higher annuity rates and still achieve positive spreads by investing in higher yield paper, and Table 2 indicates that the industry has shifted towards higher yield securities since 1995. The move towards corporate bonds since 2000 is noteworthy, with the share of this instrument increasing from 10 to 33% of the portfolio. These instruments are also indexed to prices, allowing providers to match their long-term liabilities while extracting a higher return. Moreover, although the higher return on these instruments reflects in part a risk premium, it also reflects a liquidity premium that rewards investors for their much lower liquidity.
Average Interest Rates on Annuities (RV-85), Central Bank Bonds and Corporate Bonds (% p.a.), 1993–2004

Portfolio of life insurance companies (in % of total), 1991–2004

Source: SVS.
Providers' costs include the commissions paid to annuity brokers and operating costs. As shown in Figure 2, commissions averaged 3% of the premium in the early 1990s, increased continuously to almost 6% at the end of the decade, and then decreased sharply to levels around 2%. The increase in the 1990s reflected the practice of charging higher commissions and providing an informal cash rebate to the retiring worker. This illegal practice prompted a reaction from policy-makers, and at the end of 2000 a new Pensions Law was submitted to Congress. The draft Law proposed a cap on broker's commissions and a new electronic quotation system. Although the new Pensions Law was only passed in 2004, the threat of the Law and political pressure induced a change in behavior, as indicated by the sharp decline in commissions.Footnote 3
Commission Rates (% of the Premium), 1990–2004

The commission cost adds about 30 basis points to the annuity rate, as shown by the adjusted annuity rate line in Figure 2, reducing the intermediation spread commensurately. In addition, providers also need to cover their operating costs, which have averaged 1.5% of assets. This implies thin net spreads, as well as low returns on equity – in the 1994–2004 period, life insurance companies generated an average return on equity of only 4%, compared to 25% in the case of pension fund managers. The reason why profit-maximizing companies have issued annuities with such thin margins is not entirely clear. It is possible that some companies have adopted aggressive pricing strategies in order to drive competitors out of the market and gain market share.Footnote 4 In any case, the high MWRs and the positive difference between the annuity rate and the risk-free rate indicate the existence of a very competitive annuities market in Chile.
3. An heuristic model of the annuity rate
The annuity rate is determined by the interaction of the flow demand and flow supply of annuities. The theoretical derivation of the flow demand and supply of annuities would require solving models of inter-temporal maximization for consumers and providers that are beyond the scope of this paper. Instead, this section follows an heuristic approach, examining the most important determinants of the annuity rate based on the factors that may affect the flow demand and supply of this product, both at the aggregate and the company levels.
The flow demand for annuities in any given period of time is determined by five major groups of factors: (i) retirement rules combined with the demographic structure of the working population; (ii) the return performance of pension funds during the accumulation phase; (iii) the menu of retirement instruments, including lump-sums and PWs; (iv) the rate of return on annuities vis-à-vis alternative retirement instruments; (v) the risk profile and preferences of retiring workers.
Retirement rules and the demographic structure of the working population together define the number of workers eligible for retirement in any given year, and the universe of potential annuitants in that year. The historic performance of pension funds also affects the demand for annuities because it defines the size of the pension balance for any given cohort. For example, a sustained period of higher returns results in larger pension balances, possibly leading several cohorts to anticipate retirement and increase the demand for all retirement products, including annuities.
The menu of retirement products is also a very important determinant of the aggregate demand for annuities. When lump-sums are allowed, the demand for annuities may be weak due to the adverse selection effect that has been extensively examined in the literature.Footnote 5 However, lump-sums are severely restricted in Chile, and this restriction increases the potential demand for annuities in the Chilean case.
The aggregate demand for annuities also depends on the level of the annuity rate vis-à-vis the return on PWs, which is the only alternative retirement instrument in the Chilean case. The return on PWs depends fundamentally on market returns, as the PW balance remains invested in financial instruments. Finally, the demand for annuities depends on behavioral parameters such as the degree of risk aversion and the desire of retiring cohorts to leave bequests. However, these factors are less important at the aggregate level, because it is unlikely that they change significantly across different retiring cohorts.
The flow supply of annuities is derived from a long-run profit maximization process of annuity providers, that takes into consideration the current and expected returns on financial assets, market annuity rates, operating costs, and proper consideration of all the complex risks involved in the annuity business, including longevity, reinvestment, and credit risks.
Figure 3 provides a starting point for analyzing the interaction of the flow aggregate demand and flow aggregate supply of annuities in Chile, and its impact on the annuity rate. The aggregate flow demand for annuities is shown as the upward sloping curve in Figure 3. A reduction in the annuity rate results, ceteris paribus, in a decline in the demand for annuities (measured by the number of new annuity policies in a given period of time) for two reasons. First, PWs (the alternative retirement product) become more attractive, leading new retirees to choose this instrument at the expense of annuities. Second, workers eligible for retirement may decide to postpone retirement or to retire but defer the annuity, on the expectation of an increase in annuity rates.
Supply and Demand for Annuities

As mentioned before, stricter conditions for retirement or poor pension fund performance in the pre-retirement period would both cause a reduction in the flow demand for annuities – in Figure 3 the demand curve would shift to the left. More interesting to the purpose of this paper is the analysis of changes in interest rates and other market conditions. A general increase in interest rates vis-à-vis the annuity rate would imply an increase in PW returns and lead to a contraction in the aggregate demand for annuities.Footnote 6 Other factors that could affect the aggregate demand for annuities include a move by all annuity providers towards riskier portfolio strategies or increased leverage. The perception of greater risk associated with annuities could lead potential annuitants to demand a risk premium, also shifting the demand curve to the left.
The aggregate flow supply of annuities is shown as the downward sloping curve in Figure 3. The aggregate supply is downward sloping because the annuity rate is the basic cost of issuing new annuity contracts. An increase in annuity rates relative to the interest rates on financial assets implies a reduction in intermediation spreads and profit margins, and a loss of enthusiasm in issuing new annuity policies. A general increase in interest rates for the same annuity rate implies an increase in spreads and profit margins and would lead to a supply expansion – in Figure 3 the aggregate supply would shift to the right. Changes in market structure resulting in greater industry concentration and increased monopoly power would lead to a contraction in the aggregate supply – in Figure 3 the aggregate supply would shift to the left.
Market equilibrium is illustrated in Figure 3 with an annuity rate of 4% and 20,000 new annuities issued within one year (these are roughly the figures for 2004). A general increase in interest rates would lead to a contraction in demand and an expansion in supply, with ambiguous effects on the flows of new annuities, but producing an unambiguous increase in annuity rates. This simple framework also allows the analysis of the impact of other variables on the annuity rate. For example, a general portfolio shift from government bonds to higher yield corporate bonds could result in an expanded supply of annuities and a higher annuity rate. Providers would expand supply and increase the annuity rate if they could extract an increase in the risk-adjusted return. This would be possible if the yield on corporate bonds contained a liquidity premium. If annuitants perceive an increase in risk and demand a risk premium, the aggregate demand would contract, reinforcing the increase in the annuity rate. Again, the effect on the new flows of annuities is ambiguous, but the impact on the annuity rate is unambiguously positive.
The equilibrium depicted in Figure 3, where the market is cleared by one annuity rate, admittedly simplifies the structure and organization of annuity markets. First, the market comprises several types of annuities and rates. Second, adverse selection may restrict severely the overall size of the market, and for some risk segments there may not be a market clearing annuity rate. In a scenario of high and volatile interest rates the market may also collapse, as providers may require very high spreads or even refuse to take the underwriting risk. However, if the potential annuitant population is large, because the private pension system is mandatory, adverse selection is reduced by restrictions on lump-sums, and macroeconomic conditions are stable – the conditions observed in Chile during the 1990s and early 2000s – this simple framework can be applied as the basis for an empirical analysis of the annuity rate.
In the case of Chile, therefore, it seems possible to specify an annuity rate equation as a reduced form equation of an underlying structural model of the demand for and the supply of annuities. Introducing company-level characteristics, such a reduced form equation can be written as

where AR j,t is the average annuity rate of the annuities offered by company j at time t (the subscripts j and t will not be repeated hereafter); RF is the risk-free rate; ROFI is the rate of return on other fixed income instruments; SOFI is the share of other fixed income assets in the fixed income portfolio of providers; ROA is the rate of return on other assets; SOA is the share of other assets in the portfolio of providers; LEV is the financial leverage; MIS is the duration mismatch; MSHARE is the market share measured by the stock of technical reserves; AP is the average annuity premium; CR is the commission rate; and HER is the degree of industry concentration measured by the Herfindahl index. The variables RF, ROFI, ROA, and HER are common to all the companies, whereas the others are company-specific. The equation also shows the expected sign of the coefficient.
An increase in RF, the risk-free rate, leads to an increase in the annuity rate, for the reasons already elaborated above. The risk-free rate, measured by the interest rate on Central Bank bonds, is one of the most important determinants of the annuity rate, as it is the key reference rate for both annuitants and providers – it captures the basic opportunity cost for potential annuitants and the basic return on assets for annuity providers.
An increase in the rate of return on other fixed income instruments, ROFI (measured by the interest rates on corporate bonds), or on other assets, ROA (measured by the return on equity and foreign exchange assets), for the same levels of RF, could also lead to an increase in the annuity rate, although such an increase would arguably have to happen on a risk-adjusted basis – if agents are taking risk into account properly, an increase in the rates of return on financial assets due entirely to risk could have little impact on the demand or supply of annuities. The major problem in utilizing these variables is, however, their very high correlation with RF.
A more promising route to test the impact of portfolio variables on the annuity rate is to use the share of the main classes of privately issued assets in the overall portfolio. The share of other fixed income assets, SOFI, and other assets, SOA, may capture the portfolio strategies of annuity providers and their attempts to extract additional returns. An increase in these shares would imply an increase in expected portfolio returns for the same levels of ROFI, ROA, and RF. If this increase in the expected portfolio return reflects factors other than risk, competitive pressures could lead providers to share them with annuitants. This would be possible if the spread of corporate bonds over government bonds reflects not only default risk but also other factors such as a liquidity premium.Footnote 7 If potential annuitants perceive an increase in risk associated with a higher share of these assets, they would demand a risk premium and the impact on the annuity rate would be stronger. In any case, the impact of SOFI and SOA on the annuity rate is unambiguously positive. An increase in LEV, or the financial leverage of providers, should also have a positive impact on the annuity rate, given the higher levels of risk involved.
The variable MIS measures the mismatch in the duration of provider assets and liabilities. The average duration mismatch in Chile has ranged from three to four years, with some variations across companies and over time. Such a duration mismatch penalizes providers in at least two ways. First, it exposes providers to reinvestment risk. Second, it also penalizes providers through reserve regulations, which impose larger reserves the greater the duration mismatch. Therefore, an increase in the mismatch, either across providers or over time, should lead to a contraction in supply and lower annuity rates.
The variable MSHARE represents the market share of each company, measured by the stock of technical reserves, and can have multiple and conflicting effects on the annuity rate. A large market share captures absolute size and should reflect the capacity of companies to achieve lower costs through economies of scale. Companies with lower operating costs should be able to compete more effectively and offer higher annuity rates. At the same time, a large market share may also be associated with market reputation and brand name, allowing companies to pay lower annuity rates, relative to less-known newcomers attempting to gain market share. A large market share may also be a proxy for the size of the sales force and the number of branches and distribution channels. Companies with better distribution channels may also be able to attract customers paying lower annuity rates and lower commission rates.Footnote 8
The impact of the average premium, AP, on the annuity rate cannot be determined a priori. On the one hand, the size of the annuity premium is associated with levels of worker wealth and education, which are positively correlated with expected longevity. From this aspect, a higher annuity premium should lead to lower annuity rates. However, life insurance companies value customers with larger annuity premiums, just like commercial banks value customers with larger deposits, because they involve lower unit costs and higher unit profits for the providers. Therefore, annuity providers may be willing to pay higher annuity rates for larger premiums, just like banks pay higher interest rates for larger deposits.
The variable CR measures the commission rate, defined as the ratio of broker commissions to the premium. As shown in Section 2, commission rates increased continuously in the 1990s and then declined rapidly in the early 2000s as a result of political and supervisory pressures. An increase in the commission rate has an unambiguously negative impact on the annuity rate, due to several factors operating both on the demand and the supply of annuities – under the heuristic model outlined above a higher commission rate leads simultaneously to an expansion in the demand and a contraction in the supply of annuities.
An increase in the level of commissions, results in more intense broker activity and this may lead eligible workers to buy an annuity without a complete search of annuity rates in the market. In some cases the broker may provide services which are valued by the consumer, such as the verification of retirement conditions and all the required paperwork. The eligible worker may be more willing to sacrifice market search when these services are provided. There is an even more powerful substitution effect between the commission rate and the annuity rate when the commission is partly shared with retiring workers. The illegal practice of sharing the commission was a loophole in the system that allowed workers de facto access to a modest lump-sum. Several of these workers were probably willing to accept a lower annuity rate in exchange for such an informal lump-sum.
An increase in commission leads to a contraction in supply because it implies an increase in company's costs. The company needs to issue an annuity based on a smaller premium net of commissions. If interest rates, operating costs, and all other variables remain constant, the only way to preserve profit margins is to reduce annuity payments and the annuity rate. From another angle, the company will try to maintain constant the adjusted annuity rate, which is the annuity rate plus the capitalized value of the commission.
Finally, the variable HER captures the degree of industry concentration, as measured by the Herfindahl index. An increase in the Herfindahl index due to a reduction in the number of market participants should reflect the greater monopoly power of incumbents and be accompanied by a contraction in aggregate supply and a lower annuity rate.
4 The data
The sample is based on pooled quarterly data of active annuity providers over the 1993–2003 period. The sample starts in the first quarter of 1993 and ends in the third quarter of 2003, yielding a total of 43 quarters. The number of active providers ranged from 17 to 24 during the period under examination. This yields a total of 693 observations. The time unit is the quarter because of some limitations on monthly data. First, balance sheet data on the providers such as the portfolio composition, reserves, and leverage are only available quarterly. Second, some series such as annuity rates and commissions are available monthly, but suffer from discontinuities due to the fact that many active providers do not sell annuities every month. All the flow variables were constructed by computing averages of the monthly figures within the quarter. The stock variables are end of quarter figures. The Insurance Supervisory Agency (Superintendencia de Valores y Seguros – SVS) was the source of most of the raw data used in the analysis. Market interest rates were obtained from the Central Bank of Chile.
AR is the average annuity rate of each company during the quarter, computed by the average of monthly rates, weighted by the premiums. Each company needs to calculate the annuity rate of every annuity issued, based on a regulated mortality table, which was the RV-85 during the sample period.Footnote 9 The SVS provides a breakdown of annuity rates by type of policy, i.e., early retirement, normal age retirement, disability, and survivors. The empirical analysis focuses on the annuity rates for early retirement policies, AR(EARLY), and normal age retirement policies, AR(OLD).
The risk-free rate, RF, was measured by the interest rate on 20 year indexed bonds issued by the Central Bank of Chile (PRC-20). The instrument was discontinued in 2002, but secondary market quotations are available after that date and were used to complete the series. Monthly data on interest rates on corporate and mortgage bonds are available from the SVS, but only since 1995, and reflecting instruments with varying maturities, possibly resulting in some consistency problems. Estimates of the returns of other risky assets such as equity can be obtained, but there are no direct data on the returns on foreign assets held by annuity providers.
The share of other fixed income assets, SOFI, was measured by the combined share of corporate bonds, mortgage bonds, and other privately issued fixed income assets in the fixed income portfolio. The share of other assets, SOA, was measured by the combined shares of variable income and foreign assets in the total portfolio. Leverage, LEV, was measured by the ratio of technical reserves to equity. The duration mismatch, MIS, was measured by a coefficient reported by companies, for compliance with the capital rules.Footnote 10 Market share, MSHARE, was measured by dividing the technical reserves of each company by total technical reserves in the system. Note that technical reserves account for a large share of the balance sheet and also constitute a good proxy for scale.
The average premium for each company, AP, is directly available from the SVS, broken down by class of annuity, including old age, AP(OLD), and early retirement policies, AP(EARLY). The quarterly figure is simply the average of the monthly figures. The commission rate was computed by dividing the payments to brokers by the total premium. Finally, the Herfindahl index was constructed on the basis of company premiums. As in the case of average premium, the Herfindahl index was also constructed separately for early retirement policies, HER(EARLY), and normal old age policies, HER(OLD).
5 Model specificationFootnote 11
The econometric analysis of the annuity rate involves the following preliminary steps. First, the series are tested for non-stationarity through a set of unit root tests; second, several specification tests are conducted, involving pooled OLS, fixed effects, and random effects; third after identifying the best estimating model, a test of autocorrelation is performed to select an appropriate robust variance–covariance matrix estimator.
5.1 Unit root testing
Table 3 presents a summary of the unit root tests performed for each series. All the tests considered have a unit root process as the null hypothesis, either a common one for all the companies or a specific process for each company. The numbers in Table 4 correspond to asymptotic p-values for each test statistic.
Panel unit root tests (p-values)

Fixed effects estimation
Dependent variable: AR(EARLY) Sample: 1993Q1–2003Q3; cross-sections included: 24 Total panel observations (unbalanced): 693 R2=0.7968; Adj. R2=0.7854; F-statistic=69.4348; p-value (F-statistic)=0.0000

Notes: ***=significant at the 1% level; **=significant at the 5% level; *=significant at the 10% level.
The first test statistic (LLC) is due to Levin, Lin, and Chu (Reference Levin, Lin and Chu2002). In this case, the null hypothesis is a common unit root process for all the cross-section units. The statistic is based on an ADF (Augmented Dickey–Fuller) specification for each cross-section, and is asymptotically distributed as N(0,1). The second statistic (IPS) was proposed by Im, Pesaran, and Shin (Reference Im, Pesaran and Shin2003). In this case, the null hypothesis is a specific unit root process for each individual cross-section unit. The IPS test also has an asymptotic N(0,1) distribution. Finally, the Fisher (Reference Fisher1932) (ADF) statistic proposed by Maddala and Wu (Reference Maddala and Wu1999), and Choi (Reference Choi2001) combines p-values from individual unit root tests, resulting in a test statistic that is asymptotically distributed as a Chi-square with 2N degrees of freedom. All the three test statistics are constructed using the Modified Akaike Information Criterion (MAIC) proposed by Ng and Perron (Reference Ng and Perron2001).
As shown in Table 3, the null hypothesis of a unit root is rejected – at least by one test statistic – for the two annuity rates, SOFI, LEV, AP(OLD), MIS, MSHARE, and HER(OLD). The non-rejection of unit roots in the other variables seems to be related to the presence of a structural change in the intercept of their deterministic trend, which occurs at the end of the sample, as discussed in the next section. As stated by Perron (Reference Perron1989), breaks in the deterministic function of a trend stationary series are likely to produce the non-rejection of the null of a unit root.
If the series are trend-stationary and some of them are affected by a discrete change in the intercept of their deterministic trend, this deterministic non-stationarity can be addressed by including in the regressions a time trend plus an additive dummy variable, which is the procedure followed below. Note also that if the annuity rate (AR) is a stationary process, the inclusion of a potential non-stationary independent variable is no longer a concern, since in this case there is no possibility of spurious correlation.
5.2 Specification testing
There are three alternative models to consider in the estimation of the annuity rate. The first is a pooled OLS regression where no heterogeneity is allowed; the second is a fixed effects model where a specific constant term for each cross-section unit is considered; and the third is a random effects specification which assumes heterogeneity in the form of an error component model. The pooled OLS model is tested separately against the fixed effects and the random effects specifications, and these two alternative specifications are compared in order to select a way to model cross-section heterogeneity.
The null hypothesis of a pooled OLS is strongly rejected in favor of a fixed effects model, based on the F-statistic and a likelihood ratio test. The null hypothesis of a pooled OLS model is also rejected in favor of a random effects specification, based on the results of the Breusch–Pagan (BP) Lagrange multiplier test, as well as the more powerful test proposed by Honda (Reference Honda1985). Given the rejection of the pooled OLS model against both the fixed and random effects, the two alternatives are compared by a Hausman-type test, which favors the fixed effects specification to model cross-section heterogeneity.
Given the long time series dimension of the panel utilized, autocorrelation could be a more serious problem than heteroskedasticity. To test for AR(1) autocorrelation under fixed effects, we use an extension of the Breusch–Godfrey (BG) statistic. The null hypothesis of no first-order serial correlation under fixed effects is strongly rejected by the BG statistic. In order to ensure an appropriate inference about estimated coefficients, we used the heteroskedasticity-autocorrelation consistent covariance matrix for the parameters estimated by the fixed effects model proposed by Arellano (Reference Arellano1987).
6. Estimation results
The analysis of the estimation results focuses on the regressions with the annuity rate of early retirement policies as the dependent variable, because early retirement annuities account for 60% of the market. Excluding disability and survivor annuities, this share increases to around 80%. The regressions with the annuity rate of normal old age policies are shown at the end of the section.
Table 4 shows the estimates of Equation (1) with the fixed effects model, excluding ROFI and ROA. The interest rate on other fixed income assets, ROFI, was excluded because it turned out to be non-significant, due to the strong colinearity with the risk-free rate – as shown in Appendix Table 1, the correlation coefficients between the interest rates on PRC-20, corporate bonds and mortgage bonds were 0.86 and 0.92, respectively. The interest rate on other assets, ROA, was excluded because it could not be computed, due to the lack of data on the return on foreign assets. The quarterly return on equity can be computed but also turned to be non-significant. As mentioned before, these results are expected and do not affect the exercise, because the shares of other fixed income assets and other assets, capture the expected return of the portfolio of annuity providers.
As shown in Table 4, the regression explains about 80% of the variations of the annuity rate across companies and over time, the coefficients of all explanatory variables have the expected signs (or signs that can be reasonably explained in the cases where they could be either positive or negative) and are significant, with the exception of MIS. The coefficient of the risk-free rate is 0.37, only slightly higher than the value obtained by Walker (Reference Walker2005) in a regression of the annuity rate against the lagged risk-free rate using monthly data. This coefficient looks low, as one would expect a tighter relationship between the annuity rate and the key interest rate, and possibly a coefficient close to one. The relationship between the annuity rate and the risk-free rate will be examined in more detail below.
The coefficients of SOFI and SOA are positive and significant, capturing the impact of portfolio strategies on the annuity rate. As shown in Table 2, during the sample period there were two major portfolio shifts; namely, a reduction in the share of equity from 10% in 1995 to about 3% in the following years, and a sharp increase in the share of mortgage and corporate bonds from 37% in 1995 to 66% in 2003. The share of Central Bank bonds decreased proportionately. The decline in the share of equity happened as insurance companies sold their equity holdings to foreign strategic investors in the mid 1990s at attractive prices. These prices reflected the large capital gains accumulated in previous years and possibly a control premium. It is clear that asset managers decided not to rebuild their equity portfolios after that event, in order to reduce the duration mismatch and possibly perceiving that the period of exceptional equity returns was over. This perception may have resulted in an overall downward adjustment of average expected portfolio returns and a commensurate adjustment of the annuity rate.
During the same period annuity providers initiated a move towards higher yield fixed income assets. The increase in the holdings of corporate bonds after 2000 was particularly impressive. The positive coefficient of SOFI may reflect the strategy of annuity providers to extract an increase in risk-adjusted returns by capturing the liquidity premium in corporate bonds, which are traded less and have a much lower liquidity than Central Bank and government bonds. These institutional investors can afford to hold these less liquid assets given their longer time horizon and the nature of their liabilities – annuities are long-term obligations, cannot be redeemed, and the associated payouts are predictable. By capturing the liquidity premium and investing only in highly rated bonds (most corporate bonds are rated AA or higher), annuity providers may have felt that they were able to compete more aggressively in the annuities market while maintaining the degree of portfolio risk at acceptable levels. The coefficients of SOFI and SOA may also reflect a higher degree of portfolio risk and a higher risk premium demanded by annuitants.
The coefficients of SOFI and SOA are small, indicating that portfolio shifts have had only a moderate impact on the annuity rate. These results are consistent with several scenarios, including a small liquidity premium, and a partial and delayed sharing of higher returns with annuitants. In any case, it is noteworthy that higher portfolio returns tend to be partially shared with annuitants.
The coefficient of LEV is positive and significant, reflecting the perception of higher risk involved in the combination of a riskier portfolio, large fixed liabilities, and a declining capital buffer. This result is consistent with the existence of a risk premium in the annuity rates of more leveraged companies, and has been obtained despite the fact that leverage ratios were measured at book values.
The coefficient of MIS was not significant, however. A larger duration mismatch implies more exposure of the provider to reinvestment risk, which should have a negative impact on the annuity rate. This result may be due simply to a deficient proxy for the duration mismatch. It may also be due to the negative correlation between the mismatch and the share of risk-free assets (or equivalently the positive correlation between MIS and SOFI – see the correlation matrix in the appendix). Some companies indicate that there were not sufficient corporate bonds with long duration, and in order to reduce the duration mismatch and avoid penalties under the capital rules they frequently needed to invest more in risk-free assets with long duration and sacrifice yield.Footnote 12
The coefficient of MSHARE is negative and significant, suggesting that brand name and the existence of a large distribution network have had a more powerful impact on the annuity rate than the pure scale effect during the sample period. It may also reflect the strategy of some small companies to gain market share by offering higher annuity rates, even at the expense of positive financial results. Equation (1) was re-estimated replacing MSHARE by the stock of technical reserves in order to explore further the existence of a scale effect, but the results did not change significantly (the correlation coefficient between the two variables is 0.7, as shown in the appendix table).
The coefficient of the average premium, AP(EARLY), is positive and significant, indicating that the unit cost effect is more important than the longevity effect. This result is consistent with the regression results obtained by Thorburn, Rocha, and Morales (Reference Thorburn, Rocha and Morales2006) for money's worth ratios based on a separate dataset of individual annuities.
The coefficient of the commission rate, CR, has the expected negative sign and is significant. This result confirms the important role that brokers have played in the marketing of annuities in Chile, and will be further examined below. Finally, the coefficient of the Herfindahl index, HER(EARLY) is also negative and significant, confirming that a more concentrated annuities market tends to have a negative effect on the annuity rate. It is interesting to note that in the case of Chile the reverse happened during the sample period – HER(EARLY) declined as the annuities market became more competitive during the 1990s, with the entry of several new companies.
As shown in Table 4, the regression also includes a dummy variable taking value 0 for the period 1993Q1–2001Q2, and value 1 for the rest of the sample, to control for a structural change in the annuities market during this period. The dummy was also multiplied by each of the right-hand side variables in the model, to capture structural breaks in the individual coefficients. Based on t-statistics, the null hypothesis of no change in the slope was rejected for the variables RF, CR, and AP. Therefore, the final regression reported in Table 3 includes only the general dummy and the multiplicative dummies for these three variables.Footnote 13
The possibility of a structural break was first raised by Walker (Reference Walker2005), based on the observation that the scandal of large commissions and illegal rebates in the 1990s had prompted the government to submit a new draft pension law to Congress in 2000. As mentioned in Section 2, the draft law proposed, among other measures, an electronic quotation system and controls on broker's commissions. The draft law was only approved in 2004, but the threat of these legal changes may have changed dramatically the behavior of annuity brokers and providers. Walker (Reference Walker2005) tested the hypothesis of a structural break in the coefficient of the risk-free rate and of a unitary long-run coefficient at the end of the sample, and was not able to reject any of the two hypotheses. He concludes that the annuity rate became the key instrument of competition after 2000. These tests were performed through regressions of the annuity rate against lagged values of the risk-free rates and the annuity rate using monthly series of the two variables.
The results in Table 4 are largely consistent with Walker's and supportive of a structural break in the regression. It is interesting to note that two of the three coefficients that experienced a structural break are precisely those related to the risk-free rate and the commission rate. Taking into consideration the multiplicative dummy, the coefficient of the risk-free rate increases from 0.37 to 0.71. The hypothesis of a unitary long-run coefficient at the end of the sample period was tested by means of a Wald statistic including the lagged dependent variable plus two lagged values for the risk free rate on the right-hand side of the equation. The calculated value for the test was 0.65, with a p-value of 0.42. Therefore, the null hypothesis of a unitary long-run coefficient at the end of the sample cannot be statistically rejected at conventional significance levels.
Equation (3) was re-estimated by the fixed effects model, but with the consistent asymptotic variance described above, with the results shown in Table 5. All the variables remain significant, although the share of other risky assets, SOA, only remains significant at the 10% level. Considering that the coefficient for the MIS variable is statistically not different from 0, Equation (3) was re-estimated again by the fixed effects model with robust standard errors, but excluding the MIS variable. As shown in Table 6, the exclusion of the MIS variable generally improves the t-statistics of all estimated coefficients, including the coefficient of SOA.
Fixed effects estimation, with robust standard errors
Dependent variable: AR(EARLY) Sample: 1993Q1–2003Q3; cross-sections included: 24 Total panel observations (unbalanced): 693 R2=0.7968; Adj. R2=0.7854; F-statistic=69.4348; p-value (F-statistic)=0.0000

Notes: ***=significant at the 1% level; **=significant at the 5% level; *=significant at the 10% level.
Fixed effects estimation, with robust standard errors
Dependent variable: AR(EARLY)Sample: 1993Q1–2003Q3; Cross-sections included: 24 Total panel observations (unbalanced): 725 R2=0.7995; Adj. R2=0.7890; F-statistic=76.2162; p-value (F-statistic)=0.0000

Notes: ***=significant at the 1% level; **=significant at the 5% level; *=significant at the 10% level.
Tables 7 through 9 show the estimates of Equation (3) with the annuity rate on normal old age policies as the dependent variable, replicating the same steps and procedures followed above. The coefficients have the expected signs and their values are similar to the ones obtained with the annuity rate on early retirement policies, although some of them become marginally non-significant at the 10% level, when estimated with robust standard errors. It is possible that these differences are simply due to a much smaller sample – as mentioned before, the number of new annuities classified as normal old age (i.e., bought by males and females above 65 and 60 years of age) is only 20% of total flow of new annuities, excluding disability and survivor annuities.
Fixed effects estimation
Dependent variable: AR(OLD) Sample: 1993Q1–2003Q3; Cross-sections included: 24 Total panel observations (unbalanced): 675 R2=0.7909; Adj. R2=0.7787; F-statistic=65.1110; p-value (F-statistic)=0.0000

Notes: ***=significant at the 1% level; **=significant at the 5% level; *=significant at the 10% level.
Fixed effects estimation, with robust standard errors
Dependent variable: AR(OLD) Sample: 1993Q1–2003Q3; Cross-sections included: 24 Total panel observations (unbalanced): 675 R2=0.7909; Adj. R2=0.7787; F-statistic=65.1110; p-value (F-statistic)=0.0000

Notes: ***=significant at the 1% level; **=significant at the 5% level; *=significant at the 10% level.
Fixed effects estimation, with robust standard errors
Dependent variable: AR(OLD) Sample: 1993Q1–2003Q3; cross-sections included: 24 Total panel observations (unbalanced): 675 R2=0.7933; Adj. R2=0.7821; F-Statistic=71.3020; p-value (F-statistic)=0.0000

Notes: ***=significant at the 1% level; **=significant at the 5% level; *=significant at the 10% level.
7 Summary of findings and conclusions
This paper formulated and estimated a reduced form equation for the annuity rate in Chile, based on a heuristic model of the demand and supply of annuities that incorporates company-level data. The estimated equation explains 80% of the variations of the annuity rate across companies and over time, and most of the coefficients have the expected sign, or signs that can be reasonably explained, and are significant.
The results of the exercise indicate the existence of a very competitive market for annuities in Chile. During the period under examination market competition took place through the annuity rate and broker activity. The illegal provision of cash rebates to annuitants (made possible by increasing commissions) became a powerful element of competition in the 1990s, and the results confirm the substitutability between annuity rates and commissions (which included the rebates) as two elements of price competition. The reduction in broker commissions and rebates in the 2000s translated into higher annuity rates and enhanced the role of the annuity rate as the main instrument of competition. The role of brokers has possibly been reduced but has not been eliminated.
During the past decade there were significant changes in the portfolio strategies of annuity providers. Most noticeably, there was a marked shift from government bonds towards higher yield fixed income assets, especially corporate bonds. It is possible that annuity providers have been able to generate an increase in risk-adjusted returns, as the corporate and mortgage bonds held in their portfolios have been issued primarily by highly rated companies (implying a low credit risk), and these instruments are usually held to maturity, allowing providers to extract the liquidity premium. Competitive pressures may have led providers to share the increased returns with annuitants, and the results confirm the small but positive impact of the share of higher yield assets on the annuity rate. However, it is possible that the coefficient reflects a risk premium as well.
Other portfolio variables such as financial leverage also have a positive impact on the annuity rate, possibly reflecting the presence of a risk premium. The presence of an annuity guarantee would tend to reduce the need for a risk premium, due either to higher portfolio risk or to higher leverage, but the result can still be explained, because the annuity guarantee is partial.
The coefficient of the Herfindahl index and the market share variable were both negative and significant, also reflecting the high degree of competition in the annuities market during the period under examination. The Herfindhal concentration index declined significantly during the 1990s with the entry of several new providers, and although it increased recently due to the exit of three firms, it remains substantially lower than at the beginning of the decade. Finally, the significance of the market share variable suggests that market reputation and a more extensive distribution network may allow larger companies to pay lower annuity rates and remain competitive. It may also reflect the attempts of smaller companies to gain market share through aggressive price strategies.
The results of the exercise are consistent with the results obtained by James, Martinez, and Iglesias (Reference James, Martinez and Iglesias2006) and Thorburn, Rocha, and Morales (Reference Thorburn, Rocha and Morales2006), showing that money's worth ratios in Chile were high by international comparison. Both results indicate that the development of annuities markets must involve efforts to develop capital market instruments with long durations that can be purchased by annuity providers. The existence of a wide range of instruments with higher yields allows providers to hedge their risks while sharing a portion of the higher yields with annuitants when markets remain competitive. When annuities are indexed to prices, as in Chile and many other countries, these instruments need to be indexed as well. Developing indexed government bonds with long durations and facilitating the development of indexed private instruments will be one of the challenges faced by policy-makers in many reforming countries.Footnote 14
This paper was derived from a comprehensive report of the Chilean market for retirement products, coordinated by Roberto Rocha and Craig Thorburn, and part of a broader World Bank project on the payout phase of private pension systems involving several country studies. The authors are grateful to Sara Zervos and Ying Lin for valuable inputs provided in the early stages of the analysis. The authors are also grateful to Eduardo Walker, Dimitri Vittas, Augusto de la Torre, Augusto Iglesias, Guillermo Martinez, Solange Berstein, Guillermo Larrain, Alejandro Ferreiro, Ernesto Rios, Osvaldo Macias, Richard Hinz, and several industry participants for helpful comments on earlier versions of the paper.
Pairwise correlation matrix

Note: ROFI(B) and ROFI(M) are the rates of return on corporate and mortgage bonds, respectively.