Implications
Our analysis of 51 single nucleotide polymorphisms revealed that 13 were significantly associated with one or more of the tested milk traits, which included the traditional milk coagulation properties, curd firmness (CF) modeled on time t (CFt), maximum CF (MCF) and acidity. These results suggest that such loci could be useful in gene-assisted selection programs aimed at improving milk technological traits in Brown Swiss cattle.
Introduction
Traditionally, animal production has focused on providing large amounts of food at a low cost. More recently, however, there has been a growing interest in the global quality and technological aspects of livestock production, especially dairy products. The fraction of milk used for cheesemaking is on the rise worldwide (International Dairy Federation, 2013), increasing the importance of the relevant milk parameters, which include cheese yield, milk coagulation properties (MCPs), and the fat and protein contents (Bittante et al., Reference Bittante, Penasa and Cecchinato2012). MCPs, which are important measures of the technological qualities of milk (Annibaldi et al., Reference Annibaldi, Ferri and Morra1977; Bittante et al., Reference Bittante, Penasa and Cecchinato2012), include rennet reactivity, curd-firming capacity, syneresis ability and whey drainage, all of which are crucial features for cheesemaking. The suitability of milk for cheesemaking is traditionally evaluated by measuring the rennet coagulation time (RCT), the time required for curd firming (k20) and the firmness (a30 or a45, depending on the testing time used), elasticity, permeability, contractility and syneresis of the curd. However, these traditional MCPs are single-point measures obtained from computerized renneting meters, and their usefulness is limited by the presence of non-coagulating samples, problems in measuring k20 for slowly coagulating milk, the low repeatability and reproducibility of k20 and the high dependency of a30 on RCT (Ikonen et al., Reference Ikonen, Morri, Tyrisevä, Ruottinen and Ojala2004). A recent study (Bittante et al., Reference Bittante, Penasa and Cecchinato2012) suggested a new approach for overcoming these limitations: the authors modeled the coagulation process by using all of the point observations collected during the lactodynamographic analysis and extending the duration of the test. This approach allowed the calculation of new parameters summarizing all available information: curd firmness (CF) modeled for time t (CFt) and the maximum CF (MCF) traits (Figure 1). This analysis yielded values for the traditional parameters similar to those obtained from the computerized renneting meters, while further allowing estimations to be made for samples with very late coagulation or very slow curd firming. However, no previous study has estimated the genetic parameters of CFt and MCF.
Modeling prolonged observations of curd firmness (CF) at t time (CFt), model parameters: RCT = rennet coagulation time; k20 = curd-firming time of samples reaching 20 mm of firmness within 45 min from enzyme addition; a30 = curd firmness at 30 min after enzyme addition; CFP = potential asymptotical CF in absence of syneresis; kCF = curd firming instant rate constant; kSR = syneresis instant rate constant and representation of maximum CF traits MCF: CFmax = maximum CFt value; tmax = time at CFmax; modified from Bittante et al. (2012).

Another important trait related to cheesemaking is milk acidity, with high-pH milk typically showing a longer RCT and lower a30 and a45 values. Okigbo et al. (Reference Okigbo, Richardson, Brown and Ernstrom1985) reported that CF decreased as the pH increased, and Ikonen et al. (Reference Ikonen, Morri, Tyrisevä, Ruottinen and Ojala2004) confirmed that changes in pH can significantly affect CF. However, although these traits exhibit genetic variations (Cecchinato et al., Reference Cecchinato, Penasa, De Marchi, Gallo, Bittante and Carnier2011) their inclusion as breeding goals in conventional selection programs has been hampered by the high cost of the necessary phenotyping studies.
In recent years, due to their genomic abundance and typing flexibility, single nucleotide polymorphisms (SNPs) have been used to determine the genetic background of underlying quantitative traits and analyzed for their possible use in marker-assisted selection. Thus, researchers could potentially overcome the phenotyping-cost issues by identifying SNPs that reflect linkage with milk quality and MCPs. These may then be integrated into selection programs.
In a previous study (Cecchinato et al., Reference Cecchinato, Ribeca, Chessa, Cipolat-Gotet, Maretto, Casellas and Bittante2014), we analyzed 96 SNPs in 54 candidate genes within a population of Brown Swiss cows. We retained 51 polymorphic SNPs (in 37 candidate genes) for an association analysis with milk yield, composition, milk urea nitrogen content and somatic cell score. Here, we extend our previous work by performing an association analysis between the identified polymorphic SNPs and the traditional and new technological traits of milk (i.e., MCPs, CFt, the MCF traits and acidity) in the same population, in order to increase our knowledge regarding the mutations responsible for individual differences related to milk technological traits. More specifically, we herein sought to estimate the variance components and heritabilities of the traditional MCPs, the new parameters (CFt modeling and the MCF traits) and milk pH, and to investigate their associations with 51 SNPs from 37 candidate genes in Brown Swiss cows.
Material and methods
Field data
The present study is part of the Cowplus Project described by Cipolat-Gotet et al. (Reference Cipolat-Gotet, Cecchinato, De Marchi, Penasa and Bittante2012). Briefly, a total of 1271 Brown Swiss cows from 85 herds located in Trento Province (Italy) were sampled once. Details on the milk sampling procedure, cows, herds and pedigree were previously reported (Cecchinato et al., Reference Cecchinato, Ribeca, Chessa, Cipolat-Gotet, Maretto, Casellas and Bittante2014).
Analysis of milk acidity and MCPs
Before MCP analysis, pH was measured using a Crison Basic 25 electrode (Crison, Barcelona, Spain). MCPs were obtained using two mechanical lactodynamographs (Formagraph; Foss Electric A/S, Hillerød, Denmark) according to the procedure described by Cipolat-Gotet et al. (Reference Cipolat-Gotet, Cecchinato, De Marchi, Penasa and Bittante2012). Each individual milk sample (10 ml) was heated to 35°C and mixed with 200 μl of a 1.2% (w/v) rennet solution (Hansen Standard 215 with 80±5% chymosin and 20±5% pepsin; Pacovis Amrein AG, Bern, Switzerland) diluted in distilled water to yield 0.051 IMCU×ml−1. The observation period lasted 90 min, beginning immediately after the addition of rennet. The instrument recorded the width (in mm) of the oscillatory graph every 15 s during testing and directly provided the traditional MCP traits: RCT (min), defined as the time from enzyme addition to milk gelation; k20 (min), defined as the time from gelation to that at which the width of the graph reached 20 mm; and the widths of the graph at 30 min (a30, mm), from rennet addition (measuring the extent of CF).
Modeling the CF of individual milk samples
CF was measured every 15 s for 90 min, for a total of 360 recorded CF values per sub-sample. The four-parameter equation proposed by Bittante et al. (Reference Bittante, Contiero and Cecchinato2013) for modeling an extended observation of CF was used to analyze the data. The four-parameter model is given as follows:
 $$CF_{t} \,=\,CF_{P} \,{\times}\,(1\,{\minus}\,e^{{{\minus}k_{{{\rm CF}}} {\times}(t{\minus}{\rm RCT}_{{{\rm eq}}} )}} )\,{\times}\,e^{{{\minus}k_{{{\rm SR}}} {\times}(t{\minus}{\rm RCT}_{{{\rm eq}}} )}} $$
where CFt is the CF at time t (mm), CFP the asymptotic potential maximum value of CF (mm), kCF the curd firming instant rate constant (%×min−1), kSR the curd syneresis instant rate constant (%×min−1) and RCTeq is the rennet coagulation time (min). Thus, CF represents a function of the maximum asymptotic CF (CFP) and the processes of curd firming and syneresis (represented by the two rate constants). The first constant, kCF, is assumed to increase CF toward its potential asymptotic value (CFP), while kSR is assumed to reduce CF toward zero due to the expulsion of whey and the free floating of curd. After gelation, kCF prevails over kSR, and CF increases until the values of the two opposing phenomena are equal and a maximum value (CFmax) is achieved at time tmax. Thereafter, the curve descends toward a null asymptotic value (Figure 1). This model uses all available information to estimate the four parameters, and these non-single-point measurements are less interdependent than the traditional MCPs. Moreover, this method allows us to estimate the traditional parameters of RCT, k20 and a30, as well as CFmax and tmax. The CFt observations obtained for each sub-sample were fitted with curvilinear regressions using the non-linear procedure (PROC NLIN) of SAS (SAS Institute Inc., Cary, NC, USA). The parameters of each individual equation were estimated by employing the Marquardt iterative method (350 iterations and a 10−5 level of convergence).
Blood sampling, DNA extraction, SNP selection and genotyping
Blood sampling, DNA extraction and SNP selection and genotyping were performed as previously described (Cecchinato et al., Reference Cecchinato, Ribeca, Chessa, Cipolat-Gotet, Maretto, Casellas and Bittante2014). Briefly, DNA was extracted using a DNeasy® 96 Blood & Tissue Kit (Qiagen, Hilden, Germany) from 100 µl of individual whole blood, quantified using the QBit system (Invitrogen, Carlsbad, CA, USA) and assessed for integrity by 1% agarose gel electrophoresis. Owing to the scarcity of information regarding the association of individual genes with milk coagulation traits, other genes believed to influence MCP-correlated milk characteristics were considered as candidate genes. Out of 113 SNPs initially selected we chose the 89 SNPs with the best Illumina designability rank scores and seven SNPs with scores between 0.5 and 0.6. The 96 selected SNPs, which are located in 54 genes and span 22 chromosomes, were genotyped with the GoldenGate system (Illumina, San Diego, CA, USA). We retained 51 polymorphic SNPs (in 37 candidate genes) for the association analysis (Cecchinato et al., Reference Cecchinato, Ribeca, Chessa, Cipolat-Gotet, Maretto, Casellas and Bittante2014).
Statistical analysis
Genetic variations in MCPs, CFt, the MCF traits and acidity were investigated with the following mixed linear animal model:
 $$y_{{ijkl }} =\mu \,{\plus}\,{\rm DIM}_{i} \,{\plus}\,{\rm Parity}_{j} \,{\plus}\,h_{k} \,{\plus}\,a_{l} \,{\plus}\,{\varepsilon}_{{ijkl}} $$
where y ijkl is the phenotypic record for the analyzed trait; DIM i the effect of the i th class of days in milk (DIM; i=1 to 10; 30 days for each class, with class 1 being <30 days and class 10 being >300 days); parity j the effect of the j th parity of the cow (j=1 to 5 or more); h k the effect of the k th herd (k=1 to 85); a l the infinitesimal genetic effect of individual l; and ε ijkl the random residual term. For a30, the renneting meter sensor of the lactodynamograph (10 levels) was included as an additional systematic effect, as previously reported by Cecchinato et al. (Reference Cecchinato, Cipolat-Gotet, Casellas, Penasa, Rossoni and Bittante2013).
The association studies for all investigated genes were carried out using a Bayesian methodology. The following mixed linear animal model was used:
 $$y_{{ijkl }} \,=\,\mu \,{\plus}\,{\rm DIM}_{i} \,{\plus}\,{\rm Parity}_{j} \,{\plus}\,h_{k} \,{\plus}\, a_{l} \,{\plus}\,x_{{lm}} \beta _{m} \,{\plus}\,{\varepsilon}_{{ijkl}} $$
where y ijkl is the phenotypic record for the analyzed trait; DIM i , Parity j , h k and a l are as described in model 1; x lm (0,1,2) reflects the number of copies of the minor allele at the m th SNP of subject l;β m is the additive genetic effect of the l th SNP; and ε ijkl the random residual term.
For the univariate analyses, bounded uniform priors were used for all environmental variables, and a and h were assumed a priori to be independent and normally distributed, as:
 $$\eqalignno{ & {\bf a}\mid\sigma _{a}^{2} \,\sim\,N(0,{\bf A}\sigma _{a}^{2} )\,{\rm and } \cr & {\bf h}\mid\sigma _{h}^{2} \,\sim\,N(0,{\bf I}\sigma _{h}^{2} ) $$
where A is the known additive genetic relationship matrix and I the identity matrix. The pedigree file included information on 8845 animals; there were 1326 sires, 264 of which had progeny (between 2 and 80 daughters) with records in the data set.
The marginal posterior distributions of all parameters were obtained using a Gibbs sampler running with a single chain of 1 000 000 points; the first 50 000 were discarded as burn-in, as previously tested by Raftery and Lewis (Reference Raftery and Lewis1992). Samples were saved every 100 iterations. Owing to autocorrelations between successive samples, convergence was tested using Geweke’s Z-criterion (Geweke, Reference Geweke1992). Monte Carlo sampling errors and the effective sample size were computed using the time-series procedures described by Geyer (Reference Geyer1992). The parameters of concern were the dispersion parameters and the additive effects of SNPs, as defined by Falconer and Mackay (Reference Falconer and Mackay1996). The posterior mean was used as a point estimate for the parameter of concern. The lower and upper bounds of the 95% highest posterior probability density regions (HPD95) for each additive effect were estimated from the Gibbs samples. For all traits, the model was fitted to separately estimate the contribution of each SNP (i.e., the model was run 51 times/trait). A SNP was considered as having a relevant effect on the trait when the posterior means of the additive effect did not include 0 in the HPD95 interval. Moreover, as suggested by Ramírez et al. (Reference Ramírez, Quintanilla, Varona, Gallardo, Diaz, Pena and Amills2013), we computed PPN0, which was the posterior probability of the estimated effect of being <0 for negative effects or >0 for positive effects. Only relevant SNPs are presented in the tables. The genetic variance explained by a given SNP (Va) was calculated from the estimated genotypic effects and the observed genotypic frequencies. The results are expressed as the percentage of the total additive genetic variance obtained from model 1 without the genotypic effect.
Intra-herd heritability, which was computed without considering the SNP effect in the model, was defined as:
 $$h^{2} ={{\sigma _{a}^{2} } \over {\sigma _{a}^{2} {\plus}\sigma _{e}^{2} }}$$
where
 $$\sigma _{a}^{2} $$
and
 $$\sigma _{e}^{2} $$
are the additive genetic and residual variances, respectively.
Results and discussion
Descriptive statistics
The descriptive statistics for the investigated traits are reported in Table 1. A comprehensive discussion of the phenotypic variations among MCP traits was previously published by Cipolat-Gotet et al. (Reference Cipolat-Gotet, Cecchinato, De Marchi, Penasa and Bittante2012). In the present work, the average values for RCT and k20 were 19.95 and 5.36 min, respectively, whereas the average value for a30 was 30.09 mm. Notably, we were able to obtain RCT and k20 values for all samples because we prolonged the observation time to 90 min after rennet addition. The presence of late-coagulating samples in our analysis helps explain why our average RCT values are higher than those in the previous report (Bittante et al., Reference Bittante, Penasa and Cecchinato2012). The new parameters of CF modeled at time t had average values of 20.79 min, 54.46 mm, 12.45%×min−1 and 1.38%×min−1 for RCTeq, CFP, kCF and kSR, respectively. On average, CFmax was 37.08 mm and tmax was 40.68 min. The pH values obtained in the present work were similar to those reported by Ikonen et al. (Reference Ikonen, Morri, Tyrisevä, Ruottinen and Ojala2004) and Bonfatti et al. (Reference Bonfatti, Cecchinato, Gallo, Blasco and Carnier2011).
Descriptive statistics of milk coagulation properties (MCPs), of parameters of curd firmness at time t modeling (CFt), of maximum curd firmness traits (MCF) and of acidity (n=1271)

P1=1st percentile; P99=99th percentile; RCT=rennet coagulation time of samples coagulating within 45 min from enzyme addition; k20=curd-firming time of samples reaching 20 mm of firmness within 45 min from enzyme addition; a30=curd firmness at 30 min after enzyme addition; RCTeq=rennet coagulation time estimated using the CFt equation; CFP=asymptotic potential curd firmness; kCF=curd firming instant rate constant; kSR=syneresis instant rate constant; CFmax=maximum curd firmness achieved within 45 min; tmax=time at achievement of CFmax.
Variance components and heritability
The point estimates and features of the marginal posterior densities for the additive genetic variances and heritabilities of the considered traits (without considering SNP effects) are reported in Table 2. The genetic variances for the MCP traits were 7.335, 2.22 and 22.107 mm2 for RCT, k20 and a30, respectively. The corresponding estimates of intra-herd heritability were 0.267, 0.227 and 0.187, respectively. The (co)variance components and heritability estimates for the MCPs were reported from the same data set by Cecchinato et al. (Reference Cecchinato, Cipolat-Gotet, Casellas, Penasa, Rossoni and Bittante2013). However, no previous study has considered these components and estimates for the new CFt parameters and CFmax. Here, we found that the genetic variances for CFt parameters were 6.639 min2, 12.377, 6.274 and 0.024 mm2 for RCTeq, CFP, kCF and kSR, respectively. For the same traits, the heritability estimates were 0.258, 0.064, 0.230 and 0.077, respectively. The estimated additive genetic variances for the MCF traits were 8.069 mm2 for CFmax and 25.164 min2 for tmax, while the corresponding estimates of heritability were 0.191 and 0.278, respectively. With the exception of the low estimates obtained for CFP and kSR, the new CF modeling traits showed heritability values between 0.191 and 0.278, which were similar to those of the traditional MCPs found for this data set (0.187 to 0.267).
Features of marginal posterior densities of additive genetic (
 $$\sigma _{A}^{2} $$
), herd (
 $$\sigma _{h}^{2} $$
) and residual (
 $$\sigma _{e}^{2} $$
) variance and heritability for milk coagulation properties (MCPs), parameters of curd firmness modeling on time t (CFt), maximum curd firmness traits (MCF) and acidity

Estimate=mean of the marginal posterior density of the parameter; HPD95=lower and upper bound of the 95% highest posterior density region; RCT=rennet coagulation time of samples coagulating within 45 min from enzyme addition; k20=curd-firming time of samples reaching 20 mm of firmness within 45 min from enzyme addition; a30=curd firmness at 30 min after enzyme addition; RCTeq=rennet coagulation time estimated using the CFt equation; CFP=asymptotic potential curd firmness; kCF=curd firming instant rate constant; kSR=syneresis instant rate constant; CFmax=maximum curd firmness achieved within 45 min; tmax=time at achievement of CFmax.
The point estimate of the genetic variance component for pH was 0.001, which was comparable to that obtained by Cecchinato et al. (Reference Cecchinato, Penasa, De Marchi, Gallo, Bittante and Carnier2011) using a different data set of the same breed. As expected, the intra-herd heritability obtained in the present study (0.333) was higher than the previous across-herd estimate (Cecchinato et al., Reference Cecchinato, Penasa, De Marchi, Gallo, Bittante and Carnier2011).
Association analysis with traditional MCPs
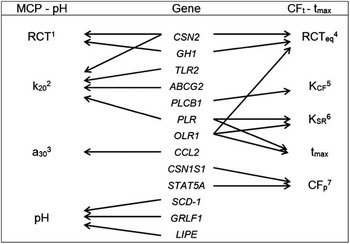
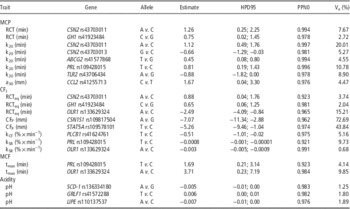
The features of the marginal posterior densities of the additive effects for the relevant SNPs with respect to MCPs are reported in Table 3. The marginal posterior distributions of the additive effects were approximately normal. A total of 14 tested SNPs located in 13 genes (two SNPs belonged to CSN2) were significantly associated with at least one of the cheesemaking-related traits or milk acidity. Figure 2 shows a map of the relevant relationships between the traits and candidate genes.
Map of relevant relationships between candidate genes in the central column and the milk coagulation properties (MCPs): RCT, k20 and a30 and acidity pH on the left column and with the parameters of curd firmness modeling on time t (CFt): RCTeq, kCF, kSR and CFP and time to maximum curd firmness (tmax) on the right column. 1RCT=rennet coagulation time of samples coagulating within 45 min from enzyme addition. 2k20=curd-firming time of samples reaching 20 mm of firmness within 45 min from enzyme addition. 3a30=curd firmness at 30 min after enzyme addition. 4RCTeq=rennet coagulation time estimated using the CFt equation. 5kCF=curd firming instant rate constant. 6kSR=syneresis instant rate constant. 7CFP=asymptotic potential curd firmness.

Features of the estimated marginal posterior densities of additive effects and of the proportion of additive variance of the trait explained (Va) for the relevant single nucleotide polymorphism (SNP)Footnote 1 on milk coagulation properties (MCPs), on parameters of curd firmness modeling on time t (CFt), on maximum curd firmness traits (MCF) and on acidity

Estimate=mean of the marginal posterior density of the parameter; HPD95=lower and upper bound of the 95% highest posterior density region; PPN0=the posterior probability of the additive effect to be over or below zero; Va (%)=proportion of genetic variance explained by each SNP; RCT=rennet coagulation time of samples coagulating within 45 min from enzyme addition; k20=curd-firming time of samples reaching 20 mm of firmness within 45 min from enzyme addition; a30=curd firmness at 30 min after enzyme addition; RCTeq=rennet coagulation time estimated using the equation; CFP=asymptotic potential curd firmness; kCF=curd firming instant rate constant; kSR=syneresis instant rate constant; CFmax=maximum curd firmness achieved within 45 min; tmax=time at achievement of CFmax.
1 SNP were considered having a relevant effect on the trait when the posterior means of the additive effect did not include 0 in the HPD interval.
Considering the traditional MCPs, seven SNPs were found to affect the coagulation traits. RCT was positively associated with CSN2 rs43703011 (A v. C=+1.26 min; PPN0=0.994; Va=7.67%) and GH1 rs41923484 (C v. G=+0.75 min; PPN0=0.978; Va=2.72%). The CSN2 rs43703011 C allele is common to the A2, A3 and I variants of the gene. However, since CSN2 rs109299401 (which distinguishes the I allele from the A2 allele) and CSN2 rs43703012 (which distinguishes the A3 allele from the A2 allele) were found to be monomorphic in the present population, the C allele herein acts as a marker of the CSN2*A2 variant, whereas the A allele (frequency of 0.23) corresponds to the A1, B and (rarely) C variants (Caroli et al., Reference Caroli, Chessa and Erhardt2009). As noted by Cecchinato et al. (Reference Cecchinato, Ribeca, Chessa, Cipolat-Gotet, Maretto, Casellas and Bittante2014), the CSN2 rs43703013 C allele discriminates the B and C alleles from the A1 allele. Here, the B allele (frequency, 0.16) was over-represented compared with the A1 allele (0.07) in the CSN2 rs43703011 allele C genes. This finding is similar to that from a previous report on the Brown Swiss (Chessa et al., Reference Chessa, Bulgari, Rossoni, Ceriotti and Caroli2013). At present, it is not possible to establish whether the less favorable effect of the CSN2 rs43703011 A variant on RCT is due to the presence of the A1 or B alleles, and the positive effect of the CSN2 B allele reported by Bittante et al. (Reference Bittante, Penasa and Cecchinato2012) remains controversial. Moreover, the CSN2*A 2 variant is usually found in a haplotype with the CSN3*B variant (frequency, 0.56 to 0.67; Chessa et al., Reference Chessa, Bulgari, Rossoni, Ceriotti and Caroli2013), suggesting that the positive effect of the CSN2 rs43703011 C allele could be confused with that of the CSN3*B variant. Notably, the casein genes were previously reported to show varied associations with MCPs (Caroli et al., Reference Caroli, Chessa and Erhardt2009). In particular, the B variant of CSN3 was shown to have a positive effect on MCP, while the E variant was observed to negatively affect CF. The B allele has been associated with milk that exhibits a shorter curdling time, a higher protein percentage, higher stability during freezing, greater cheese yield and more consistent curd formation (Lunden et al., Reference Lunden, Nilsson and Janson1997; Wedholm et al., Reference Wedholm, Larsen, Lindmark Mansson, Karlsson and Andren2006; Heck et al., Reference Heck, Schennink, van Valenberg, Bovenhuis, MHPW, van Arendonk and van Hooijdonk2009).
Regarding other genes, the CSN3 rs110870535 G allele was fixed and no C variant was present in our data set. In addition, the CSN3 rs43703015 C allele, which distinguishes the B and C variants from the A-derived alleles, had a lower frequency compared with the T allele. Thus, even if the other CSN3 loci failed during the analysis (possibly because these SNPs are too close together, compromising primer hybridization), the frequency of the B allele in our population could be estimated at about 0.78. This was even higher than that found by Chessa et al. (Reference Chessa, Bulgari, Rossoni, Ceriotti and Caroli2013), who reported it increasing from 0.64 to 0.71. This indicates that selection is rapidly increasing the frequency of the B allele. Indeed, the B allele is included in the total economic index used for selection of the Italian Brown Swiss population, and its effect may therefore already be incorporated in our analysis. The GH1 rs41923484 C allele was also found to be associated with a decrease in casein content in the same data set (Cecchinato et al., Reference Cecchinato, Ribeca, Chessa, Cipolat-Gotet, Maretto, Casellas and Bittante2014), potentially explaining the negative relationship with RCT. The curd-firming time (k20) yielded the most associations, including those with CSN2 rs43703011 (A v. C=+1.12 min; PPN0=0.997; Va=20.01%), CSN2 rs43703013 (G v. C=−0.66 min; PPN0=0.981; Va=5.27%), ABCG2 rs41577868 (T v. G=+0.45 min; PPN0=0.994; Va=4.55%), PRL rs109428015 (T v. C=+0.81 min; PPN0=0.996; Va=10.78%) and TLR2 rs43706434 (A v. G=−0.88 min; PPN0=0.978; Va=8.90%). As noted above for RCT, the CSN2 rs43703011 A allele was found to be responsible for the deterioration of k20 (+1.12 min; PPN0=0.997). Considering that the CSN2 rs43703013 C allele (a marker of the B/C variants) is positively associated with k20 (−0.66 min, PPN0=0.98), we propose that the A1 variant could be responsible for the observed worsening of k20.
The ABCG2 protein facilitates the transport of hydrophobic substances across cellular membranes, and the encoding gene has been associated with mammary epithelial cell proliferation. Given that mammary cell numbers are positively correlated with milk production, researchers have speculated that functional variations in ABCG2 may affect milk production (Wei et al., Reference Wei, Geale, Sheehy and Williamson2012). However, a SNP in this gene was not found to affect milk production traits in the same population studied in the present paper (Cecchinato et al., Reference Cecchinato, Ribeca, Chessa, Cipolat-Gotet, Maretto, Casellas and Bittante2014). This suggests that the effect of such SNP on k20 could be due to the transportation of MCP-modulating metabolites or possible linkage with a yet-unknown SNP. The first hypothesis is supported by the observation that ABCG2, which is highly synthesized and up-regulated in lactating bovine mammary tissue, is also present in the milk fat globule membrane; there, it plays an essential role in promoting the secretion of important milk constituents through a yet-unidentified mechanism (Bionaz and Loor, Reference Bionaz and Loor2008).
PRL rs109428015 and TLR2 rs43706434 were also found to be important in explaining the variation of k20. TLR2 is a receptor for cell-wall components of gram-positive bacteria; it recognizes a highly diverse set of pathogen-associated motifs and triggers differential intracellular signaling pathways, thereby playing an important role in an individual’s resistance against infection, including mastitis (Fleminger et al., Reference Fleminger, Heftsi, Uzi, Nissim and Gabriel2011). In a comparative study of casein hydrolysis and its effect on clotting parameters in milk from cows that were sub-clinically infected with four major udder pathogens (Staphylococcus aureus, Escherichia coli, Streptococcus dysgalactiae and Staphylococcus chromogenes), Leitner et al. (Reference Leitner, Krifucks, Merin, Lavi and Silanikove2006) found that milk from infected glands possessed inferior clotting parameters. Since TRL2 is known to protect casein against hydrolysis by bacterial enzymes, the association of TLR2 with a better milk clotting aptitude could reflect increased protection of caseins by the A variant of TLR2.
The a30 value was influenced only by CCL2 rs41255713. The posterior distribution of the additive effect showed that the C allele increased CF by 1.67 mm (PPN0=0.976), with the SNP explaining 4.47% of the additive genetic variance. CCL2 belongs to the chemokine family; together with its receptor, CCL2 contributes to the trafficking of leukocytes to the mammary gland (Nishimura, Reference Nishimura2003) and may play important roles in the host immune response during acute and chronic intramammary infections. Thus, the association of CCL2 with better coagulation could reflect higher infection responses and increased protection of milk components.
Association analysis with CF modeling parameters
The effects mapped in Figure 2 show that (except for RCTeq) the genes affecting the CFt parameters and CFmax differ from those that influence the traditional MCPs. In the case of RCTeq, our results confirmed its significant associations with GH1 rs41923484 and CSN2 rs43703011. The C allele of GH1 rs41923484 increased the considered parameter by +0.65 min (PPN0=0.981; Va=2.04%), while the A allele of CSN2 rs43703011 increased it by +0.88 min (PPN0=0.923; Va=3.74%). Interestingly, RCTeq was significantly associated with a SNP that was not associated with the traditional single-point RCT. This result highlights how the RCTeq should be considered as a different trait respect to the traditional one. For OLR1 rs133629324, the estimated substitution effect of the A allele was −2.49 min (PPN0=0.965; Va=15.21%). ORL1 encodes a low-density lipoprotein receptor belonging to the C-type lectin superfamily. This gene is regulated through the cyclic adenosine monophosphate signaling pathway, and has been reported to affect milk fat yield, milk fat percentage (Khatib et al., Reference Khatib, Rosa, Weigel, Schiavini, Santus and Bagnato2007) and milk fat composition. Regarding the milk fat composition, a SNP in the 3' UTR of OLR1 showed associations with the long chain fatty acid, C18:0, and with the C18 and CLA indices. Since we did not analyze fatty acids or their relationships with coagulation traits, we were unable to assess whether this gene had indirect effects on fat composition, resulting in differences among the technological properties of the produced milk. Notably, however, the effect of OLR1 rs133629324 on RCTeq was much more important than those of the other two SNPs on both RCTs.
Interesting associations were found between the asymptotic CFp and CSN1S1 rs109817504 (A v. G=−7.07 mm; PPN0=0.962) and STAT5A rs109578101 (T v. C=−5.264 mm; PPN0=0.974), with both genes explaining very high proportions of the additive genetic variance (72.69% and 43.84%, respectively). CSN1S1 rs109817504 distinguishes allele 1 of the CSN1S1 promoter from the other alleles (Prinzenberg et al., Reference Prinzenberg, Weimann, Brandt, Bennewitz, Kalm, Schwerin and Erhardt2003). A previous comparison of genotype 12 v. 22 at the CSN1S1 rs109817504 locus showed significant effects on milk protein yield (Prinzenberg et al., Reference Prinzenberg, Weimann, Brandt, Bennewitz, Kalm, Schwerin and Erhardt2003), which could be responsible for the effect observed on CFp. However, no association was found in the population utilized herein on milk protein yield (Cecchinato et al., Reference Cecchinato, Ribeca, Chessa, Cipolat-Gotet, Maretto, Casellas and Bittante2014) and further study is warranted to understand its effect. Regarding STAT5A, the encoded protein is a member of the STAT family of transcription factors. In response to cytokines and growth factors, the receptor-associated kinases phosphorylate STAT family members, which homo- or hetero-dimerize, translocate to the cell nucleus, and act as transcriptional activators. STAT5A is activated by and mediates the responses of many cell ligands, including IL2, IL3, IL7 GM-CSF, erythropoietin, thrombopoietin and various growth hormones. STAT5A was first identified as a PRL-induced mammary gland factor (Gouilleux et al., Reference Gouilleux, Wakao, Mundt and Groner1994) and has been demonstrated to play critical roles in regulating apoptosis, promoting proliferation and enhancing cell cycle progression (Paukku and Silvennoinen, Reference Paukku and Silvennoinen2004). This gene was previously reported to have effects on the milk protein percentage, the milk fat percentage and embryonic survival (Khatib et al., Reference Khatib, Monson, Schutzkus, Kohl, Rosa and Rutledge2008). The present study is the first to report that STAT5 appears to be associated with milk coagulation traits.
The instant rate constant, kCF, was associated with phospholipase C β1 (PLCB1) rs41624761 (T v. C=−0.51%×min−1; PPN0=0.975; Va=5.16%). The encoded protein is responsible for hydrolyzing ~90% of the lipid phosphorus in the low- and high-density lipoprotein fractions of milk, and is known to catalyze the formation of inositol 1,4,5-trisphosphate and diacylglycerol from phosphatidylinositol 4,5-bisphosphate. This reaction uses calcium as a cofactor and plays important roles in the intracellular transductions of many extracellular signals. Thus, it would be interesting to further analyze the effect of this gene and verify that a functional mutation could affect minor components of milk, thereby influencing its technological properties. The analyzed mutation is located in an intronic region, and thus our result is likely to reflect linkage rather than a causative mutation.
The other instant rate constant, kSR, was associated with PRL rs109428015 (T v. C=−0.0008%×min−1; PPN0=0.921; Va=9.73%) and OLR1 rs133629324 (A v. C=−0.003%×min−1; PPN0=0.991; Va=0.68%). The linkage of these two genes with coagulation traits was discussed above. Their association with tmax is not surprising given that this parameter measures the time at which the positive effect of kCF on CF is fully compensated by the negative effect of kSR. Here, the estimated substitution effect of the PRL rs109428015 T allele was +1.69 min (PPN0=0.923; Va=4.14%), and that of the OLR1 rs133629324 A allele was +3.71 min (PPN0=0.984; Va=9.85%).
Association analysis with milk acidity
Finally, relevant associations with milk acidity were observed for SCD-1 rs136334180, GRLF rs41572288 and LIPE rs110137537. The SCD-1 rs136334180 A allele was associated with a 0.005-unit reduction in the pH value (PPN0=0.983); the GRLF rs41572288 T allele was associated with a 0.006-unit increase in pH (PPN0=0.982); and the LIPE rs110137537 A allele was associated with a 0.007-unit decrease in pH (PPN0=0.976). The three SNPs explained small proportions of the genetic variance in milk acidity (Va ranging from 1.25% to 1.89%). Both SCD-1 rs136334180 and GRLF rs41572288 had previously been associated with milk traits (the fat and lactose percentages, respectively) (Cecchinato et al., Reference Cecchinato, Ribeca, Chessa, Cipolat-Gotet, Maretto, Casellas and Bittante2014), which explains their effects on the composition and technical properties of milk. In the future, the relationships of various coagulation properties with LIPE, which is one of the most important lipolysis-mediating genes, should be studied in greater detail.
Conclusions
The parameters of CF modeled over time (CFt) are heritable and characterized by heritability values similar to those of the traditional MCPs and generally similar to or greater than those of the milk yield and content and part of their heritability seems to be due to polymorphisms in genes analyzed in the present paper. Indeed, the results presented herein confirm some of the previously documented associations (e.g., those between CSN2 and MCPs) and a number of novel associations were identified: SNPs in ABCG2, CCL2, GH1, PRL and TLR2 were found to be associated with MCPs; SNPs in GRLF1, LIPE and SCD-1 were found to be associated with milk acidity; and SNPs in CSN1S1, CSN2, GH1, OLR1, PLCB1, PRL and STAT5A were found to be associated with CFt and the MCF traits. Moreover, some different associations found between CFt and MCF traits demonstrate that the changes that characterized the cheesemaking process are too complex to be sufficiently represented by three single-point measures as in MCF and different genes are involved in the coagulation phase. The observed associations could potentially be attributed to effects on casein content (GH1), changes in the number of cells in the mammary gland (GH1, ABCG2 and PRL), the transporter-related presence of metabolites in the milk (ABCG2), and the inflammatory response (TLR2). There are undoubtedly relevant linkages and mutations that were not analyzed herein, but our results clearly indicate that polymorphisms in the abovementioned genes should be considered when we seek to develop the next generation of systems-biology models for metabolic efficiency and related production in the dairy cow. Although further research is needed to verify the roles of the significantly associated SNPs and validate them in other populations and breeds, the identified associations between these markers and milk technological traits could be exploited in gene-assisted selection programs for the genetic improvement of the Brown Swiss population.
Acknowledgments
This research was supported by the University of Padova (CPDA 114230/11). The authors acknowledge the Italian Brown Swiss Cattle Breeders Association (ANARB, Verona, Italy) for supplying pedigree information, the Superbrown Consortium of Bolzano and Trento, and Trento Province (Italy) for financial and technical support.